. 2024 May 29;19(5):e0302459.
doi: 10.1371/journal.pone.0302459. eCollection 2024.

Effects of post-saccadic oscillations on visual processing times

Affiliations

Effects of post-saccadic oscillations on visual processing times

Emsal Llapashtica et al. PLoS One. .

Abstract

Saccadic eye movements enable us to search for the target of interest in a crowded scene or, in the case of goal-directed saccades, to simply bring the image of the peripheral target to the very centre of the fovea. This mechanism extends the use of the superior image processing performance of the fovea over a large visual field. We know that visual information is processed quickly at the end of each saccade but estimates of the times involved remain controversial. This study aims to investigate the processing of visual information during post fixation oscillations of the eyeball. A new psychophysical test measures the combined eye movement response latencies, including fixation duration and visual processing times. When the test is used in conjunction with an eye tracker, each component that makes up the 'integrated saccade latency' time, from the onset of the peripheral stimulus to the correct interpretation of the information carried by the stimulus, can be measured and the discrete components delineated. The results show that the time required to process and encode the stimulus attribute of interest at the end of a saccade is longer than the time needed to carry out the same task in the absence of an eye movement. We propose two principal hypotheses, each of which can account for this finding. 1. The known inhibition of afferent retinal signals during fast eye movements extends beyond the end point of the saccade. 2. The extended visual processing times measured when saccades are involved are caused by the transient loss of spatial resolution due to eyeball instability during post-saccadic oscillations. The latter can best be described as retinal image smear with greater loss of spatial resolution expected for stimuli of low luminance contrast.


Conflict of interest statement

The authors have declared that no competing interests exist.

Figures

Fig 1
Fig 1. Schematic representation of the timeline employed in the EMAIL test.
(a). The onset of the guides presented in the centre of the screen attract the subject’s fixation and signal the start of the experiment. Shortly afterwards a cue appears at the centre of the guides, indicating the need for steady fixation. In the first experiment, the test stimulus is presented in the periphery along the horizontal meridian, randomly on either side of fixation, for a fixed time, T, selected by the staircase. The subject’s task is to saccade towards the target and to register the orientation of the gap in the central ring (see a). The subject is then required to press one of four response buttons to indicate the position of the gap, or to simply guess when unable to decide. The time the subject takes to press the appropriate button affects only the decision response time and not the Integrated Saccade Latency time (δT). A four-alternative, forced-choice (4AFC) staircase procedure with variable step sizes is used to measure, δT. The latter represents the time the subject needs to achieve 71% probability of a correct response. The staircase employed varies the stimulus presentation time, T, using a ‘2-down, 1-up’ procedure. δT is then calculated by averaging the last 12 staircase reversals. No eye-tracker is needed to measure, δT. The addition of an eye-tracker does, however, make it possible to separate the various components that make up the ISL time. A typical record of a single rightward saccade, as recorded with the EyeLink1000 is shown in (b). The signal depicts all three saccade parameters where the latency is denoted as T1 and corresponds to the time required to detect the stimulus and prepare the saccadic eye movement. The saccade duration is denoted by T2. T3 represents the remaining stimulus time the subject can use to process the information of interest in the visual stimulus. (b) also shows the components T1, T2 and T3 which make up δT. Additional experiments were also carried out with the stimulus presented at the point of fixation in the absence of saccadic eye movements. The subject’s task remained unchanged, but no eye movements were involved.
Fig 2
Fig 2
Stimulus duration times as measured on the display (a), eye trace recordings (b) and the corresponding response latency histogram (c). (a) Stimulus durations as recorded with the photodiode system on the 60Hz visual display for a constant stimulus presentation time of 230ms. As the stimulus is presented on the screen, the photodiode and the associated electronics generate a TTL signal that begins on stimulus onset and terminates on stimulus offset. This arrangement enables the measurement of the actual time of the stimulus on the screen. Leftward and rightward eye traces are shown in (b). The start of each saccade (shown by the coloured lines) is synchronised with the onset of the stimulus. The frequency histogram of saccadic latencies is shown in (c) with the corresponding mean, median and standard deviation.
Fig 3
Fig 3
Mean saccade and velocity templates for rightward (a,b) and leftward (c,d) saccadic movements. Each thin coloured line corresponds to an individual saccade with velocity traces aligned with respect to the saccade onset time. The solid black and red lines represent the corresponding mean templates.
Fig 4
Fig 4. Mean saccade and velocity templates.
The occurrences of max and min peaks coincide precisely with zero crossings indicated by red dots. During the movement there is a phase difference of 90° between the eye position and velocity as the latter crosses the y-axis. The difference becomes zero when the eye approaches its mean position.
Fig 5
Fig 5
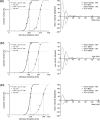
Examples of psychometric functions (left) corrected for chance probability and the corresponding return velocities (right) measured with 75% and 15% contrast stimuli for three subjects. Data are presented for three subjects. Black and grey traces are used to indicate results measured for the 75% and 15% contrast stimuli, respectively. The corresponding return velocities for leftward (dashed lines) and rightward saccades (solid lines) are shown on the right. The stimulus presentation time, ISL’, each subject needs to achieve 71% correct response is indicated by a coloured circle (75%) or a diamond (15%) with respect to stimulus onset in the left panel and with respect to the end of the saccade, in the right panel. The T3 durations are also indicated by coloured circles or diamond symbols shown on the x-axis of each figure in the right panel. Each velocity template is representative of the subject’s PSO movements that follow the end of the saccade.
Fig 6
Fig 6. Examples of psychometric functions corrected for chance probability measured at the point of regard, under steady fixation, with stimuli of 15% contrast.
Percentage correct responses and the corresponding return velocities are shown for three subjects. The stimulus presentation time, ISI’, each subject needs to achieve 71% correct response (in the absence of eye movements) is indicated in the top row by a red dot in each figure. For comparison, the same stimulus presentation times measured foveally at the point of regard are also plotted as red dots on the mean return velocity traces (in each of the lower figures) when the same stimulus was presented 8° in the periphery. In addition, the lower three figures also plot the measured ISL’ for 15% contrast stimuli at 8° eccentricity (coloured diamond). The results demonstrate that the time needed to process visual information at the end of each saccade is significantly longer when eye movements are involved.

Similar articles

Cited by

References

    1. Provis JM, Penfold PL, Cornish EE, Sandercoe TM, Madigan MC. Anatomy and development of the macula: Specialisation and the vulnerability to macular degeneration. Clinical and Experimental Optometry. 2005. Sep 1;88(5):269–81. doi: 10.1111/j.1444-0938.2005.tb06711.x - DOI - PubMed
    1. Wurtz RH. Neuronal mechanisms of visual stability. Vision Research. 2008. Sep;48(20):2070–89. doi: 10.1016/j.visres.2008.03.021 - DOI - PMC - PubMed
    1. Ross J, Morrone MC, Goldberg ME, Burr DC. Changes in visual perception at the time of saccades. Vol. 24, Trends in Neurosciences. 2001. Feb;24(2):113–21. doi: 10.1016/s0166-2236(00)01685-4 - DOI - PubMed
    1. Deubel H, Bridgeman B. Perceptual consequences of ocular lens overshoot during saccadic eye movements. Vision Research. 1995. Oct;35(20):2897–902. doi: 10.1016/0042-6989(95)00042-x - DOI - PubMed
    1. Tabernero J, Artal P. Lens oscillations in the human eye. Implications for post-saccadic suppression of vision. PLOS ONE. 2014. Apr 22;9(4):e95764. doi: 10.1371/journal.pone.0095764 - DOI - PMC - PubMed