. 2024 May 31;10(22):eadn7732.
doi: 10.1126/sciadv.adn7732. Epub 2024 May 29.

DNMT3B splicing dysregulation mediated by SMCHD1 loss contributes to DUX4 overexpression and FSHD pathogenesis

Affiliations

DNMT3B splicing dysregulation mediated by SMCHD1 loss contributes to DUX4 overexpression and FSHD pathogenesis

Eden Engal et al. Sci Adv. .

Abstract

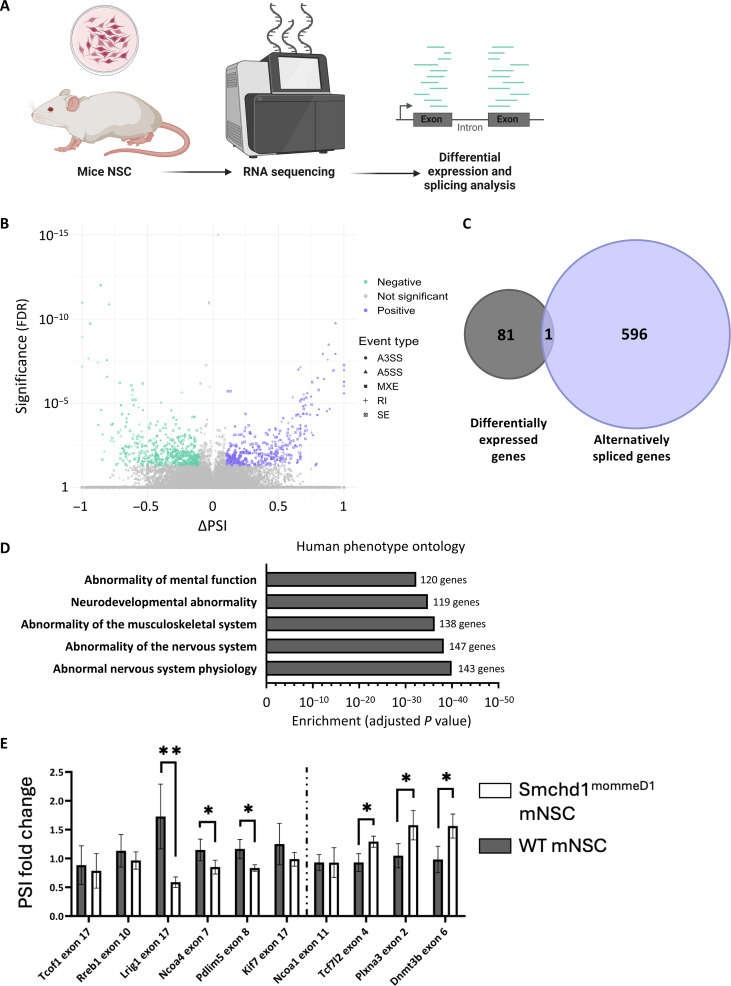
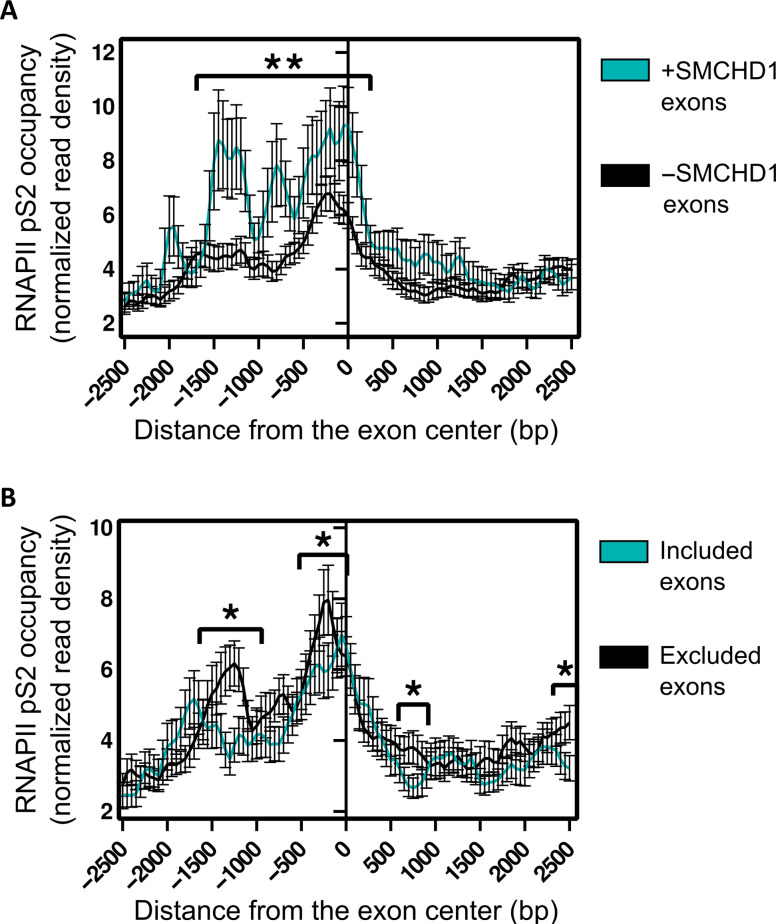
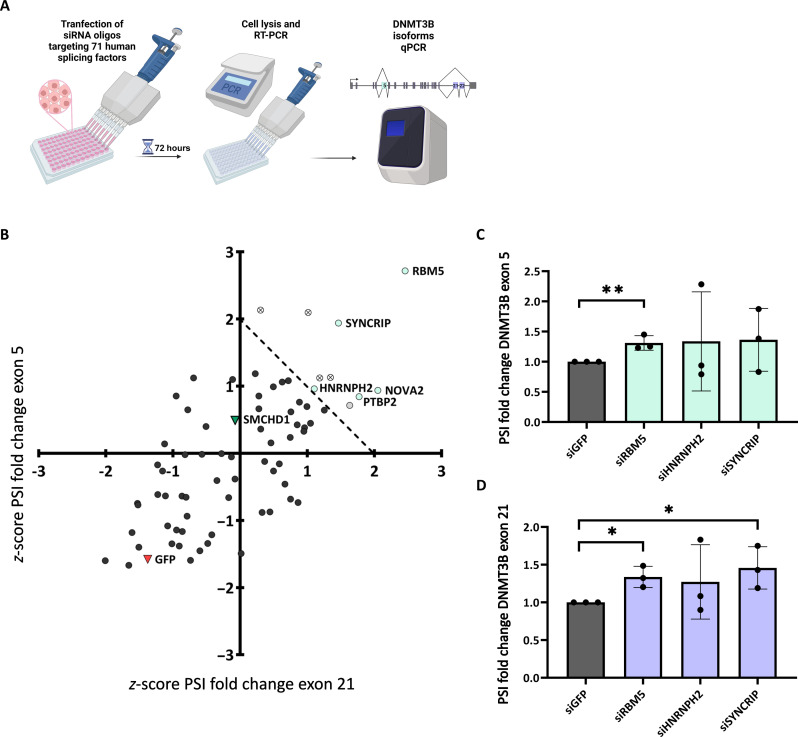
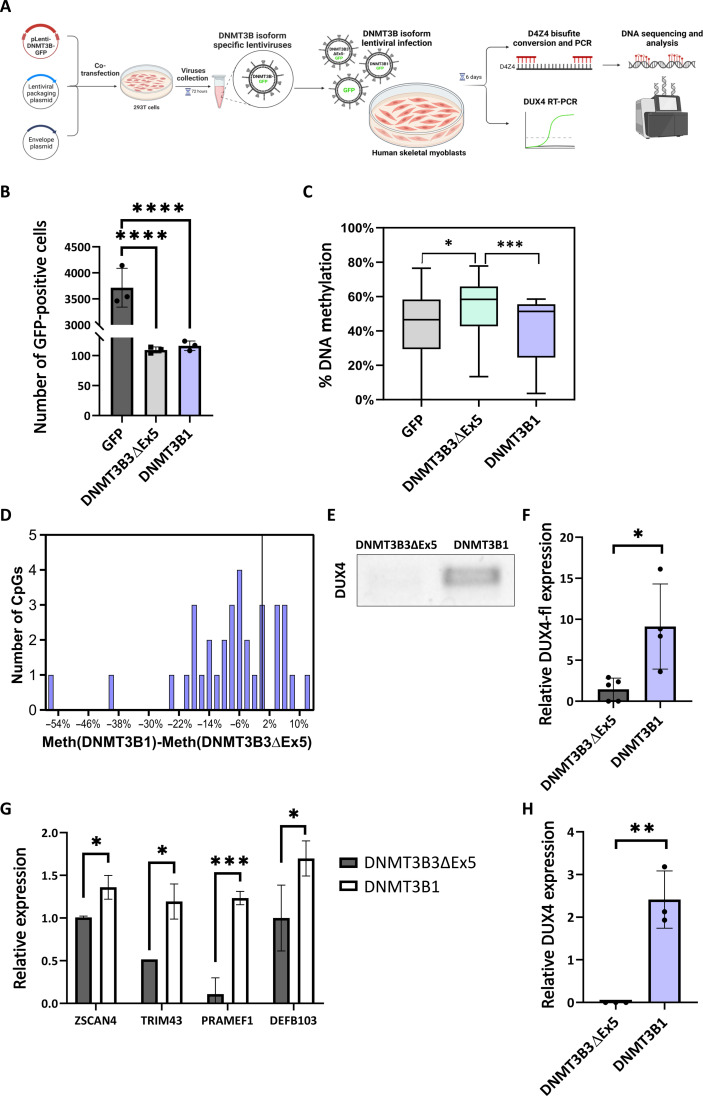
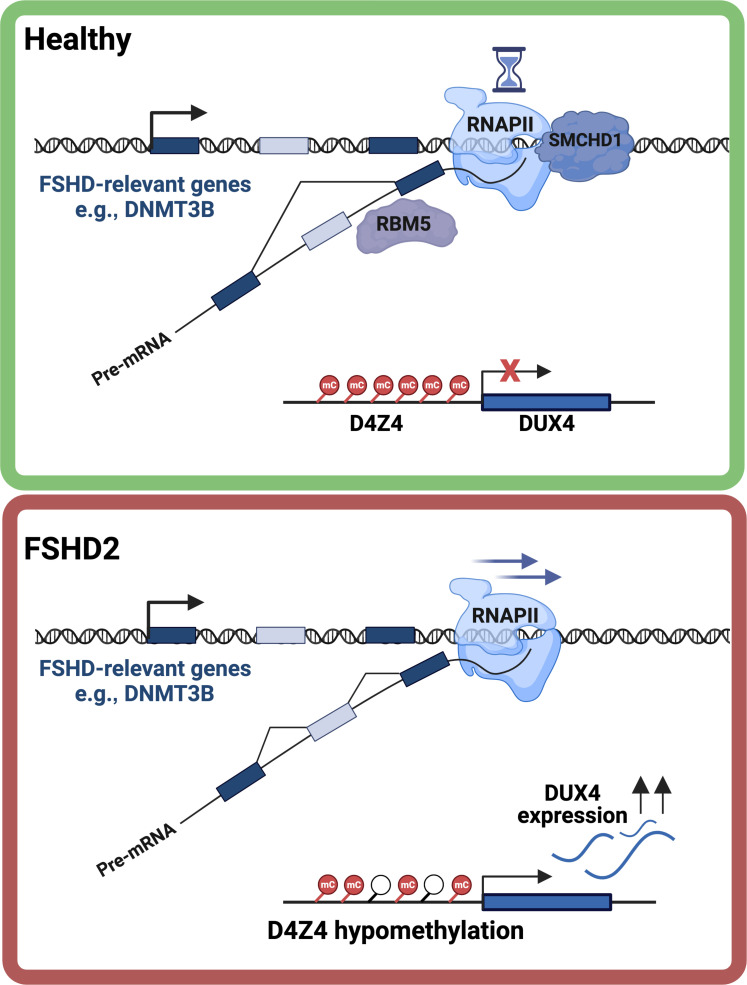
Structural maintenance of chromosomes flexible hinge domain-containing 1 (SMCHD1) is a noncanonical SMC protein and an epigenetic regulator. Mutations in SMCHD1 cause facioscapulohumeral muscular dystrophy (FSHD), by overexpressing DUX4 in muscle cells. Here, we demonstrate that SMCHD1 is a key regulator of alternative splicing in various cell types. We show how SMCHD1 loss causes splicing alterations of DNMT3B, which can lead to hypomethylation and DUX4 overexpression. Analyzing RNA sequencing data from muscle biopsies of patients with FSHD and Smchd1 knocked out cells, we found mis-splicing of hundreds of genes upon SMCHD1 loss. We conducted a high-throughput screen of splicing factors, revealing the involvement of the splicing factor RBM5 in the mis-splicing of DNMT3B. Subsequent RNA immunoprecipitation experiments confirmed that SMCHD1 is required for RBM5 recruitment. Last, we show that mis-splicing of DNMT3B leads to hypomethylation of the D4Z4 region and to DUX4 overexpression. These results suggest that DNMT3B mis-splicing due to SMCHD1 loss plays a major role in FSHD pathogenesis.


Figures

Fig. 1.
Fig. 1.. Smchd1 is a regulator of alternative splicing.
(A) RNA was extracted from NSCs from three Smchd1 null and two WT mice and deeply sequenced. Significant alternative splicing events were detected by rMATS analysis. (B) Volcano plot presenting all detected alternative splicing events: y axis represents statistical significance (FDR), and x axis represents the difference of PSI. Significant events (FDR < 0.05 and |ΔPSI| > 0.1) are colored purple (ΔPSI >0.1) or green (ΔPSI < −0.1). Proportion of each alternative splicing event is presented relative to WT. (C) Venn diagram presenting the overlap between differentially expressed and alternatively spliced genes in Smchd1 null NSCs. (D) Five most significantly enriched human phenotypes (HPO) with Smchd1 null alternatively spliced genes; bars present adjusted P value of enrichment, and number of alternatively spliced genes are annotated next to the bar. (E) Real-time PCR was conducted to measure relevant splicing change and total mRNA amount. Results are shown as PSI fold change as estimated by the ratio of exon inclusion to total mRNA levels of the gene. Plots represent the mean of three Smchd1 null and four WT samples; error bars represent SD (*P < 0.05; **P < 0.01).
Fig. 2.
Fig. 2.. Smchd1 binding is enriched downstream of its regulated excluded exons.
(A to D) Reanalysis of GFP ChIP-seq in primary mouse NSCs with endogenous Smchd1-GFP fusion protein; analysis was limited to expressed genes only [transcripts per million (TPM) > 1]. (A) Venn diagram presenting the overlap of mis-spliced exons and exons with nearby (<5 kbp) Smchd1-binding site. (B) Aggregation plot depicting the average normalized Smchd1 occupancy at and near exons mis-spliced (turquoise) or non–mis-spliced exons (black) in alternatively spliced genes, showing stronger binding of Smchd1 near mis-spliced exons (**P < 0.01, ****P < 0.0001). X axis represents bins of size 50 bp around the center of the exon. (C) Aggregation plot depicting the average normalized Smchd1 occupancy at exons differentially included or excluded in Smchd1 WT NSCs compared to Smchd1 null NSCs (*P < 0.05). X axis represents bins of size 50 bp around the center of the exon. (D) Genome browser view of the Mef2d alternatively spliced junctions presented by sashimi plots; arcs denote splice junctions quantified in spanning reads. Mutually exclusive alternatively included exon is highlighted in turquoise. Refseq transcripts are presented as a reference.
Fig. 3.
Fig. 3.. Smchd1 binding is associated with slow elongation rate of RNAPII.
(A and B) Aggregation plots depicting the average normalized phospho-Ser2 levels of RNAPII in C2C12 cells at and near mis-spliced exons differentially bound by Smchd1 (A) and at and near exons differentially included or excluded in Smchd1 WT NSCs (B). X axis represents bins of size 50 bp around the center of the exon (*FDR < 0.05; **FDR < 0.01).
Fig. 4.
Fig. 4.. SMCHD1 is a regulator of alternative splicing in patients with FSHD.
(A and B) Significant alternative splicing in muscles of patients with FSHD2 revealed by rMATS analysis of RNA-seq data from healthy individuals and patients with FSHD1 and with FSHD2 (32). (A) Volcano plot presenting all detected alternative splicing events between muscles of patients with FSHD2 and healthy individuals. Y axis represents statistical significance (FDR), and x axis represents PSI difference. Significant events (FDR < 0.05 and |ΔPSI| > 0.1) are colored purple (ΔPSI >0.1) or green (ΔPSI < −0.1). (B) Venn diagram presenting the overlap between differentially expressed and alternatively spliced genes in patients with FSHD2. (C) RNA was extracted from lymphoblasts of a female patient with FSHD2 and her healthy sister. Real-time PCR was conducted to measure the relevant splicing event and total mRNA amount. Results are shown as PSI fold change as estimated by the ratio of exon inclusion to total mRNA levels of the gene. Values represent averages of three biological replicates performed in three technical replicates (*P < 0.05; **P < 0.01; ****P < 0.0001). (D and E) Significant alternative splicing in muscles of patients with FSHD2 revealed by rMATS analysis of RNA-seq data from healthy individuals and patients with FSHD1 and FSHD2. (D) Venn diagram presenting the overlap of alternative splicing events when patients with FSHD2 are compared to those with FSHD1 or to healthy individuals. (E) Five most significantly enriched human phenotypes (HPO) with FSHD2 alternatively spliced genes; bars present adjusted P value of enrichment; number of alternatively spliced genes are annotated next to bar.
Fig. 5.
Fig. 5.. DNMT3B exons 5 and 21 are regulated by SMCHD1 and RNAPII stalling.
(A to D) HCT116 cells were transfected with siRNA targeting SMCHD1 and GFP as negative control for 72 hours. Total RNA was extracted and analyzed by real-time PCR for DNMT3B exon 5 (A) and exon 21 (B) inclusion relative to DNMT3B total mRNA amount. PSI fold change was estimated by the ratio of exon inclusion to total DNMT3B mRNA levels. Data represent mean ± SD of three independent experiments performed in triplicates. (C) Semiquantitative PCR was conducted for exons 4 and 5. (D) Semiquantitative PCR for exons 21 and 22 was followed by sequencing of the indicated bands. Sequencing results informed the schematic representation of the exons. (E and F) HCT116 cells were treated with 6 μM CPT or dimethyl sulfoxide (DMSO) as negative control, for 6 hours. Total RNA was extracted and analyzed by real-time PCR for DNMT3B exon 5 (E) and exon 21 (F) inclusion relative to DNMT3B total mRNA amount. PSI fold change was calculated by dividing exon inclusion in DNMT3B total mRNA amount. Values represent mean ± SD of three independent experiments performed in triplicates (*P < 0.05; **P < 0.01) (paired Student’s t test). (G) HCT116 cells were transfected with siRNA targeting SMCHD1 and GFP as negative control, followed by immunoprecipitation for RNAPII pSer2. Real-time PCR was conducted for DNMT3B introns 4 and 21 relative to input. Values represent averages of three technical replicates; error bars represent SD. (*P < 0.05) (Student’s t test).
Fig. 6.
Fig. 6.. DNMT3B exon 5 and 21 are regulated by RBM5.
(A) HCT116 cells were transfected with siRNA targeting 71 human splicing factors, SMCHD1 as a positive control and GFP as negative control for 72 hours. Total RNA was extracted and analyzed by real-time PCR for DNMT3B exon 5 and exon 21. Z scores were calculated for DNMT3B exon 5 and exon 21 PSI fold change, as DNMT3B exon inclusion/DNMT3B total mRNA. PSI fold change values were normalized to siGFP before z-score calculation to normalize variance between each experiment. (B) Scatter plot shows z scores of PSI fold change of exon 5 versus exon 21; the red triangle represents GFP (negative control); the green triangle represents SMCHD1 (positive control); gray circles represent a lowly expressed factor; crossed circles represent hits that are inconsistent between repeats; and blue circles represent splicing factor hits. Data represent two independent experiments performed in three technical replicates. (C and D) HCT116 cells were transfected with siRNA targeting each of the splicing factor hits and GFP as a negative control. Total RNA was extracted and analyzed by real-time PCR for DNMT3B exon 5 (C) and exon 21 (D) inclusion relative to DNMT3B total mRNA amount, normalized to negative control. Values represent averages of three independent experiments performed in triplicates; error bars represent SD. (*P < 0.05, **P < 0.01) (Student’s t test).
Fig. 7.
Fig. 7.. RBM5 binding to DNMT3B exon 5 and 21 is SMCHD1 dependent.
(A) RNA immunoprecipitation of RBM5 in HCT116 cells following silencing of SMCHD1 or CPT treatment. (B) HCT116 cells were transfected with siRNA targeting SMCHD1 and GFP as negative control for 72 hours. Bars show real-time PCR results for DNMT3B introns 4 and 21 relative to input. (C) HCT116 cells were treated with either vehicle (DMSO) or 6 μM CPT for 6 hours. Bars show real-time PCR results for DNMT3B introns 4 and 21 relative to input. Values represent averages of three experiments performed in triplicates; error bars represent SD. (*P < 0.05, **P < 0.01) (paired Student’s t test).
Fig. 8.
Fig. 8.. DNMT3B1 isoform reduces methylation at the D4Z4 region leading to increase of DUX4 expression.
(A) Human skeletal myoblasts were infected with lentiviruses containing empty GFP, GFP-DNMT3B3ΔEx5, or GFP-DNMT3B1. D4Z4 methylation was quantified by bisulfite PCR sequencing and DUX4 expression by semiquantitative PCR and real-time PCR. (B) Quantification of GFP expressing cells in infected myoblasts (****P < 0.0001). (C and D) DNA was isolated from human skeletal myoblasts infected with each of the isoforms and converted with bisulfite. PCR products of the D4Z4 region were sequenced, and methylation levels in each CpG were assessed using Biscuit. Boxplot (C) presents the methylation level in each isoform-specific cell line, and histogram (D) presents the difference between methylation levels measured at the D4Z4 region in DNMT3B1 and DNMT3B3ΔEx5 expressing cells. (E to G) RNA was extracted from human skeletal myoblast cells with the DNMT3B3ΔEx5 and DNMT3B1 isoforms. (E) Semiquantitative PCR was conducted for DUX4 mRNA level. (F) Real-time PCR was conducted for DUX4-fl mRNA level. DUX4-fl mRNA level was quantified relative to CycloA reference gene. Values represent averages of four technical replicates; error bars represent SD. (*P < 0.05) (Student’s t test). (G) Real-time PCR was conducted for DUX4 targets ZSCAN4, TRIM43, PRAMEF1, and DEFB103. Values represent averages of three technical replicates; error bars represent SD. (*P < 0.05, **P < 0.01, ***P < 0.001) (Student’s t test). (H) hESCs were infected with lentiviruses containing empty GFP, GFP-DNMT3B3ΔEx5, or GFP-DNMT3B1. RNA was extracted, and real-time PCR was conducted for DUX4 mRNA level. DUX4 mRNA level was quantified relative to CycloA reference gene. Values represent averages of three technical replicates.
Fig. 9.
Fig. 9.. Model for SMCHD1 pathophysiology in FSHD2 driven by its abnormal splicing.
In healthy cells, SMCHD1 binding is specifically enriched in the proximity of alternative exons, particularly excluded exons. A slower rate of RNAPII elongation is linked to SMCHD1 binding and related to exon exclusion. Excluded exons are characterized by a high density of RBM5 motifs, which inhibit exon inclusion and promote exon exclusion. However, in FSHD2 muscle cells, SMCHD1 mutations lead to abnormal exon inclusion. This mis-splicing of FSHD-related genes, including DNMT3B, results in decreased methylation of the D4Z4 region and increased expression of the DUX4 gene.

Similar articles

Cited by

References

    1. Griffin C., Saint-Jeannet J.-P., Spliceosomopathies: Diseases and mechanisms. Dev. Dyn. 249, 1038–1046 (2020). - PMC - PubMed
    1. Yoshida K., Ogawa S., Splicing factor mutations and cancer. Wiley Interdiscip. Rev. RNA 5, 445–459 (2014). - PubMed
    1. Naftelberg S., Schor I. E., Ast G., Kornblihtt A. R., Regulation of alternative splicing through coupling with transcription and chromatin structure. Annu. Rev. Biochem. 84, 165–198 (2015). - PubMed
    1. Dujardin G., Lafaille C., de la Mata M., Marasco L. E., Muñoz M. J., Jossic-Corcos C. L., Corcos L., Kornblihtt A. R., How slow RNA polymerase II elongation favors alternative exon skipping. Mol. Cell 54, 683–690 (2014). - PubMed
    1. Ruiz-Velasco M., Kumar M., Lai M. C., Bhat P., Solis-Pinson A. B., Reyes A., Kleinsorg S., Noh K.-M., Gibson T. J., Zaugg J. B., CTCF-mediated chromatin loops between promoter and gene body regulate alternative splicing across individuals. Cell Syst. 5, 628–637.e6 (2017). - PubMed

MeSH terms