. 2024 May 31;10(22):eado0077.
doi: 10.1126/sciadv.ado0077. Epub 2024 May 29.

Presynaptic nanoscale components of retrograde synaptic signaling

Affiliations

Presynaptic nanoscale components of retrograde synaptic signaling

Benjámin Barti et al. Sci Adv. .

Abstract

While our understanding of the nanoscale architecture of anterograde synaptic transmission is rapidly expanding, the qualitative and quantitative molecular principles underlying distinct mechanisms of retrograde synaptic communication remain elusive. We show that a particular form of tonic cannabinoid signaling is essential for setting target cell-dependent synaptic variability. It does not require the activity of the two major endocannabinoid-producing enzymes. Instead, by developing a workflow for physiological, anatomical, and molecular measurements at the same unitary synapse, we demonstrate that the nanoscale stoichiometric ratio of type 1 cannabinoid receptors (CB1Rs) to the release machinery is sufficient to predict synapse-specific release probability. Accordingly, selective decrease of extrasynaptic CB1Rs does not affect synaptic transmission, whereas in vivo exposure to the phytocannabinoid Δ9-tetrahydrocannabinol disrupts the intrasynaptic nanoscale stoichiometry and reduces synaptic variability. These findings imply that synapses leverage the nanoscale stoichiometry of presynaptic receptor coupling to the release machinery to establish synaptic strength in a target cell-dependent manner.


Figures

Fig. 1.
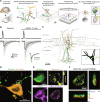
Fig. 1.. Target cellspecific variability of CB1BC efferent synapses.
(A) Schematic illustration of experimental design. Inset traces show characteristic regular firing pattern of the CB1BC in response to −200-, 0- and +300-pA current steps. Reconstruction of a CB1BC (green) that is synaptically coupled to three postsynaptic PCs (orange). (B) Example traces of patch-clamp recordings from the three sequential pairs. Presynaptic APs evoked in the same CB1BC (top traces) and the respective postsynaptic responses (bottom traces: 50 consecutive unitary IPSCs and their average effective unitary IPSC) that were recorded in subsequent PCs are shown. (C) Confocal three-dimensional (3D) maximum intensity projection images and reconstructions of CB1BC axons (green) and PCs (orange) reveal the number and location of perisomatic connections (b1 to b6) between pairs. (D) Confocal images of quadruple staining demonstrate the presence of CB1R expression in the biocytin-labeled bouton (arrowhead) and show the accumulation of bassoon protein. Bottom insets show enlarged images of the synaptic connection. (E to G) Summary graphs show large variability in peak IPSC amplitude (E), number of successful events (F) and coefficient of variation (CV) of IPSCs (G) in sequential paired recordings (n = 27 pairs). Green data points depict the representative experiment presented on (A) to (D). Violin plots of pooled data show median ± interquartile range (IQR). Data presented as means ± SD. (H and I) The number of synaptic connections between pairs does not correlate with IPSC amplitude (H) or successes (I) (n = 22 pairs, IPSC amplitude: Pns = 0.99, r = 0.002, successes: Pns = 0.91, r = −0.02, Spearman’s rank-order correlation).
Fig. 2.
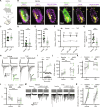
Fig. 2.. Intact cannabinoid tone in absence of the major endocannabinoid-producing enzymes.
(A) Representative traces of CB1BC-PC paired recording obtained from CB1R WT and KO mice during baseline and after AM251 application. Inset shows average IPSCs for easier comparison. (B) Summary plots of IPSC amplitudes during whole experiment. (C) Graph of IPSC amplitudes before and after AM251 application in CB1R WT (n = 11 pairs, **P = 0.006) and KO samples (n = 12 pairs, Pns = 0.86). (D) Graph of successes in CB1R WT (***P = 0.0003) and KO (Pns = 0.25). (E) Graph of relative variability of postsynaptic events measured by the CV of IPSCs in CB1R WT (**P = 0.001) and KO samples (Pns = 0.53). Baseline CV differs between genotypes (*P = 0.03). (F) Same as in (A), but in NAPE-PLD WT and KO samples. (G) AM251 increases IPSC amplitudes in both NAPE-PLD WT and KO. (H) Graph of IPSC amplitudes in NAPE-PLD WT (n = 7 pairs, *P = 0.02) and KO (n = 7 pairs, *P = 0.04). (I) Graph of successes in NAPE-PLD WT (**P = 0.009) and KO (**P = 0.003). (J) Graph of CV values in NAPE-PLD WT (*P = 0.02), and KO (*P = 0.03). (K) Same as in (A) but in DAGLα WT and KO samples. (L) AM251 increases IPSC amplitudes both in DAGLα WT and KO. (M) Graph of IPSC amplitudes in DAGLα WT (n = 17 pairs, **P = 0.003) and KO (n = 12 pairs, *P = 0.03). (N) Graph of successes in DAGLα WT (*P = 0.003) and KO (*P = 0.004). (O) Graph of CV values in DAGLα WT (**P = 0.02) and KO (**P = 0.05). Two-way analysis of variance (ANOVA) with repeated measures is shown; graphs show means ± SEM with individual values.
Fig. 3.
Fig. 3.. Correlated electrophysiological, anatomical, and nanoscale molecular analysis of unitary CB1BC-PC synapses.
(A) Schematic workflow of the experimental procedure. (B) Example traces of paired recording reveals baseline properties of synaptic transmission and tonic cannabinoid signaling. (C) Morphological reconstruction of the recorded CB1BC (biocytin, green) and PC (CascB, orange). (D) Confocal microscopical image of single identified synaptic connection between recorded cells (arrowhead). (E) Boxed region in (D) is shown at higher magnification after immunostaining. Correlated confocal and STORM super-resolution imaging of the biocytin-filled axon terminal (green) was used to identify the presynaptic active zone (arrows) by bassoon-immunolabeling (yellow) and was exploited to quantify the nanoscale distribution of CB1Rs (magenta). Arrows on zy view of bassoon channel indicate slice plane as well. (F) 3D z-stack STORM of the identified CB1R-positive axon terminal.
Fig. 4.
Fig. 4.. Nanoscale receptor/effector stoichiometry determines the synaptic cannabinoid tone.
(A) 3D z-stack STORM data were used to calculate the nanoscale distance of each CB1R from the bassoon-positive voxels and from the surface of the axon terminal. (B) The total number of CB1Rs on the axon terminal does not predict the estimated Pr (n = 9 pairs, Pns = 0.90, r = 0.05). (C) The number of bassoon voxels does not covary with the estimated Pr (Pns = 0.90, r = 0.05). (D) Correlation coefficients of the CB1R/bassoon stoichiometry calculated at various distances from bassoon labeling. The receptor/effector stoichiometry scales with the estimated Pr in a nanoscale distance-dependent manner. (E) Correlation plot shows an inverse correlation between the estimated Pr and the nanoscale CB1R/bassoon ratio measured within 200-nm distance from the active zone (*P = 0.03, r = −0.74). (F) Application of AM251 impairs the inverse correlation between the estimated Pr and the nanoscale CB1R/bassoon ratio at the same recorded pairs as shown at baseline on (E) (Pns = 0.90, r = −0.05). (G) Correlation plot shows positive correlation with the nanoscale CB1R/bassoon ratio and the strength of the synaptic cannabinoid tone (*P = 0.02, r = 0.77). (H) Plot shows negative correlation between the strength of the synaptic cannabinoid tone and the estimated Pr (*P = 0.01, r = −0.8, Spearman rank-order correlation).
Fig. 5.
Fig. 5.. Nanoscale concentration of CB1Rs with reduced mobility.
(A) Schematic representation of experimental design. (B) Violin plots and medians of translocations obtained from boutons and axonal segments (n = 8 boutons and 10 axons, ***P < 0.001, Mann-Whitney U test). (C) Visualization of single-particle tracking of labeled CB1Rs was conducted in the boutonal profiles (cyan box) and interboutonal segments (gray box) of the axonal process. CB1Rs were categorized by their movement as either short translocation distances (0 to 100 nm) in magenta or as long translocations (100 to 750 nm) in green. (D) Multidistance spatial cluster analysis by using Ripley’s K(r) plot of short and long CB1R translocations revealed clustered nanoscale distribution pattern of short trajectory CB1Rs but not the long trajectory CB1Rs in the boutons [cyan box on (A) and (C)]. Neither the short translocations nor the long translocations of individual CB1Rs differed from the expected K value in axons [gray box on (A) and (C)]. (E) Summary graphs show the quotient of Ripley’s K-function within a radius of 300 and 100 nm in boutons and in axons (n = 8 boutons and 10 axons, Pns = 0.27, unpaired t test). The quotient of Kshort/Klong for a radius of 100 nm is higher in boutons than in axons (n = 8 boutons and 10 axons, *P = 0.04, unpaired t test). Graphs show means ± SEM with individual values.
Fig. 6.
Fig. 6.. Selective reduction of extrasynaptic CB1R abundance does not affect the cannabinoid tone.
(A) Western blot of WT, CB1R heterozygotes (HET), and CB1R KO hippocampal lysates (n = 3 animals per genotype, *P = 0.046 between WT and HET, **P = 0.04 between WT and KO, one-way ANOVA with Dunnett’s multiple comparisons test). (B) Confocal images show immunolabeling for CB1R (magenta) and the active zone (arrowhead) labeled via bassoon protein (yellow), whereas the corresponding STORM super-resolution images display the nanoscale distribution of CB1Rs in axon terminals. (C) Summary graph of the perimeter of axon terminals in WT and HET samples (WT: n = 57 boutons, HET: n = 71 boutons, Pns = 0.18). (D) Summary graph of the number of bassoon-positive voxels shows identical active zone size in the axon terminals of WT and HET mice (Pns = 0.94). (E) Summary graph of the total number of CB1R localization points (NLP) on axon terminals measured with STORM (***P < 0.0001). (F) Summary graph of distance-dependent decrease of CB1Rs on the surface of boutons in HET mice (0 to 200 nm: Pns = 0.08, 200 to 400, 400 to 600 nm: ***P < 0.0001). (G) Summary graph of nanoscale CB1R/bassoon ratio in the vicinity (200 nm) of the active zone (Pns = 0.17). (H) Representative traces from paired recordings obtained from HET mice before and after the application of AM251. (I) Summary plots of whole experiments show increase of IPSC amplitudes in HET samples after AM251 application. (J) Summary graph of IPSC amplitudes before and after application of AM251 in HET (n = 9 pairs, *P = 0.04). (K) Summary graph of successful postsynaptic events in HET (*P = 0.02). (L) Summary graph of CV values in HET (*P = 0.02). Graphs show means ± SEM with individual values. [(C) to (G)] Mann-Whitney U test; [(J) to (L)] Wilcoxon signed-rank test.
Fig. 7.
Fig. 7.. THC disrupts the intrasynaptic nanoscale stoichiometry and the cannabinoid tone.
(A) Schematic illustration of experimental design. (B) Confocal and combined STORM images of CB1R labeling (magenta) on biocytin-labeled (green) boutons from either vehicle or THC-treated animals. Arrowhead marks bassoon-labeled synaptic active zone (yellow). (C) Summary graph of axon terminal perimeter in vehicle and THC-treated samples (vehicle: n = 16 boutons, THC: n = 35 boutons, Pns = 0.14). (D) Summary graph of bassoon-positive voxel numbers (vehicle: n = 14 boutons, THC: n = 32 boutons, Pns = 0.84). (E) Summary graph of CB1R STORM localization point numbers (NLP) (***P < 0.0001). (F) Summary graph of distance-independent decrease of CB1Rs on the bouton surface in THC-treated mice. (0 to 200 nm: **P = 0.002, 200 to 400, 400 to 600 nm: ***P < 0.0001) (G) Summary graph of CB1R/bassoon ratio in vehicle and THC-treated boutons (***P = 0.0001). (H) Example traces of paired recordings before and after AM251 application from slices of in vivo vehicle or THC-treated mice. (I) Summary plots of IPSC amplitudes during whole experiment. (J) Summary graph of IPSC amplitudes during baseline and after application of AM251 in vehicle- or THC-treated groups (n = 11 pairs per group, ***P = 0.0004, Pns = 0.18, baseline difference: **P = 0.002). (K) Summary graph of successes (***P < 0.0001, Pns = 0.74, baseline difference: **P = 0.002). (L) Summary graph of IPSC CV values (***P < 0.0001, Pns = 0.96, baseline difference: ***P < 0.0001). (M) Representative IPSC responses on DSI before and after AM251 application on vehicle- or THC-treated slices. (N) Summary graph of DSI effect on IPSC amplitudes (***P < 0.0001, baseline difference: **P = 0.004). Graphs show means ± SEM with individual values. [(C) to (G)] Mann-Whitney U test; [(J) to (N)] two-way ANOVA with repeated measures.

References

    1. Biederer T., Kaeser P. S., Blanpied T. A., Transcellular Nanoalignment of Synaptic Function. Neuron 96, 680–696 (2017). - PMC - PubMed
    1. Choquet D., Sainlos M., Sibarita J.-B., Advanced imaging and labelling methods to decipher brain cell organization and function. Nat. Rev. Neurosci. 22, 237–255 (2021). - PubMed
    1. Tang A.-H., Chen H., Li T. P., Metzbower S. R., MacGillavry H. D., Blanpied T. A., A trans-synaptic nanocolumn aligns neurotransmitter release to receptors. Nature 536, 210–214 (2016). - PMC - PubMed
    1. Crosby K. C., Gookin S. E., Garcia J. D., Hahm K. M., Dell’Acqua M. L., Smith K. R., Nanoscale subsynaptic domains underlie the organization of the inhibitory synapse. Cell Rep. 26, 3284–3297.e3 (2019). - PMC - PubMed
    1. Hruska M., Henderson N., Le Marchand S. J., Jafri H., Dalva M. B., Synaptic nanomodules underlie the organization and plasticity of spine synapses. Nat. Neurosci. 21, 671–682 (2018). - PMC - PubMed