. 2024 May 31;10(22):eadn2050.
doi: 10.1126/sciadv.adn2050. Epub 2024 May 29.

CLUH maintains functional mitochondria and translation in motoneuronal axons and prevents peripheral neuropathy

Affiliations

CLUH maintains functional mitochondria and translation in motoneuronal axons and prevents peripheral neuropathy

Marta Zaninello et al. Sci Adv. .

Abstract

Transporting and translating mRNAs in axons is crucial for neuronal viability. Local synthesis of nuclear-encoded mitochondrial proteins protects long-lived axonal mitochondria from damage; however, the regulatory factors involved are largely unknown. We show that CLUH, which binds mRNAs encoding mitochondrial proteins, prevents peripheral neuropathy and motor deficits in the mouse. CLUH is enriched in the growth cone of developing spinal motoneurons and is required for their growth. The lack of CLUH affects the abundance of target mRNAs and the corresponding mitochondrial proteins more prominently in axons, leading to ATP deficits in the growth cone. CLUH interacts with ribosomal subunits, translation initiation, and ribosome recycling components and preserves axonal translation. Overexpression of the ribosome recycling factor ABCE1 rescues the mRNA and translation defects, as well as the growth cone size, in CLUH-deficient motoneurons. Thus, we demonstrate a role for CLUH in mitochondrial quality control and translational regulation in axons, which is essential for their development and long-term integrity and function.


Figures
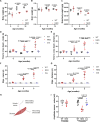
Fig. 1.
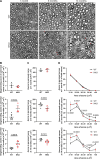
Fig. 1.. NKO mice show progressive locomotor defects.
(A to C) Body weight (A), brain weight (B), and brain/body weight ratio (C) of WT and NKO mice at 5, 8, and 14 months of age. Data represent means ± SD of 5 to 10 mice. Statistical significance was determined by Mann-Whitney and Welch’s t tests. (D to G) Quantification of the walking beam test in males [(D) and (F)] and females [(E) and (G)] aged 4, 5, and 8 months as time spent to cross the beam [(D) and (E)] and number of total slips during the crossing [(F) and (G)]. Data represent means ± SD of 6 to 13 mice. Statistical significance was determined by Mann-Whitney and Welch’s t tests. (H) Scheme depicting compound muscle action potential (CMAP) recording. Sciatic nerve was stimulated with two electrodes, and the action potential was measured with two recording electrodes in the muscle of the hind paw. Figure created with Biorender.com. (I) Quantification of the CMAP amplitude recorded in the hind paw after stimulation of the sciatic nerve of male mice aged 3 and 8 months. Data represent means ± SD of 6 to 10 mice. Statistical significance was determined by Welch’s t test and one-way analysis of variance (ANOVA) followed by Dunn’s multiple comparisons test.
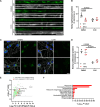
Fig. 2.
Fig. 2.. NKO mice show peripheral neuropathy.
(A) Semithin sections of the peroneal branch of the sciatic nerve of 1-, 5-, and 14-month-old mice. Arrowheads indicate degenerating axons. Scale bar, 10 μm. (B to D) Quantification of degenerating axons (B), of the number of axons larger than 5 μm2 per area (C), and of the distribution of axons of different size (D) in semithin sections of the peroneal branch of the sciatic nerve at indicated ages and genotypes. Data represent means ± SD of five to eight mice. Statistical significance was determined by Welch’s t test in (B) and (C) and by two-way ANOVA followed by Sidak’s multiple comparisons test in (D).
Fig. 3.
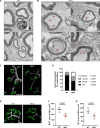
Fig. 3.. NKO mice have ultrastructurally abnormal axons and denervated NMJs.
(A and B) Electron micrographs of peroneal nerves of WT (A) and NKO (B) mice aged 14 months. Arrows indicate abnormal swollen mitochondria, asterisks show accumulation of collagen, and arrowheads point to denervated Schwann cells. Scale bars, 2 μm. (C) NMJs of tibialis anterior muscles in WT and NKO mice aged 14 months. NF, neurofilament; BTX, α-bungarotoxin. Scale bar, 50 μm. (D) Quantification of the morphology of NMJs in experiments as in (C). Data represent the means ± SD of four mice (70 to 107 NMJs per mouse). Statistical significance was determined by Welch’s t test. P values respect to type of innervation are indicated. (E) Enlarged images of NMJs of tibialis anterior muscles in WT and NKO mice aged 14 months. Scale bar, 10 μm. (F and G) Quantification of the BTX+ area of post synapses (F) and NF+ area of pre-synapses (G) in experiments as in (C). Data represent the means ± SD of four mice (53 to 91 NMJs per mouse). Statistical significance was determined by Welch’s t test.
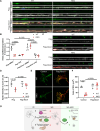
Fig. 4.
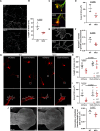
Fig. 4.. Lack of CLUH impairs axonal growth.
(A) Motoneuronal axons stained by TAU in the axonal compartment of Boyden chambers at DIV 6. Scale bar, 75 μm. (B) Quantification of the length of axons in experiments as in (A). Data represent the means ± SD of five mice (four to five fields per mouse). Statistical significance was determined by Welch’s t test. (C) GCs of primary spinal motoneurons stained for TAU (green) and actin (Phalloidin, red). Scale bar, 10 μm. (D) Quantification of the area of GCs in experiments as in (C). Data represent the means ± SD of four mice (47 to 78 GCs per mouse). Statistical significance was determined by Mann-Whitney test. (E) Staining of synapsin+ (SYN) vesicles in GCs of primary spinal motoneurons. GCs are outlined in white. Scale bar, 10 μm. (F) Quantification of the number of SYN+ vesicles in GCs in experiments as in (E). Data represent the means ± SD of four to five mice (26 to 35 GCs per mouse). Statistical significance was determined by Welch’s t test. (G) WT and NKO primary motoneurons expressing mCherry or Cluh-mCherry. GCs are magnified in the bottom panels. Scale bars, 20 and 5 μm. (H and I) Quantification of the length of axons (H) and size of GCs (I) in experiments as in (G). Data represent the means ± SD of six to seven mice (6 to 14 axons or GCs per mouse). Statistical significance was determined by one-way ANOVA followed by Dunn’s and Dunnett’s multiple comparisons tests. (J) Whole mounts of hindlimbs of E13.5 WT and NKO embryos stained with neurofilament M (NF-M). Scale bar, 200 μm. (K) Quantification of the innervation of the hindlimbs in respect to the area of the paw as in (J). Embryos belonged to the same litter. Data represent the means ± SD of three to five mice. Statistical significance was determined by Welch’s t test.
Fig. 5.
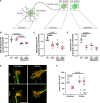
Fig. 5.. Lack of CLUH leads to ATP defects in GCs.
(A) Depiction of the experimental strategy using the ATP sensor mito-ATeam targeted to mitochondria or the cytosol. Figure created with Biorender.com. (B and C) Quantification of mitochondrial ATP in somas (B) and GCs (C) of primary motoneurons transfected with mito-ATeam. The analyzed somas are from the same field of GCs. Data represent the means ± SD of GCs and somas from five to eight mice. Statistical significance was determined by one-way ANOVA followed by Dunnett’s multiple comparisons test. YFP, yellow fluorescent protein; CFP, cyan fluorescent protein. (D) Quantification of cytosolic ATP in GCs of primary motoneurons transfected with the cytosolic ATeam sensor in galactose medium. Data represent the means ± SD of GCs from five mice. Statistical significance was determined by one-way ANOVA followed by Dunnett’s multiple comparisons test. (E) GCs stained with Tyr-TUB (green) and Actin (Phalloidin, red) of motoneurons grown in medium with or without uridine supplementation. Scale bar, 10 μm. (F) Quantification of the size of GCs in experiments as in (E). Data represent the means ± SD of five to seven independent cultures (27 to 66 GCs per culture). Statistical significance was determined by one-way ANOVA followed by Dunn’s multiple comparisons test.
Fig. 6.
Fig. 6.. Lack of CLUH depletes axons and somas of CLUH target mRNAs.
(A) RNAscope of Atp5a1, Pink1, and ActB mRNAs (red) in axons of primary spinal motoneurons (DIV 6) stained for TAU (gray). Scale bar, 5 μm. (B) Quantification of the abundance of Atp5a1, Pink1, and ActB mRNAs in axons in experiments as in (A). Data represent the means ± SD of four to six mice (26 to 57 neurons per mouse). Statistical significance was determined by Welch’s t test. (C) RNAscope of Atp5a1, Pink1, and ActB mRNAs (red) in somas of primary spinal motoneurons (DIV 6) stained for TAU (gray). Scale bar, 5 μm. (D) Quantification of the abundance of Atp5a1, Pink1, and ActB mRNAs in somas in experiments as in (C). Data represent the means ± SD of four to six mice (26 to 57 neurons per mouse). Statistical significance was determined by Mann-Whitney and Welch’s t test. (E to G) Distribution of Atp5a1 (E), Pink1 (F), and ActB (G) mRNAs particles along axons of primary motoneurons in experiments as shown in (A). Data represent the means ± SD of three to five cultures (72 to 653 mRNA dots per culture).
Fig. 7.
Fig. 7.. Mitochondrial proteins and translation components are depleted in NKO axons.
(A) Experimental setup to isolate axons of spinal motoneurons using Boyden chambers. A gradient of growth factors was applied from the lower axonal compartment to the upper compartment containing soma, dendrites, and axons. Axons were scraped and lysed in a 4% SDS solution; immediately afterward, the upper compartment was lysed in the same solution. Samples were then digested in SP3 trypsin buffer and subsequently analyzed using DIA LC-MS/MS FAIMS at compensation voltage (CV) of −50. Figure created with Biorender.com. (B) Volcano plot of protein changes in NKO versus WT axons. Mitochondrial proteins are highlighted in blue. (C and D) GOBP analysis of down-regulated proteins in the neuron (C) and axon (D) compartments of primary motoneurons grown in Boyden chambers. Analysis was done using the EnrichR webtool. NADH, reduced form of nicotinamide adenine dinucleotide (oxidized form); CoA, coenzyme A. (E) Correlation of the fold change of proteins encoded by CLUH mRNA targets in NKO versus WT axon and neuron compartments. Only proteins measured in axons are indicated. (F) Volcano plot of proteins altered in NKO versus WT axons. Proteins related to translation or RNA binding are highlighted in red. (G) Correlation of the fold changes of proteins highlighted in (F) in NKO versus WT in axon and neuron compartments.
Fig. 8.
Fig. 8.. CLUH absence impairs translation in axons but not in somas.
(A and B) Single confocal planes (A) and quantification (B) of newly synthesized proteins (HPG, green) revealed by the FUNCAT assay in WT and NKO axons stained with Tyr-TUB (gray). Data represent the means ± SD of four to five mice (27 to 71 axons per culture). Statistical significance was determined by one-way ANOVA followed by Dunnett’s multiple comparisons test. CHX, cycloheximide; HPG, l-homopropargylglycine; Tyr-TUB, tyrosinated tubulin. Scale bar, 5 μm. (C and D) Primary motoneurons (C) and quantification (D) of newly synthesized proteins (HPG, green) in WT and NKO somas stained with Tyr-TUB (gray). Data represent the means ± SD of three to four mice (49 to 100 somas per culture). Statistical significance was determined by one-way ANOVA followed by Dunnett’s multiple comparisons test. Scale bar, 20 μm. (E) Volcano plot of the interactome of CLUH in HeLa cells. Green dots denote proteins involved in translation and RNA binding; red dots denote interactors of CLUH decreased in NKO axons. (F) Kyoto Encyclopedia of Genes and Genomes pathway analysis of the interactome of CLUH in HeLa cells. Analysis was done using the EnrichR webtool.
Fig. 9.
Fig. 9.. ABCE1 restores translation, Atp5a1 mRNA, and GCs size in NKO axons.
(A and B) Single confocal planes (A) and quantification (B) of newly synthesized proteins (HPG, green) revealed by the FUNCAT assay in WT and NKO axons transfected with Flag or Flag-Abce1 (red) and stained with TAU (gray). The MERGE panels show HPG, Flag or Flag-Abce1, TAU, and DAPI (blue). Data represent the means ± SD of four to five mice (10 to 22 axons per culture). Statistical significance was determined by one-way ANOVA followed by Dunnett’s multiple comparisons test. Scale bar, 5 μm. (C) RNAscope of Atp5a1 (green) in axons of primary spinal motoneurons (DIV 6) transfected with Flag or Flag-Abce1 (red) and stained for TAU (gray). Scale bar, 5 μm. (D) Quantification of the abundance of Atp5a1 mRNA in axons in experiments as in (C). Data represent the means ± SD of four to five mice (18 to 39 neurons per mouse). Statistical significance was determined by one-way ANOVA followed by Dunnett’s multiple comparisons test. (E and F) Single confocal planes (E) and quantification (F) of the GCs area of GCs of control and Flag-Abce1 (red) transfected motoneurons stained for Actin (Phalloidin, green). Data represent the means ± SD of three to seven cultures (17 to 34 GCs per culture). Statistical significance was determined by one-way ANOVA followed by Dunnett’s multiple comparisons test. Scale bar, 10 μm. (G) Scheme depicting phenotypes observed in axons of spinal motoneurons lacking CLUH. Lack of CLUH is associated to reduced levels of mRNA targets, impairment of axonal translation, and mitochondrial dysfunction characterized by decreased ATP production and proteome abnormalities. The overexpression of ABCE1 in NKO neurons restores the levels of Atp5a1 mRNA, axonal translation, and the size of GCs. Figure created with Biorender.com.

References

    1. Misgeld T., Schwarz T. L., Mitostasis in neurons: Maintaining mitochondria in an extended cellular architecture. Neuron 96, 651–666 (2017). - PMC - PubMed
    1. Harbauer A. B., Mitochondrial health maintenance in axons. Biochem. Soc. Trans. 45, 1045–1052 (2017). - PubMed
    1. Hees J. T., Harbauer A. B., Metabolic regulation of mitochondrial protein biogenesis from a neuronal perspective. Biomolecules 12, 1595 (2022). - PMC - PubMed
    1. Vargas J. N. S., Sleigh J. N., Schiavo G., Coupling axonal mRNA transport and local translation to organelle maintenance and function. Curr. Opin. Cell Biol. 74, 97–103 (2022). - PMC - PubMed
    1. Harbauer A. B., Hees J. T., Wanderoy S., Segura I., Gibbs W., Cheng Y., Ordonez M., Cai Z., Cartoni R., Ashrafi G., Wang C., Perocchi F., He Z., Schwarz T. L., Neuronal mitochondria transport Pink1 mRNA via synaptojanin 2 to support local mitophagy. Neuron 110, 1516–1531.e9 (2022). - PMC - PubMed

MeSH terms