. 2024 Jul 23;8(14):3686-3690.
doi: 10.1182/bloodadvances.2024013094.

Neonatal NET-inhibitory factor inhibits macrophage extracellular trap formation

Affiliations

Neonatal NET-inhibitory factor inhibits macrophage extracellular trap formation

Joseph S Bircher et al. Blood Adv. .
No abstract available


Conflict of interest statement

Conflict-of-interest disclosure: C.C.Y. is the author of a US patent (patent number 10,232,023 B2) held by The University of Utah for the use of neutrophil extracellular trap-inhibitory peptides for the “treatment of and prophylaxis against inflammatory disorders,” for which Peel Therapeutics, Inc holds the exclusive license. The remaining authors declare no competing financial interests.

Figures

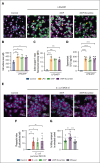
Figure 1.
Figure 1.
Neonatal nNIF inhibits MET formation in J774 cells and human MDMs. J774 cells and MDMs were preincubated with medium alone, nNIF (1 nM), or nNIF-scramble (1 nM) for 1 hour. J774 cells were then stimulated with LPS (100 ng/mL, 4 hours) and MDMs stimulated with E coli (MOI 5, 4 hours). (A-B) Representative live cell images obtained at 60× original magnification with confocal microscopy of MET formation (METs, magenta; nuclear DNA, green) in J774 cells (A) and MDMs (B). (C-D) Fluorometric quantification of MET-associated extracellular DNA in J774 cells after LPS (C) and E coli stimulus (D). (E) Fluorometric quantification of MET-associated extracellular DNA in MDMs after E coli stimulus. Fluorescence intensity shown on the y-axis (mean ± standard error of the mean [SEM]), with each treatment group shown on the x-axis. (F-G) Supernatant CitH3 concentration in J774 cells (F) and MDMs (G) after E coli stimulus. CitH3 concentration shown on the y-axis (mean ± SEM), with each treatment group shown on the x-axis. ∗P < .05; ∗∗P < .01; ∗∗∗P < .001; ∗∗∗∗P < .0001. RFU, relaive fluorescence units.
Figure 2.
Figure 2.
nNIF does not inhibit macrophage pyroptosis or phagocytosis but does reduce extracellular bacterial killing. (A-D) J774 cells were preincubated with medium alone, nNIF (1 nM), or nNIF-scramble (1 nM) for 1 hour before LPS priming. (A) Representative live cell images of J774 cells after LPS (100 ng/mL, 4 hours) and ATP (3 mM, 30 minutes) stimulation obtained at 60× original magnification with confocal microscopy (cell membrane, magenta; cell nucleus, cyan; activated caspase-1, green). Yellow arrows point to cells undergoing pyroptosis. (B) Cell surface area of J774 cells was measured using Image J. Five images obtained at 60× original magnification were used to determine the mean for each group. Cell surface area is shown on the y-axis (mean ± SEM), with each treatment group shown on the x-axis. (C) Active caspase-1 fluorescence intensity of J774 cells measured using Image J. Five images obtained at 60× original magnification were used to determine the mean for each group. Fluorescence intensity is shown on the y-axis (mean ± SEM), with each treatment group shown on the x-axis. (D) Supernatant IL-1β concentration in J774 cells after LPS/ATP stimulation. Supernatant IL-1β concentration is shown on the y-axis (mean ± SEM), with each treatment group shown on the x-axis. (E-F) J774 cells were preincubated with medium alone, nNIF (1 nM), or nNIF-scramble (1 nM) for 1-hour before incubation with E coli bioparticles. (E) Representative live cell images of J774 cells after incubation with E coli bioparticles (MOI 5, 4 hours) obtained at 60× original magnification with confocal microscopy (cell membrane, purple; cell nucleus, cyan; E coli bioparticles, green). (F) Phagocytic index (PI) of J774 cells and E coli bioparticles calculated using confocal images. PI = ([percent of cells containing ≥1 particle] × [mean number of particles/cells containing particles]). PI is shown on the y-axis (mean ± SEM), with each treatment group shown on the x-axis. (G) J774 cells were preincubated in medium alone, nNIF (1 nM), or nNIF-scramble (1 nM) for 1 hour before incubation with E coli. Total bacterial cell killing in J774 cells after incubation with a pathogenic strain of E coli (MOI 2, 3 hours). One group of J774 cells was preincubated with DNase I (40 U/mL, 10 minutes) to inhibit MET-mediated bacterial killing. Percent bacterial killing compared to an untreated control group is shown on the y-axis (mean ± SEM), with each treatment group shown on the x-axis. The blue dashed line represents bacterial killing in untreated cells. ∗P < .05; ∗∗P < .01; ∗∗∗P < .001; ∗∗∗∗P < .0001. MFI, mean fluorescence intensity.

Similar articles

References

    1. Brinkmann V, Reichard U, Goosmann C, et al. Neutrophil extracellular traps kill bacteria. Science. 2004;303(5663):1532–1535. - PubMed
    1. Middleton EA, He XY, Denorme F, et al. Neutrophil extracellular traps contribute to immunothrombosis in COVID-19 acute respiratory distress syndrome. Blood. 2020;136(10):1169–1179. - PMC - PubMed
    1. Lee KH, Kronbichler A, Park DD, et al. Neutrophil extracellular traps (NETs) in autoimmune diseases: a comprehensive review. Autoimmun Rev. 2017;16(11):1160–1173. - PubMed
    1. Jung HS, Gu J, Kim JE, Nam Y, Song JW, Kim HK. Cancer cell-induced neutrophil extracellular traps promote both hypercoagulability and cancer progression. PLoS One. 2019;14(4) - PMC - PubMed
    1. Camicia G, Pozner R, de Larranaga G. Neutrophil extracellular traps in sepsis. Shock. 2014;42(4):286–294. - PubMed

Publication types