. 2024 Jul 1;132(1):290-307.
doi: 10.1152/jn.00330.2023. Epub 2024 May 29.

Wireless monitoring of respiration with EEG reveals relationships between respiration, behavior, and brain activity in freely moving mice

Affiliations

Wireless monitoring of respiration with EEG reveals relationships between respiration, behavior, and brain activity in freely moving mice

Debanjan Dasgupta et al. J Neurophysiol. .

Abstract

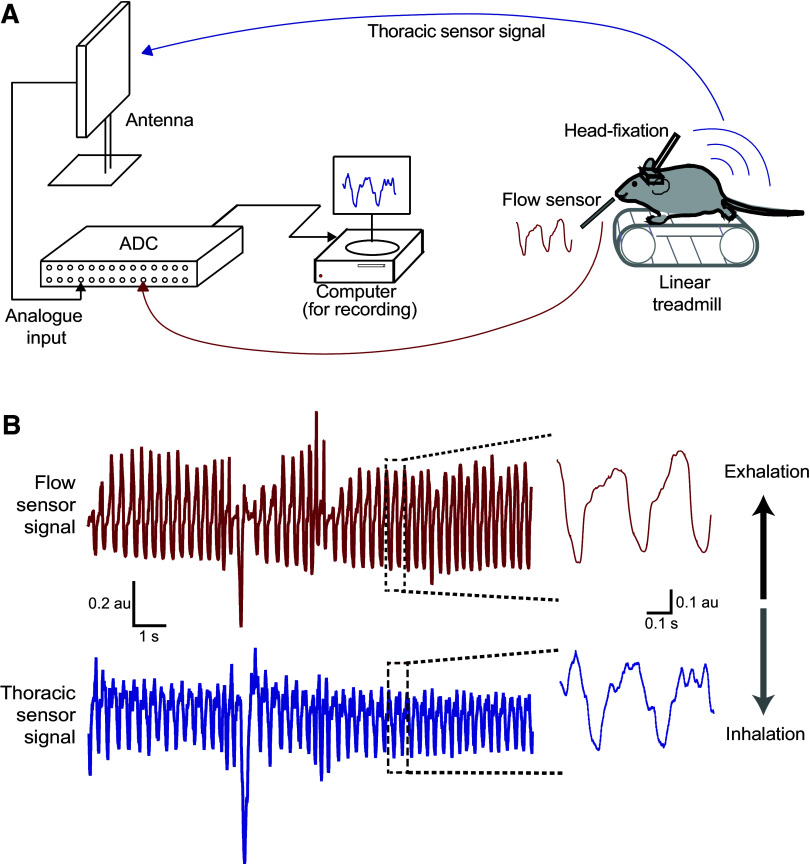
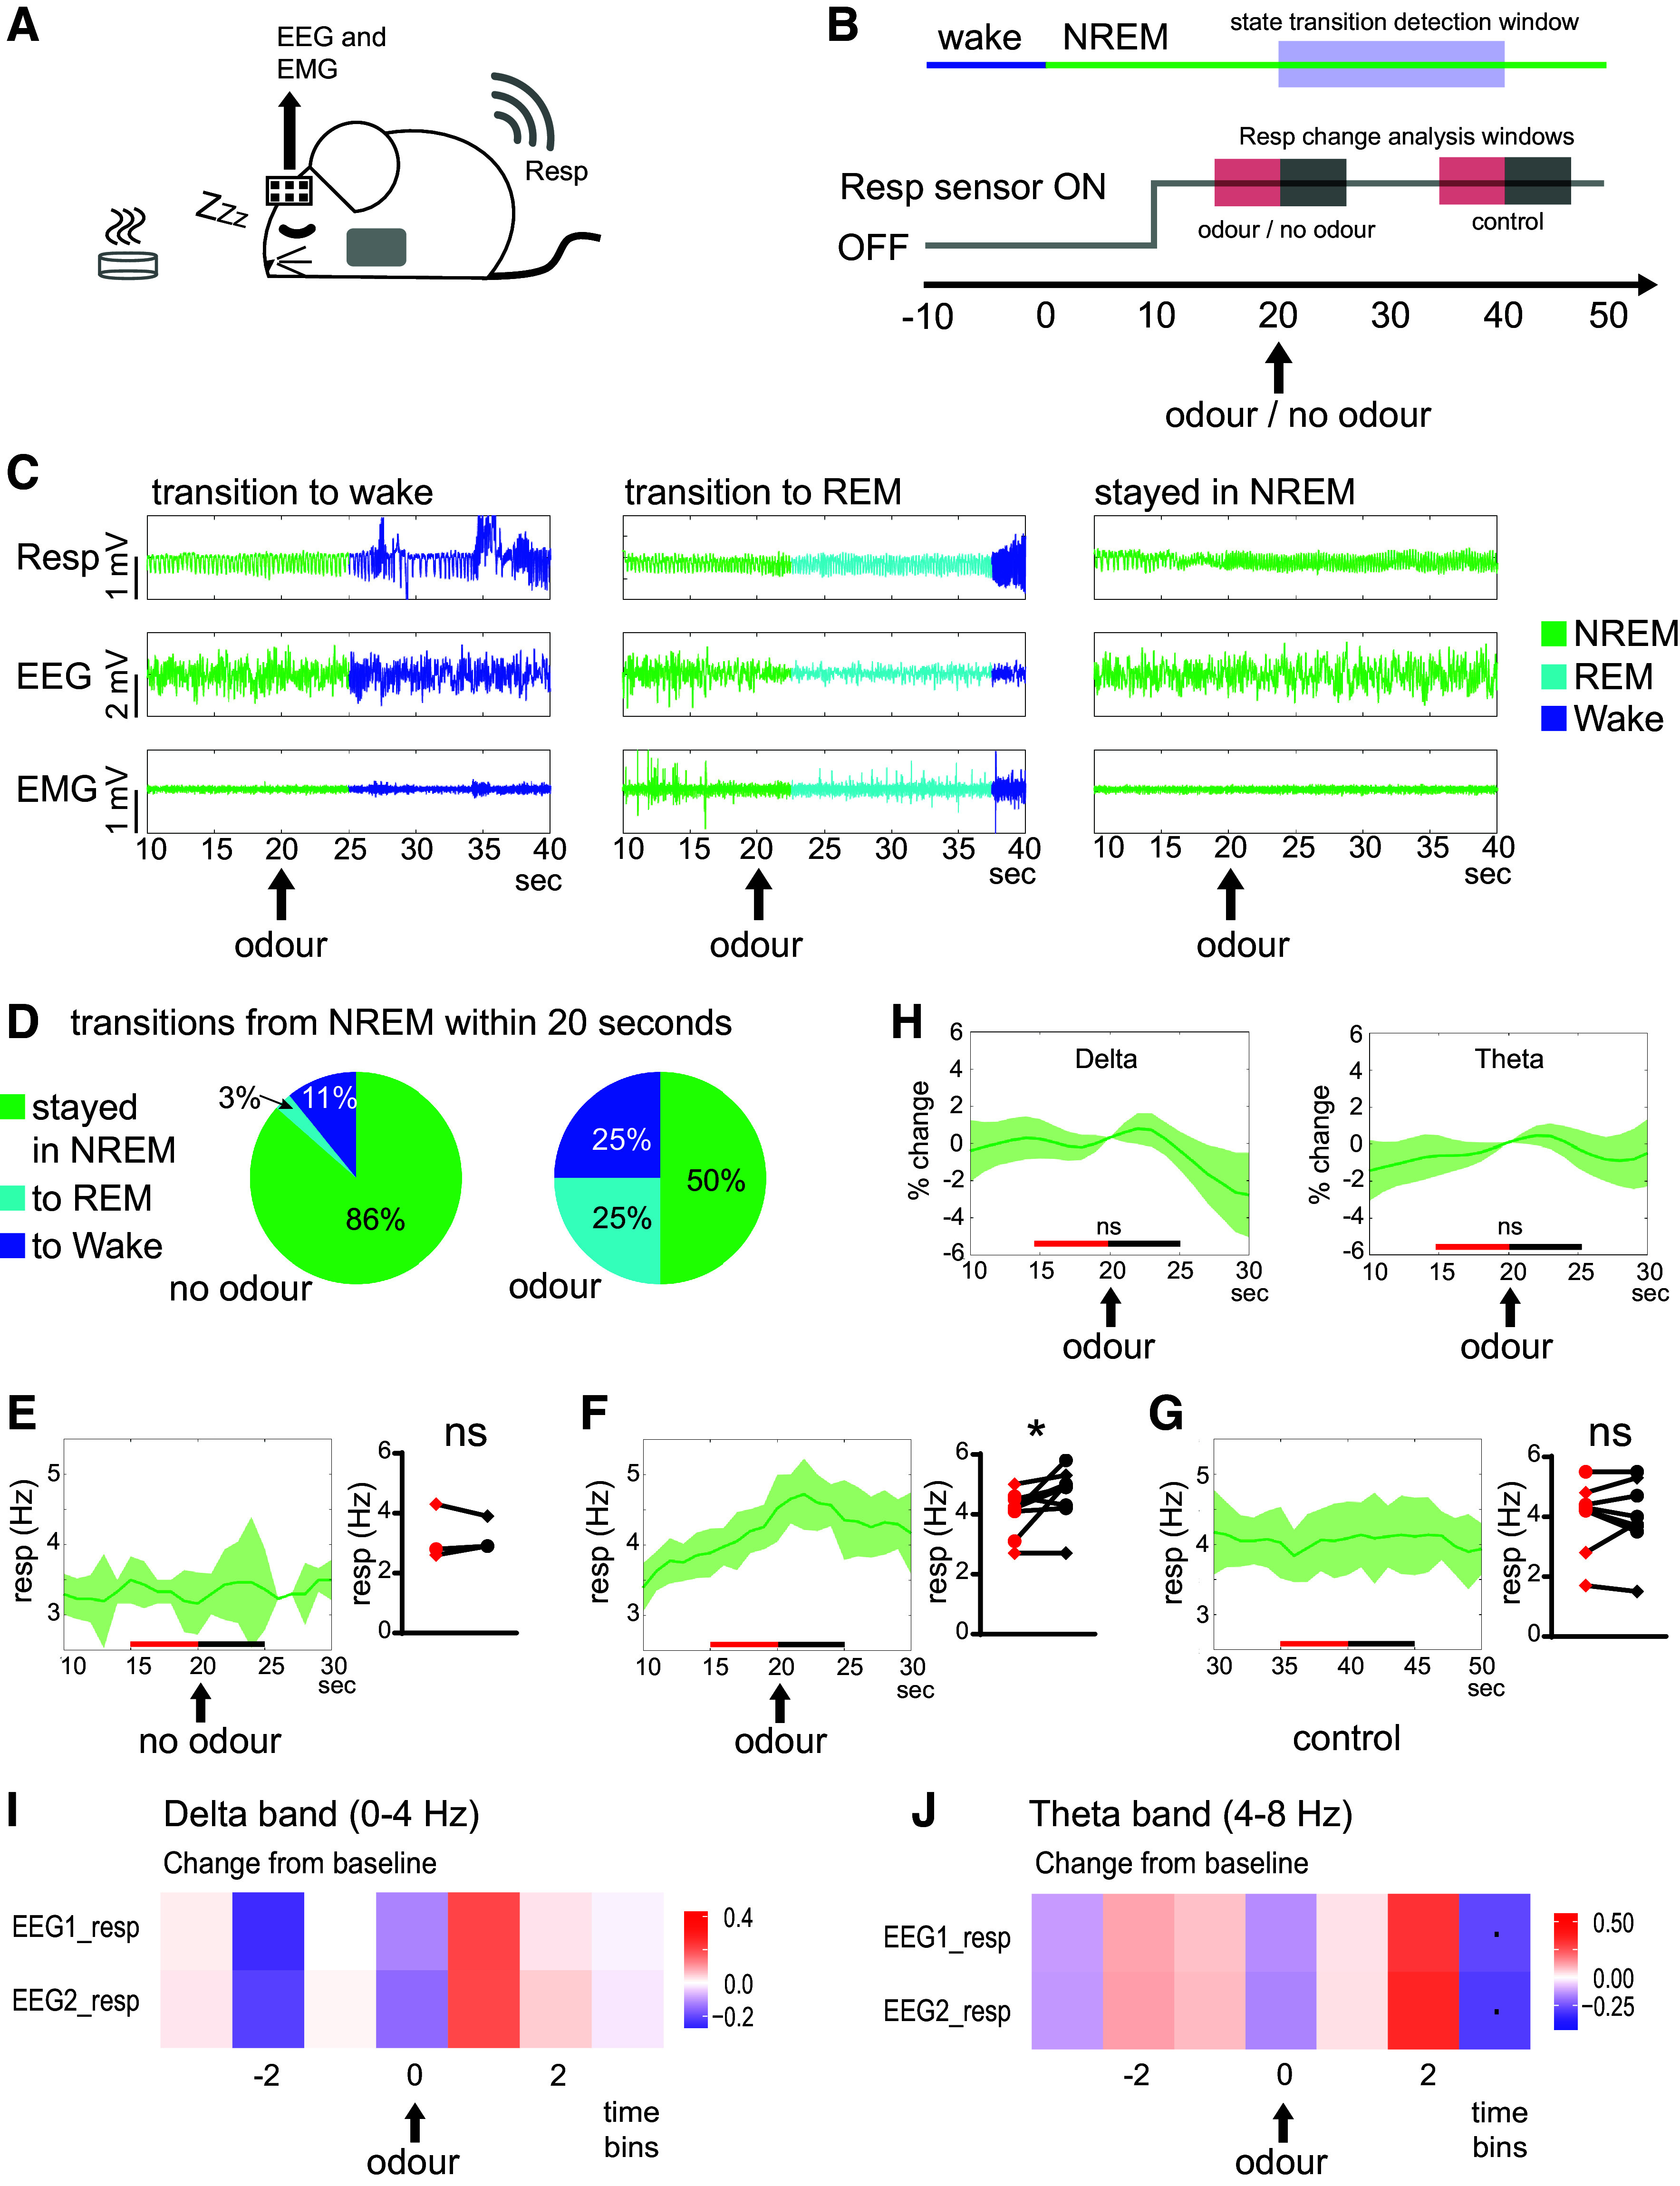
Active sampling in the olfactory domain is a fundamental aspect of mouse behavior, and there is increasing evidence that respiration-entrained neural activity outside of the olfactory system sets an important global brain rhythm. It is therefore crucial to accurately measure breathing during natural behaviors. We develop a new approach to do this in freely moving animals, by implanting a telemetry-based pressure sensor into the right jugular vein, which allows for wireless monitoring of thoracic pressure. After verifying this technique against standard head-fixed respiration measurements, we combined it with EEG and EMG recording and used evolving partial coherence analysis to investigate the relationship between respiration and brain activity across a range of experiments in which the mice could move freely. During voluntary exploration of odors and objects, we found that the association between respiration and cortical activity in the delta and theta frequency range decreased, whereas the association between respiration and cortical activity in the alpha range increased. During sleep, however, the presentation of an odor was able to cause a transient increase in sniffing without changing dominant sleep rhythms (delta and theta) in the cortex. Our data align with the emerging idea that the respiration rhythm could act as a synchronizing scaffold for specific brain rhythms during wakefulness and exploration, but suggest that respiratory changes are less able to impact brain activity during sleep. Combining wireless respiration monitoring with different types of brain recording across a variety of behaviors will further increase our understanding of the important links between active sampling, passive respiration, and neural activity.NEW & NOTEWORTHY Animals can alter their respiration rate to actively sample their environment, and increasing evidence suggests that neurons across the brain align their firing to this changing rhythm. We developed a new approach to measure sniffing in freely moving mice while simultaneously recording brain activity, and uncovered how specific cortical rhythms changed their coherence with respiration rhythm during natural behaviors and across arousal states.

Keywords: EEG; exploration; respiration; sleep.


Conflict of interest statement

No conflicts of interest, financial or otherwise, are declared by the authors.

Figures

None
Graphical abstract
Figure 1.
Figure 1.
Jugular vein implantation of thoracic pressure sensor. A: schema showing the final location of the pressure sensor tip in the jugular vein and the subcutaneous location of the transmitter on the back (B). CF: the critical steps of the surgery are tying the rostral knot on the right jugular vein (C); making the incision on the jugular vein (D); inserting the sensor tip through the incision toward the heart (E); and securing the sensor at the correct position for optimal signal (F).
Figure 2.
Figure 2.
Head-fixed experimental setup for simultaneous measurement from nasal flow sensor and thoracic pressure sensor. A: a schematic diagram of the experimental setup used for simultaneous measurement of real-time respiration signals using a flow sensor placed near the nostrils and a thoracic sensor implanted in the jugular vein of head-fixed mice. B: an example recording obtained simultaneously from the flow sensor (red) and the thoracic sensor (blue). A zoomed section is shown at the right.
Figure 3.
Figure 3.
Implanted thoracic sensor is a reliable way of measuring respiration in awake mice. A: an example recording obtained simultaneously using a flow sensor (red) and a thoracic sensor (blue) in a head-fixed mouse. B: average frequency (estimated using autocorrelation with a rolling 1-s window, see materials and methods) from the two traces in A. C: frequency estimate using the thoracic sensor vs. flow sensor. Each marker represents the average frequency obtained from 1-s segment of a trial. (Linear Regression analysis, R = 0.914, P < 0.001). Different colors represent different animals. D: error fraction in estimating frequency from the same traces as in C. E: an example stretch of sniffs demonstrating the consistency of time-interval between the measured inhalation peak using the two sensors. F: time-interval between the inhalation peak times measured from the two sensors simultaneously. The colors represent the same animals as in C. Solid markers represent means ± SD. The black marker represents the population average time-interval of −0.06 ± 0.03 s. G: histogram of the population of time difference in inhalation peak obtained from all the sniffs in F, n = 350.
Figure 4.
Figure 4.
Respiration measurement from freely moving mice implanted with thoracic sensors exploring an open arena. A: a schema of the experimental setup used for telemetry recording of respiration in freely moving animals in an open arena. B: an example trace of respiration recording from an animal while it freely navigated in the open arena (top). Note the respiration profiles in the two zoomed sections during high frequency respiration, low velocity movement (left), and high frequency, high velocity (right). C: histogram of respiration frequency estimate from all animals (n = 4 animals). Brown and green indicate the range of frequencies analyzed in E. D: histogram of running velocity from all animals in C. Brown and green indicate the range of velocities analyzed in F. E: average running velocity was independent from respiration frequency in frequency ranges between 1 and 5 Hz (brown) and 9 and 13 Hz (green, indicated in C). F: average respiration frequency was independent from running velocity at speeds of 1–10 cm/s (brown) and 35–45 cm/s (green, indicated in D). G: running velocity vs. respiration frequency does not show any substantial correlation (R = −0.0071, dotted line) from all the animals in C.
Figure 5.
Figure 5.
Mice show increased respiration frequency during exploring novel food, object, and odor. A schematic diagram of the experimental setup used for mice exploring food (A), a novel object (B), and a novel odor while recording their respiration (C). D: an example respiration recording (top) and its corresponding respiration frequency estimate (bottom) for a trial where an inaccessible piece of food was placed in the arena. The pink bar denotes the time of exploration in that trial. Similar example for a trial in which a novel object (E) and novel odor (F) were placed in the arena. Respiration frequency plots from multiple trials performed by an animal exploring the inaccessible food (G), novel object (H), and novel odor (I). Note the change in sniff frequency during the exploration time. Dotted line indicates the time at which the animal stopped exploring for each trial. Baseline subtracted respiration frequency plotted against time for inaccessible food (n = 85) (J), novel object (n = 134) (K), and novel odor (n = 72) (L). The thick lines represent the mean and the shaded region represents the SE (4 mice). Respiration frequency during the period of exploration significantly increases from the baseline respiration frequency for inaccessible food (P = 0.0014) (M), novel object (P < 0.001) (N), and novel odor (P = 0.03) (O) (4 mice). *Significant difference (P < 0.05).
Figure 6.
Figure 6.
EEG, electromyogram (EMG), and sniff relationships during freely moving awake behavior. A: schematic of EEG/EMG electrode placement (top) and mouse implanted with both thoracic sensor and EEG/EMG recording devices (bottom). B: example raw traces from each of the four recording channels. C: graphical representation of the baseline relationships between the four recording channels. Partial coherence between each channel was estimated while the animals were awake but not moving in an open arena, in the absence of additional environmental cues. A line was drawn between any two channels if both 1) partial correlation > 0.15 and 2) P value for partial correlation being greater than 0 was <0.05. The thickness of each line represents the partial coherence estimate, and solid/dashed lines represent significant/not significant P values, respectively. This plot is for the theta band (see Supplemental Fig. S6.1 for other bands). D: spectral power plots for EEG and Respiration (Resp) channels recorded in the open arena (including moving and not moving epochs), showing brain activity and breathing signals in the delta-beta frequency ranges (n = 3 mice). EH: estimates of changes in partial coherence between channel pairs in time bins before (negative time lag), during (0 time lag), and after (positive time lag) an animal explores an introduced environmental cue (either novel object, novel odor, or food odor). Analysis was done separately for different frequency bands: delta (E; 4 mice), theta (F; 4 mice), alpha (G; 4 mice), and beta (H; 4 mice). Key for significance: **P < 0.01; *P < 0.05; ·P < 0.1.
Figure 7.
Figure 7.
Respiration frequency changes with vigilance state. A: raw example sniff, EEG, and electromyogram (EMG) signals in wake (blue), non-rapid eye movement (NREM, green), and rapid eye movement (REM, cyan) sleep. The respiration trace (top row) shows that respiration is varied and often large in amplitude during wake, highly regular and low in amplitude during NREM sleep, and slightly irregular during REM sleep. Respiration frequency tends to be high during wake and lower in NREM and REM sleep (zoomed in boxes). B: changes in respiration are seen almost instantaneously upon transition between different vigilance states (note, mammals typically do not transition from REM to NREM sleep). C: distributions of intersniff intervals for wake, NREM, and REM sleep, with mean respiration frequency for each state given in Hz.
Figure 8.
Figure 8.
Odor presentation during sleep. A: schematic of recording setup. While the animal was sleeping, EEG/EMG and respiration signals were recorded, and odors were placed in the animal’s home cage. B: schematic of analysis framework. Ten seconds after the animal entered NREM sleep (switch from blue to green, top row), the respiration sensor was turned on (for 1 min; gray line, middle row). Ten seconds later, odor was placed into the cage and the window for detecting state transitions was opened (for 20 s, blue shaded square). The red and black shaded squares represent the timing of respiration frequency comparisons (EG) and EEG frequency band comparisons (H). C: raw example traces of respiration (Resp), EEG, and EMG signals for an instance when the animal transitioned to wake, REM, or NREM, within 20 s of odor presentation. D: pie charts showing proportion of state transitions that occurred between 20 and 40 s from the onset of NREM sleep, for cases where odor was not presented (left pie chart) and cases where odor was presented at t = 20 s (right pie chart). While odor presentation did increase the proportion of transitions to wake and REM sleep, in half the cases, odor presentation did not cause the mouse to switch out of NREM sleep (10 out of 20 trials, across two mice). E: in three trials, the respiration sensor was turned on without any odor being presented. In these cases, respiration frequency did not change 20 s after the start of NREM sleep (left: dark green line represents mean across trials, shaded region represents SE; right: paired t test, P = 0.16, two shapes represent two mice). F: in the cases where odor presentation did not cause transition out of NREM sleep, there was a significant increase in the average respiration frequency (paired t test, P = 0.021; colors and shapes as in E). G: control comparisons made 20 s after odor presentation (in cases where animal was still in NREM sleep) did not reveal a change in average respiration frequency (paired t test, P = 0.79; colors and shapes as in E). H: in cases where odor presentation did not cause transition out of NREM sleep, there was no significant change in the EEG delta power (H; P = 0.40) or theta power (I; P = 0.31) (colors as in EG; P values are from paired t tests, comparing average values for 5 s shown in red vs. 5 s shown in black, as in EG). I and J: estimates of changes in partial coherence between channel pairs in time bins before (negative time lag), during (0 time lag), and after (positive time lag) an odor was introduced to the animal during NREM sleep (as for FH, only including trials in which the animal remained in NREM sleep, 10 trials across two mice). Analysis was done separately for the dominant sleep frequency bands: delta and theta. Key for significance: *P < 0.05; ·P < 0.1.

Similar articles

Cited by

References

    1. Schroeder CE, Wilson DA, Radman T, Scharfman H, Lakatos P. Dynamics of active sensing and perceptual selection. Curr Opin Neurobiol 20: 172–176, 2010. doi:10.1016/j.conb.2010.02.010. - DOI - PMC - PubMed
    1. Margrie TW, Schaefer AT. Theta oscillation coupled spike latencies yield computational vigour in a mammalian sensory system. J Physiol 546: 363–374, 2003. doi:10.1113/jphysiol.2002.031245. - DOI - PMC - PubMed
    1. Kepecs A, Uchida N, Mainen ZF. The sniff as a unit of olfactory processing. Chem Senses 31: 167–179, 2006. doi:10.1093/chemse/bjj016. - DOI - PubMed
    1. Verhagen JV, Wesson DW, Netoff TI, White JA, Wachowiak M. Sniffing controls an adaptive filter of sensory input to the olfactory bulb. Nat Neurosci 10: 631–639, 2007. doi:10.1038/nn1892. - DOI - PubMed
    1. Cenier T, McGann JP, Tsuno Y, Verhagen JV, Wachowiak M. Testing the sorption hypothesis in olfaction: a limited role for sniff strength in shaping primary odor representations during behavior. J Neurosci 33: 79–92, 2013. doi:10.1523/JNEUROSCI.4101-12.2013. - DOI - PMC - PubMed

Publication types

LinkOut - more resources