. 2024 Jun:104:105176.
doi: 10.1016/j.ebiom.2024.105176. Epub 2024 May 28.

TGF-β signalling limits effector function capacity of NK cell anti-tumour immunity in human bladder cancer

Affiliations

TGF-β signalling limits effector function capacity of NK cell anti-tumour immunity in human bladder cancer

Joshua K M Wong et al. EBioMedicine. 2024 Jun.

Abstract

Background: Natural killer (NK) cells are important innate immunity players and have unique abilities to recognize and eliminate cancer cells, particularly in settings of antibody-opsonization and antibody-dependant cellular cytotoxicity (ADCC). However, NK cell-based responses in bladder cancers to therapeutic antibodies are typically immunosuppressed, and these immunosuppressive mechanisms are largely unknown.

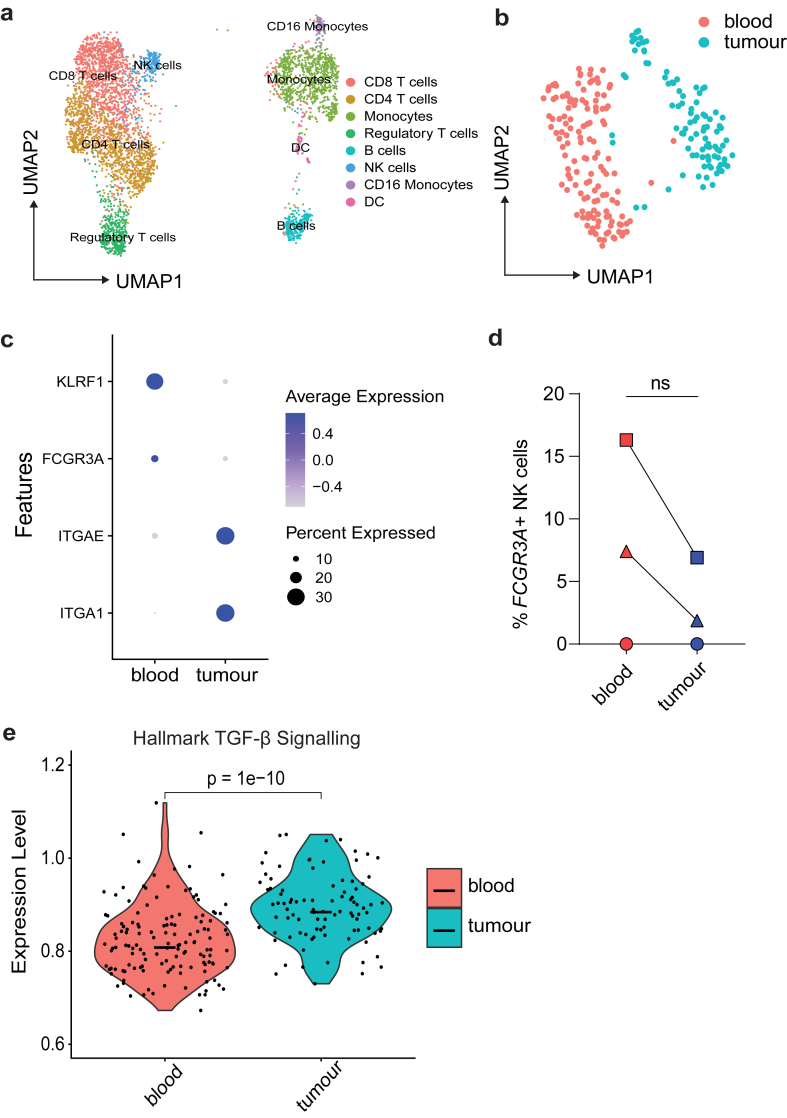
Methods: Single cell RNA sequencing (scRNA-seq) and high-dimensional flow cytometry were used to investigate the phenotype of tumour-infiltrating NK cells in patients with bladder cancer. Further, in vitro, and in vivo models of this disease were used to validate these findings.

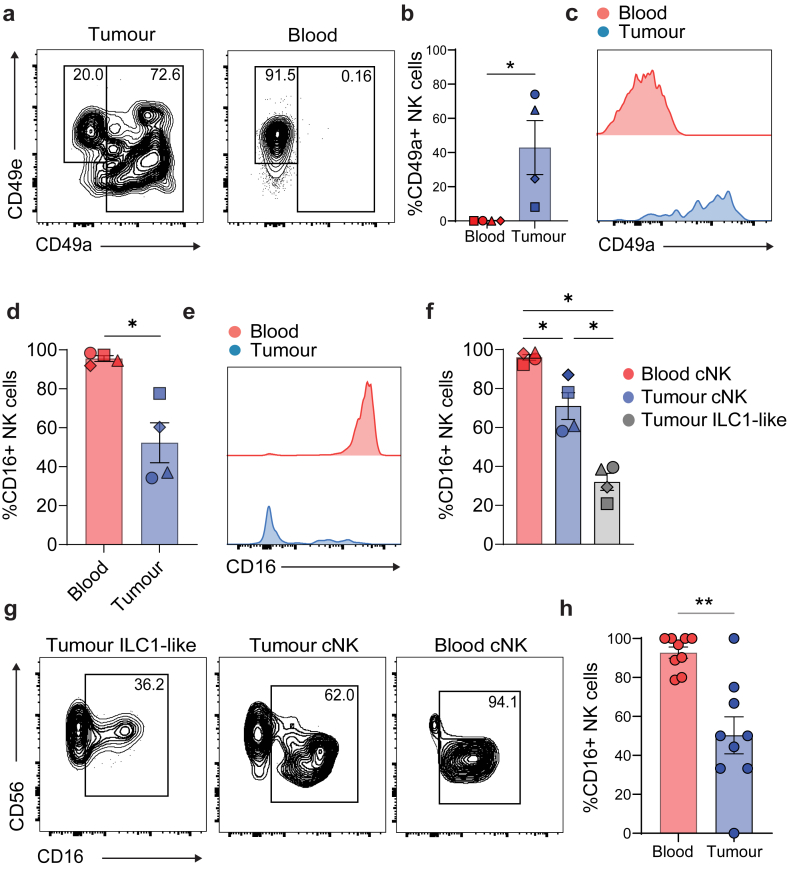
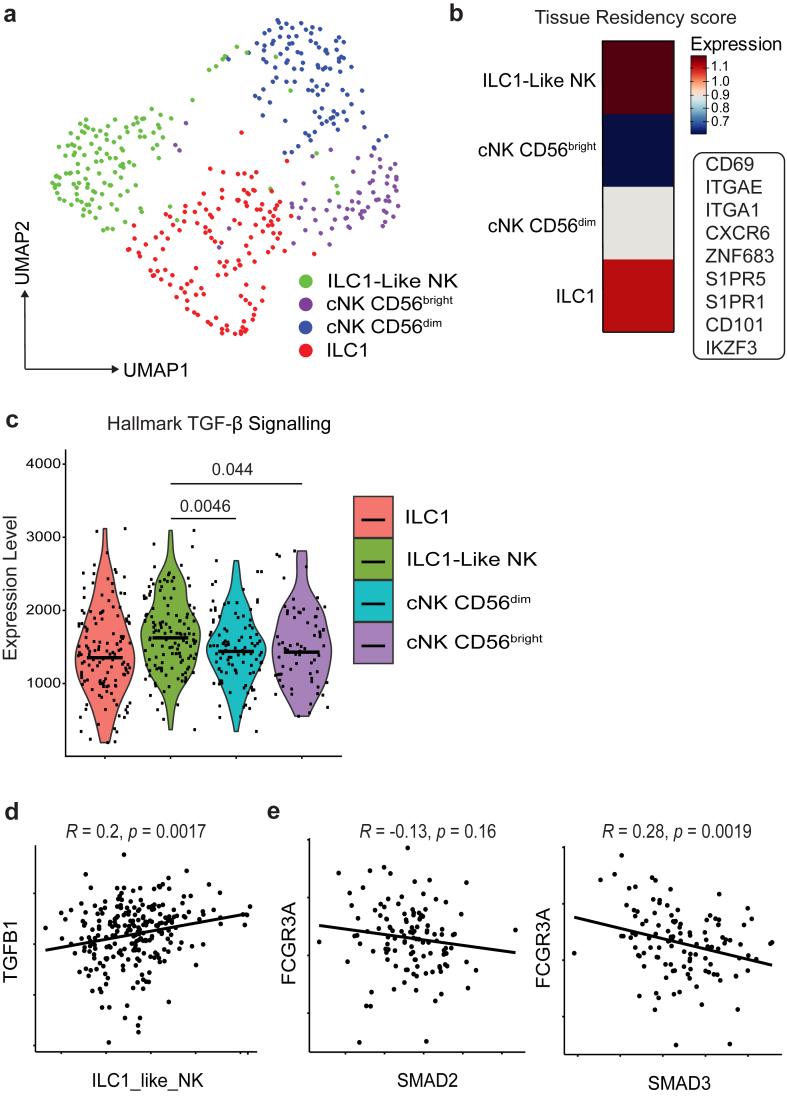
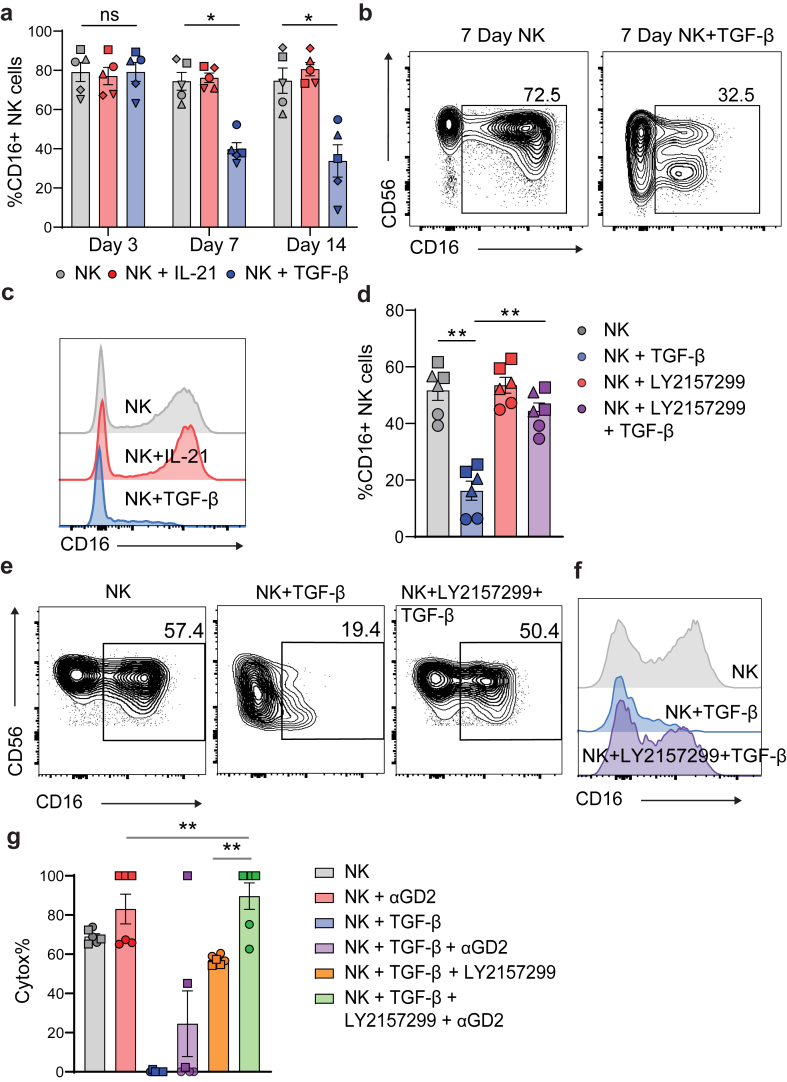
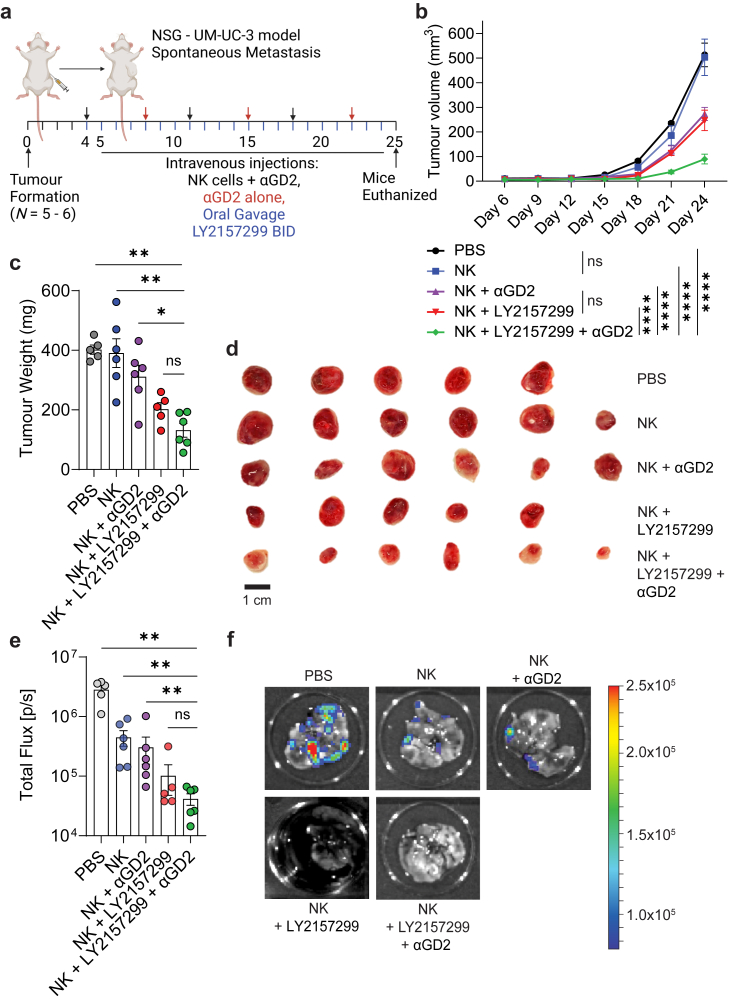
Findings: NK cells within bladder tumours displayed reduced expression of FcγRIIIa/CD16, the critical Fc receptor involved in ADCC-mediated cytotoxicity, on both transcriptional and protein levels. Transcriptional signatures of transforming growth factor (TGF)-β-signalling, a pleiotropic cytokine known for its immunosuppressive and tissue residency-inducing effects, were upregulated in tumour-infiltrating NK cells. TGF-β mediated CD16 downregulation on NK cells, was further validated in vitro, which was accompanied by a transition into a tissue residency phenotype. This CD16 downregulation was also abrogated by TGF-βR signalling inhibition, which could also restore the ADCC ability of NK cells subject to TGF-β effects. In a humanized mouse model of bladder cancer, mice treated with a TGF-β inhibitor exhibited increased ADCC activity compared to mice treated only with antibodies.

Interpretation: This study highlights how TGF-β-rich bladder cancers inhibit NK cell-mediated ADCC by downregulating CD16. TGF-β inhibition represents new avenues to reverse immunosuppression and enhance the tumoricidal capacity of NK cells in bladder cancer.

Funding: The Guimaraes Laboratory is funded by a US Department of Defense-Breast Cancer Research Program-Breakthrough Award Level 1 (#BC200025), a grant (#2019485) awarded through the Medical Research Future Fund (MRFF, with the support of the Queensland Children's Hospital Foundation, Microba Life Sciences, Richie's Rainbow Foundation, Translational Research Institute (TRI) and UQ), and a grant (#RSS_2023_085) funded by a Metro South Health Research Support Scheme. J.K.M.W. is funded by a UQ Research Training Program PhD Scholarship and N.O. is funded by a NHMRC Postgraduate Scholarship (#2021932).

Keywords: ADCC; Bladder cancer; CD16; NK cells; TGF-β.


Conflict of interest statement

Declaration of interests A/Prof. F. Simpson declares support from NHMRC Investigator grant (#2026628) and holds patents unrelated to this manuscript. She serves on advisory boards (Elsevier, UQ Academic Board, Victorian Cancer Council and NSW Cancer Council); and none of these roles' present conflicts with this study. A/Prof. Guimaraes' laboratory is funded by multiple grants, including the US Department of Defense and Medical Research Future Fund. He consults for Microba Life Sciences and Prescient Therapeutics, with all payments made to his institution and unrelated to this study. Both authors confirm that these disclosures do not influence the findings of this manuscript. The remaining authors declared that there is no conflict of interest related to this work.

Figures

Fig. 1
Fig. 1
scRNA-seq of human bladder cancer identifies immunosuppressed tumour infiltrating NK cells. Bladder tumours harvested from patients and matched blood were analysed by scRNA-seq. (a) UMAP plot of CD45+ cells coloured clusters defined by canonical immune markers, where each dot represents a single cell. (b) UMAP plots of NK cell clusters where clusters separated by tissue compartment. (c) Dot plots showing expression of indicated genes across tumour or blood derived NK cell clusters. (d) Individual patient raw gene counts for indicated gene FCGR3A plotted as a percentage of total NK cells (n = 3). Data from one experiment (n = 3 biological samples) where each symbol represents an individual patient, graphs show mean value ± SEM. Groups were compared using Mann–Whitney t test, where P > 0.05 was deemed not significant. (e) Violin plots showing relative enrichment of indicated Hallmark gene sets, calculated by ssGSEA (n = 3). ssGSEA groups were compared using Welch's t test, where P > 0.05 was deemed not significant.
Fig. 2
Fig. 2
Validation of CD16 downregulation on NK cells within bladder tumours. CD16 marker expression on NK cells from human bladder tumours and matched blood was analysed by multiparametric flow cytometry. (a) Representative flow cytometry plots showing CD49a (ILC1-like marker) and CD49e (conventional NK cell marker) expression from one patient resected tumour and blood. (b) CD49a expression as a bar plot and (c) representative histogram plot for both tumour and blood NK (CD45+linCD56+NKp46+) cells. (d) CD16 expression as a bar plot and (e) representative histogram plot for both tumour and blood NK (CD45+linCD56+NKp46+) cell. (f) CD16 expression as a percentage of each gated cell type; conventional blood NK cell (CD45+linCD56+NKp46+CD49e+CD49a) (cNK), tumour conventional NK cell (CD45+linCD56+NKp46+CD49e+CD49a) and tumour ILC1-like NK cell (CD45+linCD56+NKp46+CD49eCD49a+) displayed as bar plots and (g) representative contour plots. Data from 4 independent experiments (n = 4) and each symbol represents an individual patient bar graphs show mean value ± SEM Statistical P values determined by Mann–Whitney t test, where ∗P < 0.05. (H) Tumour bearing NSG IL-7/IL-15 KI mice were injected with isolated human PBMC and after 3 days blood and tumours were taken to analyse NK cell populations. Expression of CD16 on NK cells across each compartment. Data are from two separate pooled experiments, denoted by symbols (n = 9). Each symbol represents an individual mouse, bar graphs show mean value ± SEM. Statistical P values determined by Mann–Whitney t test, where ∗P < 0.05, and ∗∗P < 0.01.
Fig. 3
Fig. 3
scRNA-seq and bulk sequencing datasets in bladder cancer further identifies TGF-β as a potential cause for CD16 loss. (a) UMAP plot showing NK cell clusters, integrated from 5scRNA-seq datasets from samples retrieved from patients with bladder cancer (n = 5). (b) Heatmap showing tissue residency score for each cluster as defined by indicated genes within the panel. (c) Violin plots showing relative enrichment of indicated Hallmark gene sets, calculated by ssGSEA. ssGSEA groups were compared using Welch's t test. (d) Correlation between ILC1-like NK score and TGFB1 subgroups in TCGA BLD cohort. (e) Correlation between FCRG3A and SMAD2/3 subgroups in TCGA BLD partitioned by high expression of NKscore. Coefficient was calculated with Pearson correlation analysis. Significant differences are indicated where P > 0.05 was deemed not significant.
Fig. 4
Fig. 4
TGF-β causes downregulation of CD16 on NK cells and limits ADCC capability in vitro. NK cells from human blood were isolated and cultured for 3, 7 or 14 days in the presence of 5 ng/ml IL-15 and 500 IU/ml IL-2 plus the indicated cytokines. (a) CD16 expression on NK cells (CD45+linCD56+NKp46+) across indicated timepoints. (b) representative flow cytometry plots and (c) histogram plots at day 7. Data are from a 5 biological replicates (n = 5). Error bars indicate mean ± SEM. Groups were compared using Mann–Whitney test, where P > 0.05 was deemed not significant, where ∗P < 0.05. (D) CD16 expression on NK cells (CD45+CD3NKp46+) treated with TGF-βR inhibitor (LY2157299) cultured for 7 days. (e) representative flow cytometry plots and (f) histogram plots at Day 7. Data are from 3 biological replicates, where symbols denote different patients, with two technical replicates each (n = 3). Error bars indicate mean ± SEM. Groups were compared using Mann–Whitney test, where P > 0.05 was deemed not significant, where ∗P < 0.05, and ∗∗P < 0.01. (g) cytotoxicity of NK cells against bladder cell line UM-UC-3 in the presence of indicated conditions. Data are from 2 biological replicates, where symbols denote different patients, with 3 technical replicates each (n = 2). Error bars indicate mean ± SEM. Groups were compared using Mann–Whitney t test, where P > 0.05 was deemed not significant, where ∗P < 0.05, and ∗∗P < 0.01.
Fig. 5
Fig. 5
Concurrent in vivo anti-GD2 mAb treatment with TGF-β inhibition arrests tumour growth and abrogates metastasis. (a) hIL7/IL15 KI NSG mice bearing subcutaneous UM-UC-3 tumours were humanized with 5 × 106 PBMC derived NK cells and reinjected once per week. Mice were injected with dinutuximab (αGD2, 500 μg) twice per week and gavaged with a TGF-β inhibitor galunisertib BID (LY2157299, 75 mg/kg). (b) The combination of αGD2 and LY2157299 was effective in reducing tumour growth, with the growth of combination-treated tumours being essentially arrested, groups (n = 5–6) were compared using two-way ANOVA, where ∗∗∗∗P < 0.0001. NS, not significant. (c and d) This was reflected in final tumour weights and sizes. (e) Lung metastatic lesions were quantified using bioluminescent imaging and the total flux was measured. (f) Representative bioluminescent images of the lungs are shown for each group. Error bars indicate mean ± SEM. (c) and (e) Groups were compared using Mann–Whitney t test, where P > 0.05 was deemed not significant, where ∗P < 0.05, and ∗∗P < 0.01. All data in this figure were generated with UM-UC-3 cells in NSG mice. (a) was created with BioRender.

References

    1. Souza-Fonseca-Guimaraes F., Cursons J., Huntington N.D. The emergence of natural killer cells as a major target in cancer immunotherapy. Trends Immunol. 2019;40(2):142–158. - PubMed
    1. Wong J.K.M., Dolcetti R., Rhee H., Simpson F., Souza-Fonseca-Guimaraes F. Weaponizing natural killer cells for solid cancer immunotherapy. Trends in Cancer. 2023;9(2):111–121. - PubMed
    1. Vivier E., Rebuffet L., Narni-Mancinelli E., Cornen S., Igarashi R.Y., Fantin V.R. Natural killer cell therapies. Nature. 2024;626(8000):727–736. - PubMed
    1. Cózar B., Greppi M., Carpentier S., Narni-Mancinelli E., Chiossone L., Vivier E. Tumor-infiltrating natural killer cells. Cancer Discov. 2021;11(1):34–44. - PMC - PubMed
    1. Eckl J., Buchner A., Prinz P.U., et al. Transcript signature predicts tissue NK cell content and defines renal cell carcinoma subgroups independent of TNM staging. J Mol Med. 2012;90(1):55–66. - PubMed

MeSH terms