. 2024 Jun 20;187(13):3338-3356.e30.
doi: 10.1016/j.cell.2024.04.048. Epub 2024 May 28.

Evolution of diapause in the African turquoise killifish by remodeling the ancient gene regulatory landscape

Affiliations

Evolution of diapause in the African turquoise killifish by remodeling the ancient gene regulatory landscape

Param Priya Singh et al. Cell. .

Abstract

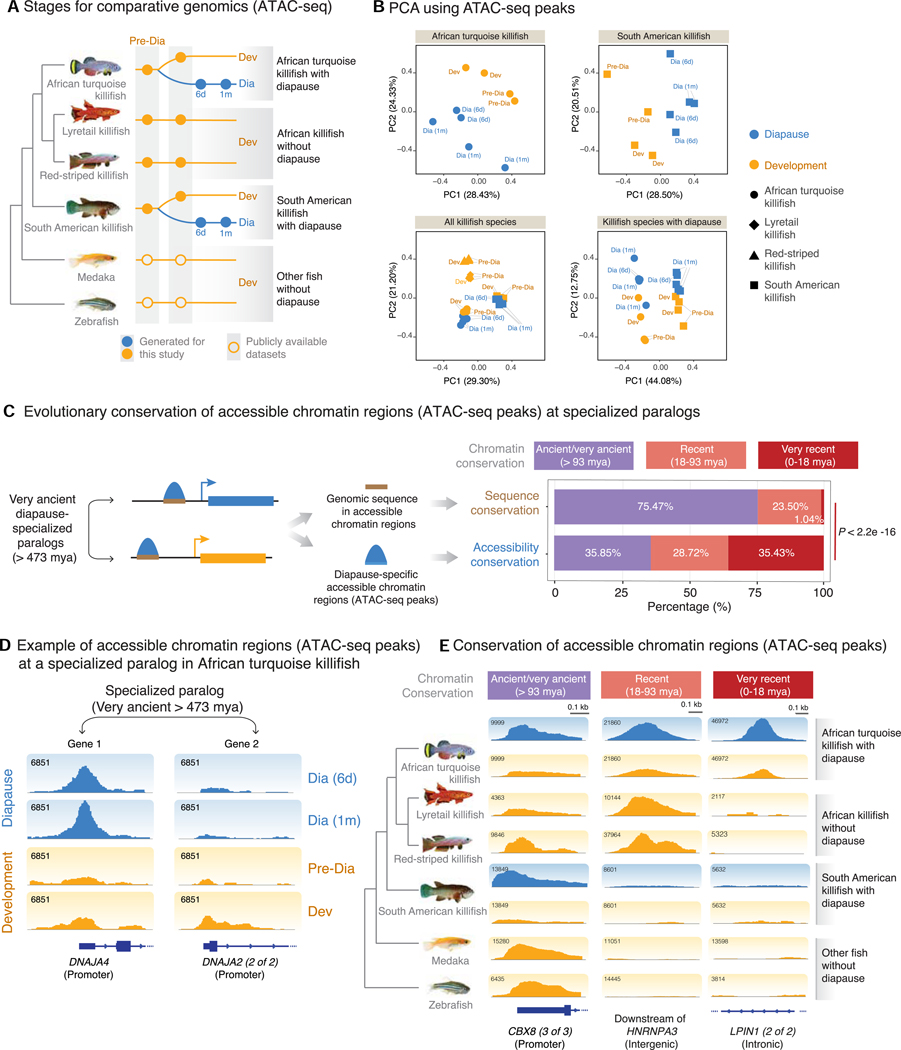
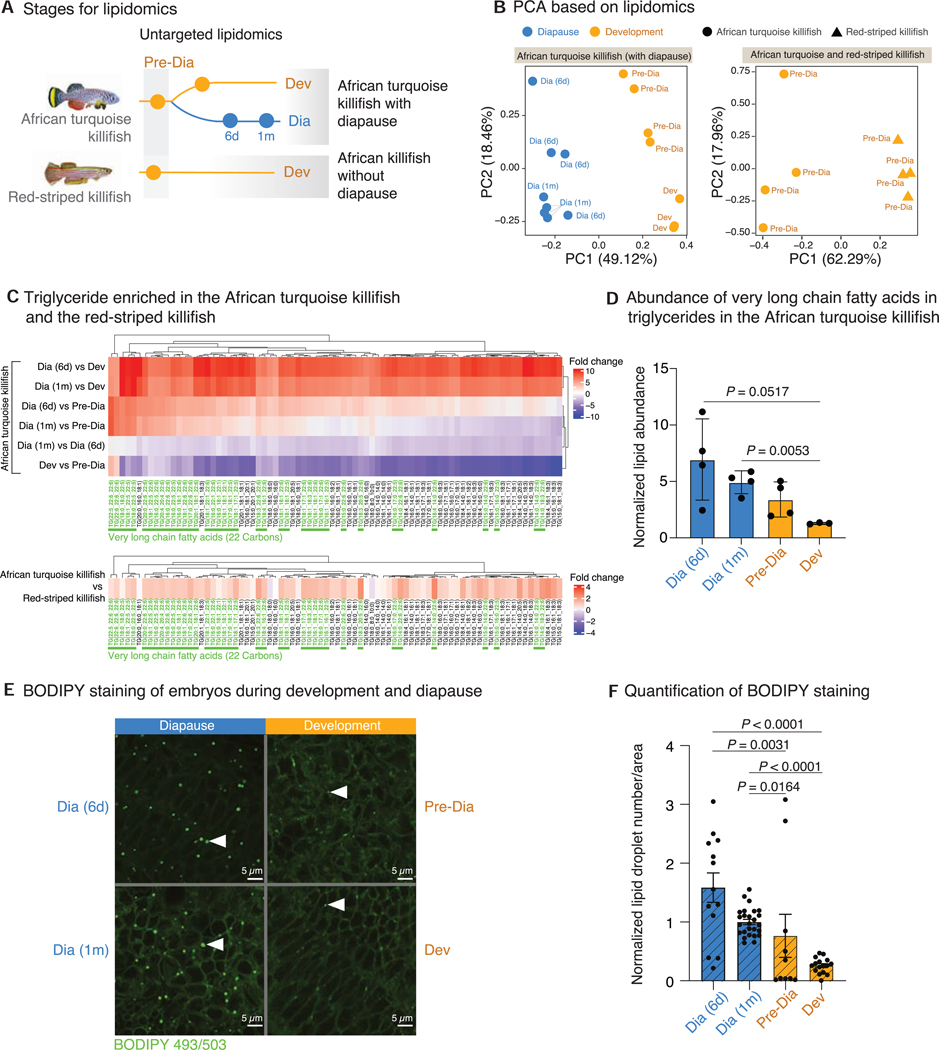
Suspended animation states allow organisms to survive extreme environments. The African turquoise killifish has evolved diapause as a form of suspended development to survive a complete drought. However, the mechanisms underlying the evolution of extreme survival states are unknown. To understand diapause evolution, we performed integrative multi-omics (gene expression, chromatin accessibility, and lipidomics) in the embryos of multiple killifish species. We find that diapause evolved by a recent remodeling of regulatory elements at very ancient gene duplicates (paralogs) present in all vertebrates. CRISPR-Cas9-based perturbations identify the transcription factors REST/NRSF and FOXOs as critical for the diapause gene expression program, including genes involved in lipid metabolism. Indeed, diapause shows a distinct lipid profile, with an increase in triglycerides with very-long-chain fatty acids. Our work suggests a mechanism for the evolution of complex adaptations and offers strategies to promote long-term survival by activating suspended animation programs in other species.

Keywords: aging; comparative genomics; complex trait evolution; diapause; epigenetics; epigenomics; killifish; lipidomics; metabolomics; suspended animation.


Conflict of interest statement

Declaration of interests A.B. is a scientific advisory board member of Calico. M.P.S. is a co-founder and the scientific advisory board member of Personalis, Qbio, January AI, SensOmics, Filtricine, Protos, Mirvie, Onza, Marble Therapeutics, Iollo, and NextThought AI. He is also on the scientific advisory board of Jupiter, Applied Cognition, Neuvivo, Mitrix, and Enovone. K.C. is currently an AstraZeneca employee.

Figures

Figure 1.
Figure 1.. Specialization of very ancient paralogs for expression in diapause in the African turquoise killifish
(A) Schematic of paralog specialization after gene duplication. After duplication from the same ancestral gene, genes from a paralog gene pair can specialize for different functions or states (e.g., diapause vs. development). (B) Examples of a paralog gene pair, with specialized expression of gene 1 in diapause (blue, EZH1) and gene 2 in development (orange, EZH2) in the African turquoise killifish. Bars represent mean expression level (normalized DESeq2 count) across replicates in diapause or development state. Dots show normalized DESeq2 counts in each replicate. Error bar is standard error of mean. Corrected p values (median from pairwise comparisons) from DESeq2 Wald test. (C) Boxplots showing expression levels (normalized DESeq2 counts) of all the specialized paralog pairs in diapause and development in the African turquoise killifish genome. Gene 1 of the paralog pair has a higher expression on average in diapause (blue) compared with development (orange), whereas gene 2 hasa higher expression on average in development (orange) compared with diapause (blue). p values from Kolmogorov-Smirnov test. (D) Schematic for binning paralog duplication time into 3 categories based on OrthoFinder pipeline with 71 species (see STAR Methods). Divergence time estimates are from Ensembl species tree. Binned categories include genes that were duplicated in the common ancestor of (1) all vertebrates or earlier (very ancient, >473 million years ago [mya]), (2) all fish (ancient, 111–473 mya), and (3) all killifish or the African turquoise killifish exclusively (recent or very recent, 0–111 mya). (E) Fraction of total paralog pairs within each of the very ancient (left), ancient (middle), and recent/very recent (right) binned categories. Violin plots represent the distribution of observed vs. expected specialized paralog fractions generated through 10,000 bootstrapped random sampling. Median and quartiles are indicated by dashed lines. The enrichment of diapause-specialized paralog pairs within each bin is compared with genome-wide expectation. p values from chi-square test. See also Figure S1.
Figure 2.
Figure 2.. Very ancient paralogs also specialize for expression in diapause in other killifish species with diapause
(A) Experimental design for analysis of RNA-seq datasets either publicly available (hollow circles) or de novo generated for this study (filled circles) (see also Table S1B). Killifish species are from Africa (with and without diapause) and South America (with diapause). Medaka and zebrafish are other teleost fish without diapause. The development stage (orange hollow circle) in the South American killifish corresponds to post-diapause development. Pre-Dia, pre-diapause; Dia, diapause; Dev, development; 6 days, 6 days in diapause; 1 month, 1 month in diapause. (B) Examples of paralog gene pair, with specialized expression of gene 1 in diapause (blue, EZH1) and gene 2 in development (orange, EZH2) in the South American killifish. Gene names displayed are the names assigned to the ortholog in the African turquoise killifish. Bars represent the mean expression level (normalized DESeq2 count) across replicates in diapause or post-diapause development state. Error bar is standard error of mean. Each dot represents the normalized expression level for all sample replicates in diapause or post-diapause development. p values from DESeq2 Wald test. (C) Boxplots showing the expression levels (normalized DESeq2 counts) of all the specialized paralog pairs in diapause and development in the South American killifish. Gene 1 of the paralog pair has a higher expression on average in diapause (blue) compared with development (orange), whereas gene 2 has a higher expression on average in development (orange) compared with diapause (blue). p values from Kolmogorov-Smirnov test. (D) Spearman’s rank correlation between ortholog genes that change with diapause in African turquoise killifish and South American killifish. Dots represent the fold change values of ortholog genes in diapause compared with development in the two species. Spearman’s correlation coefficient (r) and p values are indicated. Selected Gene Ontology (GO) terms shared between both species are listed on the right (see also Figure S2I and Table S2A). (E) Fraction of the total paralog pairs within each of the very ancient (left), ancient (middle), and recent/very recent (right) binned categories as described in Figure 1D. Violin plots represent the distribution of observed vs. expected specialized paralog fractions generated through 10,000 bootstrapped random sampling. Median and quartiles are indicated by dashed lines. The enrichment of diapause-specialized paralog pairs within each bin is compared with genome-wide expectation (reference). p values are from chi-square test. See also Figure S2.
Figure 3.
Figure 3.. Evolutionarily recent remodeling of genome-wide chromatin landscape drives specialized expression of very ancient paralogs in diapause
(A) Experimental design for the ATAC-seq datasets either publicly available (hollow circles) or de novo generated in this study (filled circles) (see also Table S1B). Pre-Dia, pre-diapause; Dia, diapause; Dev, development; 6 days, 6 days in diapause; 1 month, 1 month in diapause. (B) Principal-component analysis (PCA) on all chromatin accessibility regions in each species group: African turquoise killifish only (upper left), South American killifish only (upper right), all killifish species (lower left), and diapause-capable killifish (lower right). Each point represents the consensus ATAC-seq peaks (chromatin accessibility) from an individual replicate of a given species at a given developmental or diapause state. Percentage of the variance explained by each principal component (PC) is shown in parentheses. (C) Conservation analysis of genomic sequence and chromatin accessibility at very ancient paralogs with specialization in diapause vs. development. Left: schematic of the analysis. Right: percentage (e.g., conservation) of alignable regions containing diapause-specific chromatin accessibility (upper) and the conservation of diapause-specific chromatin accessibility (lower) near specialized ancient paralogs (see also Figures S3C–S3E). Although the majority of genomic sequences are ancient, the chromatin accessibility at those peaks evolved recently in the African turquoise killifish. p values from chi-square test. (D) Example of a chromatin accessibility regions (ATAC-seq peaks) at the promoter of genes from a very ancient paralog pair, with one gene specialized for expression in diapause (DNAJA4) and the other in development (DNAJA2). Replicates within each condition were aggregated by summation for visualization. Blue boxes and lines represent genomic features (exons and introns, respectively). (E) Examples of diapause-specific chromatin accessibility regions that are: ancient/very ancient (conserved across killifish and medaka or zebrafish; left), recent (conserved in at least 2 killifish species; middle), or very recent (specific to African turquoise killifish; right). Blue boxes and lines at the bottom represent genomic features for the closest gene (exons and introns, respectively). To generate tracks, reads per kilobase per million mapped reads (RPKM)-normalized reads were summed across replicates and biological time points (e.g., diapause and development separately) to obtain single tracks for each species. See also Figure S3.
Figure 4.
Figure 4.. Transcription factor binding site enrichment and conservation within diapause-accessible chromatin
(A) Left: word cloud for transcription factors whose binding sites are enriched in the diapause-specific chromatin-accessible regions (ATAC-seq peaks) at specialized paralogs using hypergeometric optimization of motif enrichment (HOMER). Right: consensus binding sites for selected transcription factors. y axis represents informational content (i.e., bits), which scales based on single-base overrepresentation in the binding sequence (0: bases are represented equally at 25% each in reference sequences; 2: a single base dominates the entirety of reference sequences at 100%). (B) Conservation in other fish species of the transcription-factor binding sites enriched in the diapause-specific chromatin-accessible regions in the African turquoise killifish. The majority of diapause-specific sites are very recent (i.e., specific to the African turquoise killifish) and not enriched in killifish species without diapause. Selected representative motifs are highlighted. See also Figure S4.
Figure 5.
Figure 5.. Mechanisms underlying the evolution of chromatin accessibility in diapause at specialized paralogs
(A) Schematic of two possible mechanisms for the evolution of the diapause-specific transcription factor binding sites in the African turquoise killifish genome. Upper: gradual mutations paired with selective pressure lead to the formation of binding sites for specific transcription factors and accompanying chromatin accessibility. Lower: a site experiences a transposable element (TE) insertion event, providing a novel sequence that contains a binding site for a specific transcription factor and accompanying chromatin accessibility. (B) Percentage contribution of the two possible evolutionary mechanisms (mutation and TE insertion) for motif evolution in diapause-specific chromatin at specialized paralogs. Mutation-derived or TE-derived motifs are subdivided for their conservation either only in the African turquoise killifish (dark colors) or in at least one other species (light colors). Binding expectations are based on the HOMER log odds ratio binding criteria (see STAR Methods). The largest fraction of diapause-specific binding sites likely evolved through mutations exclusively in the African turquoise killifish. (C) Example of a transcription factor binding site that likely evolved via mutation: FOXO3 binding site in a diapause-specific chromatin-accessible region of the African turquoise killifish genome near GPC3 (LOC107379575) and aligned regions in other fish species. Aligned sequences are colored based on the similarity to the canonical FOXO3 binding site from HOMER (top track). (D) Aggregated informational content across all FOXO3 transcription factor binding sites in diapause-specific accessible chromatin regions and aligned regions in other species. y axis is formatted using informational content (i.e., bits). The African turquoise killifish motif exhibits highest similarity to the canonical FOXO3 binding site. (E) Fraction of diapause-specific chromatin-accessible regions under positive selection in the African turquoise killifish (see STAR Methods) at false discovery rate (FDR) < 0.1. These regions are enriched for many TF binding sites (e.g., REST, FOXO3, and PPARA). (F) Enrichment or depletion of specific transposable elements (TEs) in the diapause-specific chromatin-accessible regions (ATAC-seq peaks) in the African turquoise killifish genome as compared with three sets of reference regions: the overall genomic abundance of the given TE (“Genome”), the abundance of the given TE in all chromatin-accessible regions (“Chromatin”), and the abundance of the given TE in size-matched control regions 10 kb away from ATAC-seq peak of interest (“Control loci”). (G) Example of a diapause-specific chromatin accessibility region containing a PPARA binding site overlapping with a TE. Almost all TE-derived motifs are specific to the African turquoise killifish. See also Figure S5.
Figure 6.
Figure 6.. Functional assessment of key transcription factor knockouts on the diapause gene expression program
(A) CRISPR-Cas9-based platform to assess the effect of transcription factor knockout on diapause and development gene expression programs in injected (F0) embryos in the African turquoise killifish (upper). Scheme of the stages for RNA-seq analysis (lower). Six transcription factors (TFs) were selected: REST, FOXO3a, FOXO3b, PPARAa, PPARAb, and PPARG. CRISPR-Cas9-mediated knockouts were conducted by injecting 3 single guide (sgRNAs) per gene in single-cell embryos. Non-injected embryos (wild type) and embryos injected with scrambled sgRNAs (scramble) were used as controls. Genotyping and RNA-seq on individual embryos were performed at two stages: diapause (Dia, blue, 6 days) or development (Dev, orange). A total of 130 single-embryo RNA-seq libraries were generated and analyzed. (B) Principal-component analysis (PCA) of transcription factor knockouts and control RNA-seq samples in the African turquoise killifish. Each shape represents transcriptome of a single embryo. Knockouts and wild-type/scramble controls are denoted by different shapes. PPARAa knockout was lethal, and no viable embryos were recovered. Color denotes diapause (blue) or development (orange) for each embryo. Percentage of variance explained by each principal component (PC) is shown in parentheses. (C) Fold changes of differentially expressed genes (DEGs) between diapause and development for each transcription factor knockout compared with scrambled sgRNAs-injected embryos (scramble). Each dot represents a single gene. Significantly differentially expressed genes (DEseq2, FDR < 0.1) are in color: diapause (dark blue) or development (dark orange). Genes not significantly changed are in gray. PPARAa knockout was embryonic lethal, and no viable embryos were recovered. (D) Schematic of possible results for the RNA-seq data analysis. Correlation plot where the x axis represents the fold change of DEGs in diapause vs. development control (wild type and scramble), and the y axis represents the fold change of DEGs in diapause embryos of transcription factor knockout (KO) vs. scramble. No correlation would indicate that the TF knockout has no effect on the diapause program (upper right). A positive correlation would indicate that the diapause program is enhanced upon TF knockout (middle right). A negative correlation would indicate that the diapause program is decreased by TF knockout and switches to a development-like state (bottom right). (E) Correlation plot between the fold change of DEGs in diapause vs. development control (wild type and scramble) (x axis) and the fold change of DEGs in TF knockout (KO) vs. scramble (in diapause) (y axis). Similar results were observed with either type of control (wild type or scramble). Dots represent individual DEGs with FDR < 0.1. Spearman’s correlation ρ and p values are displayed for each transcription factor knockout plot. (F) GO enrichment analysis of the diapause-specific changes observed for the three TF knockouts. Enriched GO terms from gene set enrichment analysis (GSEA) were compared for diapause embryos in non-injected samples (wild type), scrambled-sgRNA-injected samples (scramble), and knockout samples (KO), respectively. Representative GO functions are listed on the right, and functions related to lipid metabolism are highlighted in boxes (see also Tables S6A–S6C). (G) Paralog specialization in diapause and development upon REST knockout. Paralog specialization for diapause and development (light blue/light orange) is reduced in the context of REST knockout (dark blue/dark orange) compared with control (median expression in both wild-type and scramble samples). p value is from two-way ANOVA. See also Figures S5 and S6.
Figure 7.
Figure 7.. Functional enrichment and lipidomics reveal specific lipids in the diapause state
(A) Experimental design for untargeted lipidomics in the African turquoise killifish (with diapause) and the red-striped killifish (without diapause). (B) Principal-component analysis (PCA) on the estimated concentrations for all detected lipids for the African turquoise killifish only (left) and for both killifishes (right). Each point represents an individual replicate from a given species at a given developmental or diapause stage. Variance explained by each principal component (PC) is shown in parentheses. (C) Heatmaps representing the fold change of significantly different triglycerides between diapause vs. development in the African turquoise killifish (upper) and between the African turquoise killifish vs. red-striped killifish (development only, lower). Fold change values are plotted between each pairwise comparison between diapause and development time points, or the two development or diapause time points. For most triglycerides, levels are higher at both 1-month and 6-day diapause relative to development. The bottom panel shows the fold change values of the same lipids in the African turquoise killifish compared with the red-striped killifish; levels of most triglycerides are higher in the African turquoise killifish. Very-long-chain fatty acids among displayed triglycerides species are highlighted in green. (D) Lipid abundance counts for very-long-chain triglycerides (TGs) in the African turquoise killifish during development (orange) and diapause (blue) time points. Bars represent mean ± SEM. Dots represent individual replicates. p values from Welch’s t test. (E) Representative images of BODIPY 493/503 staining in the African turquoise killifish embryos in diapause and development (63× objective). Diapause embryos (left) were either 6 days or 1 month in diapause (Dia). Development embryos (right) were either pre-diapause (pre-Dia) or in 1 day of development (Dev). Scale bars, 5 μm. White arrows highlight lipid droplets stained by BODIPY. (F) Quantification of lipid droplet number (normalized to the 1-month diapause time point) in African turquoise killifish embryos stained with BODIPY 493/503. Bars represent mean ± SEM. Each dot represents an individual embryo. Graph represents five experiments merged. p values from Welch’s t test (see Table S7D). See also Figure S7.

Similar articles

Cited by

References

    1. Cellerino A, Valenzano DR, and Reichard M. (2016). From the bush to the bench: the annual Nothobranchius fishes as a new model system in biology. Biol. Rev. Camb. Philos. Soc 91, 511–533. 10.1111/brv.12183. - DOI - PubMed
    1. Platzer M., and Englert C. (2016). Nothobranchius furzeri: A Model for Aging Research and More. Trends Genet. 32, 543–552. 10.1016/j.tig.2016.06.006. - DOI - PubMed
    1. Vrtílek M, Žák J, Pšenička M, and Reichard M. (2018). Extremely rapid maturation of a wild African annual fish. Curr. Biol 28, R822–R824. 10.1016/j.cub.2018.06.031. - DOI - PubMed
    1. Hu CK, and Brunet A. (2018). The African turquoise killifish: A research organism to study vertebrate aging and diapause. Aging Cell 17, e12757. 10.1111/acel.12757. - DOI - PMC - PubMed
    1. Reichard M, and Polačik M. (2019). Nothobranchius furzeri, an ‘instant’ fish from an ephemeral habitat. eLife 8, e41548. 10.7554/eLife.41548. - DOI - PMC - PubMed

Supplementary concepts