. 2024 Jul 18;31(7):1349-1362.e5.
doi: 10.1016/j.chembiol.2024.05.001. Epub 2024 May 28.

Specificity profiling of deubiquitylases against endogenously generated ubiquitin-protein conjugates

Affiliations

Specificity profiling of deubiquitylases against endogenously generated ubiquitin-protein conjugates

Valentina Rossio et al. Cell Chem Biol. .

Abstract

Deubiquitylating enzymes (DUBs) remove ubiquitin from proteins thereby regulating their stability or activity. Our understanding of DUB-substrate specificity is limited because DUBs are typically not compared to each other against many physiological substrates. By broadly inhibiting DUBs in Xenopus egg extract, we generated hundreds of ubiquitylated proteins and compared the ability of 30 DUBs to deubiquitylate them using quantitative proteomics. We identified five high-impact DUBs (USP7, USP9X, USP36, USP15, and USP24) that each reduced ubiquitylation of over 10% of the isolated proteins. Candidate substrates of high-impact DUBs showed substantial overlap and were enriched for disordered regions, suggesting this feature may promote substrate recognition. Other DUBs showed lower impact and non-overlapping specificity, targeting distinct non-disordered proteins including complexes such as the ribosome or the proteasome. Altogether our study identifies candidate DUB substrates and defines patterns of functional redundancy and specificity, revealing substrate characteristics that may influence DUB-substrate recognition.

Keywords: DUB substrates; TMT-proteomics; Xenopus; deubiquitylating enzymes; ubiquitin.


Conflict of interest statement

Declaration of interests The authors declare no competing interests.

Figures
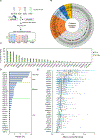
Figure 1.
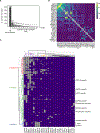
Figure 1.. Summary of the approach and Impact and Effect of each DUB on the immunopurified proteins
A) Xenopus egg extract was incubated with 10 μM UbVS. After 30 minutes, individual recombinant human DUBs (800 nM) or no DUB (as control) were added in together with HA-ubiquitin (50 μM) and incubated for 30 minutes. HA-ubiquitin conjugates were immunopurified and characterized by isobaric tag-based (TMT) mass spectrometry. Each experiment included four technical replicates for each DUB. B) Summary of the classes of cysteine protease DUBs. Black circles indicate the DUBs tested in our study. C) Percentage of proteins that changed in abundance in the immunoprecipitate in the presence of the indicated DUB. D) Percentage of proteins decreasing from the beads after addition of each DUB (Impact). E) Effect of the tested DUBs on their candidate substrates (Effect). See also Figure S1, Figure S2, Table S1 and Table S2.
Figure 2.
Figure 2.. Functional classification of the common set of proteins and analysis of their DUB sensitivity
A) Number of proteins identified and number of candidate DUB substrates for each functional class. B) The heatmap reports the percentage of proteins in each functional class that are candidate substrates for any DUB (first column; arranged from highest to lowest) and for each DUB (all subsequent columns). See also Figure S3 and Table S2
Figure 3.
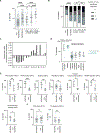
Figure 3.. Analysis of the common set of ubiquitylated proteins reveals both specific and redundant patterns of DUB activity
A) The graph illustrates the number of proteins in the common set insensitive to DUBs (non-substrates) or sensitive to one or more DUBs (candidate substrates). B) Two-way hierarchical clustering analysis using Euclidean distance with Ward’s inter-cluster linkage based on the activity of each DUB against each candidate substrate. For the three main substrate clusters (rows; red, green and blue), the average number of DUBs per substrate is shown on the left. On the right, DUB-specific candidate substrates are labeled, as well as known functions of some of the proteins. C) The heatmap reports the percentage of shared candidate substrates between each pair of DUBs tested in our experiments. See also Table S2.
Figure 4.
Figure 4.. DUB substrates possess a higher percentage of disorder compared to non-substrates
A) Percentage of disorder and (B) number of long disordered segments of the common set of proteins belonging to the indicated classes was calculated using the disorder prediction software Espritz. Statistical significance was calculated using a two-tailed unpaired t test (A) or a Chi squared test (B). C) CompositionProfiler software was used to determine enrichment or depletion of amino acid frequency in substrates compared to non-substates. Error bars: standard deviation. Statistically significant changes (p-value<0.05, two sample t-test) are shown in dark gray. D) Percentage of disorder of proteins belonging to different functional classes highly sensitive or insensitive to DUBs. Substrates are colored in green while non-substrates are in grey. E) Functional classes of proteins in which candidate DUB substrates have a higher percentage of disorder compared to non-substrates. The percentage of proteins sensitive to DUBs is indicated on top of each graph. F) Percentage of disorder of proteasomal and ribosomal proteins. Statistical significance was calculated using a two-tailed unpaired t-test (E and F). See also Figure S4 and Table S2.
Figure 5.
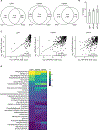
Figure 5.. Analysis of the reproducibility of the approach for the three highest Impact DUBs: USP7, USP9X and USP36
A) Overlap of candidate substrates identified in two independent experiments for USP7, USP9X and USP36. B) Impact in the two independent experiments. C) Correlation between the Effect calculated in the two experiments (p-value < 0.0001; ****). Exp: experiment. D) The heatmap reports the percentage of proteins in each functional class that were identified as high confidence DUB substrates. See also Figure S6, Figure S7, Figure S8 and Table S2.
Figure 6.
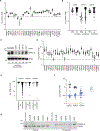
Figure 6.. Two distinct sets of DUBs target ribosomal and proteasomal proteins
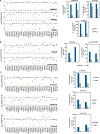
A) Profile of the ability of each DUB to alter the amount of immunoprecipitated RPS proteins, as measured in the original quantitative proteomic experiments, quantified by the log2-fold change in the presence or absence of each DUB (log2 DUB/No DUB). Each point represents a different RPS protein. Dashed line indicates the selected threshold for a candidate substrate (log2 DUB/NO DUB < −0.5). DUBs that caused a reduction in most RPS proteins are colored red. B) Log2 fold change of USP10, USP8, USP16 on all their substrates compared to RPS proteins. C) Extract was treated with UbVS. After 30 minutes, ubiquitin and the indicated DUBs were added (time 0). Samples were collected at 30 minutes and processed for immunoblotting (IB). D) Log2 fold change (DUB/NO DUB) for proteasome subunits. Dashed line: selected threshold (log2 < −0.5). DUBs that broadly caused a decrease of proteasomal subunits from the immunopurified proteins are labeled in red. E) Comparison of the effect of USP24, USP25, VCPIP1 on their substrates and on the proteasomal proteins. F) Log2 DUB/NO DUB of USP25, USP24 and VCPIP on the different proteasome subcomplexes and on the proteasomal shuttle proteins. G) Effect of DUBs on ubiquitylation of the proteasomal subunit PSMD2. Extract was treated with 10 μM UbVS. After 30 minutes, HA-ubiquitin or buffer and the indicated DUBs (or buffer) were added (time 0). At 30 minutes, the HA-ubiquitylated proteins were immunopurified from each condition and samples analyzed by immunoblotting. See also Figure S8, Figure S9 and Table S2.
Figure 7.
Figure 7.. Independent validation of candidate DUB substrates
Left: Original quantitative proteomic data across the ten experiments for each indicated candidate substrate. Experiments are coded by color. Data points are missing if the protein was not identified in an experiment. Right: Effect of DUBs on recombinant human proteins. Candidate human DUB substrates were translated in reticulocyte lysate and labeled with 35S-methionine. Labeled proteins were then added to extract pre-treated with UbVS together with HA-ubiquitin in the presence or absence of the indicated DUBs. After 30 minutes, samples were collected for SDS-PAGE and phosphorimaging. The percentage of reduction in ubiquitylation caused by addition of a specific DUB is reported for two independent experiments. The gels of the experiments are shown in Figure. S10. See also Figure S10.

Update of

References

    1. Komander D, and Rape M (2012). The ubiquitin code. Annu Rev Biochem 81, 203–229. 10.1146/annurev-biochem-060310-170328. - DOI - PubMed
    1. Yau R, and Rape M (2016). The increasing complexity of the ubiquitin code. Nat Cell Biol 18, 579–586. 10.1038/ncb3358. - DOI - PubMed
    1. Chau V, Tobias JW, Bachmair A, Marriott D, Ecker DJ, Gonda DK, and Varshavsky A (1989). A multiubiquitin chain is confined to specific lysine in a targeted short-lived protein. Science 243, 1576–1583. 10.1126/science.2538923. - DOI - PubMed
    1. Clague MJ, Heride C, and Urbé S (2015). The demographics of the ubiquitin system. Trends Cell Biol 25, 417–426. 10.1016/j.tcb.2015.03.002. - DOI - PubMed
    1. Grice GL, and Nathan JA (2016). The recognition of ubiquitinated proteins by the proteasome. Cell Mol Life Sci 73, 3497–3506. 10.1007/s00018-016-2255-5. - DOI - PMC - PubMed

LinkOut - more resources