. 2024 May 29;15(1):4557.
doi: 10.1038/s41467-024-48818-9.

Glucocorticoids paradoxically promote steroid resistance in B cell acute lymphoblastic leukemia through CXCR4/PLC signaling

Affiliations

Glucocorticoids paradoxically promote steroid resistance in B cell acute lymphoblastic leukemia through CXCR4/PLC signaling

Souleymane Abdoul-Azize et al. Nat Commun. .

Abstract

Glucocorticoid (GC) resistance in childhood relapsed B-cell acute lymphoblastic leukemia (B-ALL) represents an important challenge. Despite decades of clinical use, the mechanisms underlying resistance remain poorly understood. Here, we report that in B-ALL, GC paradoxically induce their own resistance by activating a phospholipase C (PLC)-mediated cell survival pathway through the chemokine receptor, CXCR4. We identify PLC as aberrantly activated in GC-resistant B-ALL and its inhibition is able to induce cell death by compromising several transcriptional programs. Mechanistically, dexamethasone (Dex) provokes CXCR4 signaling, resulting in the activation of PLC-dependent Ca2+ and protein kinase C signaling pathways, which curtail anticancer activity. Treatment with a CXCR4 antagonist or a PLC inhibitor improves survival of Dex-treated NSG mice in vivo. CXCR4/PLC axis inhibition significantly reverses Dex resistance in B-ALL cell lines (in vitro and in vivo) and cells from Dex resistant ALL patients. Our study identifies how activation of the PLC signalosome in B-ALL by Dex limits the upfront efficacy of this chemotherapeutic agent.


Conflict of interest statement

S.A.A., J.P.V., and O.B. are designated as inventors for the European Patent application EP23307352 filed on December 22nd, 2023 in the names of Inserm, Université de Rouen, and CHU de Rouen and entitled “methods for preventing resistance to chemotherapy in acute lymphoblastic leukemia”. The remaining authors declare that the research was conducted in the absence of any commercial or financial relationships that could be construed as a potential conflict of interest. OB received research funding and/or honoraria from Argenx, BMS, CSL Behring, Egle Tx, OGD2, and UCB. M.G. received research funding from BridgeMedicines and holds equity of SeqRX. All other coauthors declare no competing interests.

Figures

Fig. 1
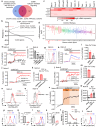
Fig. 1. PLCγ2 is highly expressed and active in B-ALL cells.
a Venn diagram of KEGG pathway analysis showing enriched pathways in non-leukemia and B-ALL samples from the R2 database in the Microarray Innovations in LEukemia (MILE) dataset (n = 26 enriched pathways in non-leukemia and n = 15 in B-ALL). Examples of enriched pathways are indicated for each subset. Two-tailed t-test, p-value < 0.05 for all pathways. b PLCγ2 mRNA ranked by expression level in B-ALL and other human tumors. Data were extracted from the cancer cell line encyclopedia (CCLE). Numbers refer to cancer cell types (see Supplementary Fig. 1d for listing) among which hematologic malignancies are shown in red. Boxplots show the mean, median, and 75th to 25th percentiles. c YY-graph of PLCγ2 mRNA expression levels in non-leukemia and B-ALL samples with expression levels ordered from left (low) to right (high) from (a). One-way analysis of variance (ANOVA) test. d PLCγ2 mRNA expression graphed as mean with SD between PBMCs and B-ALL samples in the Haferlach Leukemia dataset. Data were obtained from the Oncomine portal and shown as boxplots representing the 25th to 75th percentile range, mean, and median. Two-sided t-test. e An example of Nalm-6 cells staining with phospho-PLCγ2 antibody and isotype control. f Flow cytometry plots (left) and MFI (right) of the phosphorylated active form of PLCγ2 (phospho-PLCγ2 (Tyr759)). Data are mean ± SEM (n = 3 independent experiments). Two-tailed, unpaired Student’s t-test. g Flow cytometry plots (left) and mean fluorescence intensity (MFI, right) of total PLCγ2. Data are mean ± SEM (n = 3 independent experiments). Two-tailed, unpaired Student’s t-test. h, i Endoplasmic reticulum (ER) Ca2+ release in Nalm-6 and RS4;11 cell lines stimulated with 1 mM carbachol, Cch (h) or 0.5 mM adenosine triphosphate, ATP (i). Cells were preincubated with the indicated PLC inhibitors during Fura-2 loading before stimulation. j, k Quantification of maximal ER Ca2+ release from (h, i), respectively. Data are mean ± SEM (n = 3 independent experiments). Exact P-values from two-way ANOVA with Sidak’s multiple comparisons test were as follows: j Nalm-6: Ctr vs. U73122, p = 0.0001; Ctr vs. Edelfosine, p < 0.0001; Ctr vs. 3-Nitrocoumarin, p = 0.0002; Ctr vs. SPK-601, p = 0.0013; Ctr vs. D609, p < 0.0001; Ctr vs. Manoalide, p < 0.0001. j RS4;11: Ctr vs. U73122, p = 0.0296; Ctr vs. Edelfosine, p < 0.0186; Ctr vs. 3-Nitrocoumarin, p = 0.0013; Ctr vs. SPK-601, p = 0.0114; Ctr vs. D609, p = 0.0203; Ctr vs. Manoalide, p = 0.0484. k Nalm-6: Ctr vs. U73122, p = 0.0109; Ctr vs. Edelfosine, p = 0.0004; Ctr vs. 3-Nitrocoumarin, p = <0.0001; Ctr vs. SPK-601, p = 0.0017; Ctr vs. D609, p = 0.0003; Ctr vs. Manoalide, p < 0.0001. k RS4 ;11: Ctr vs. U73122, p = 0.0012; Ctr vs. Edelfosine, p < 0.0001; Ctr vs. 3-Nitrocoumarin, p = 0.0003; Ctr vs. SPK-601, p = 0.0002; Ctr vs. D609, p = 0.0002; Ctr vs. Manoalide, p = 0.0093. Source data are provided as a Source Data file.
Fig. 2
Fig. 2. Inhibition of the PLC pathway triggers cytotoxicity in ALL cell lines and Dex-resistant cells.
a, b Cell viability relative to the Ctr of RS4;11 (a) and Nalm-6 cells (b) after 48 h exposure to increasing concentrations of different PLC inhibitors (n = 3 independent experiments). c Viability normalized to the Ctr of Nalm-6 cells after 48 h exposure to increasing concentrations of different PKC inhibitors (n = 3 independent experiments). d Viability relative to the Ctr of Nalm-6 cells and RS4;11 cells after 48 h exposure to increasing concentrations of 1,4,5-trisphosphate (IP3)-induced Ca2+ release inhibitor (n = 4 independent experiments). e Viability normalized to the Ctr of RS4;11 cells after 48 h exposure to increasing concentrations of calcineurin inhibitors (n = 4 independent experiments). f Frequency of annexin V/PI-positive Nalm-6 cells determined by flow cytometry after 24 h of exposure to PLC inhibitors (n = 4 independent experiments). g Caspase-3 activity in Nalm-6 cells determined by using Ac-DEVD-AFC as substrate after 24 h of exposure to PLC and PKC inhibitors. Data are mean ± SEM n = 2 independent experiments, performed in 7 technical replicates. h Viability relative to the Ctr of Dex-resistant Nalm-6 cells (referred to as Nalm-6 R) and Dex-sensitive Nalm-6 cells (referred to as Nalm-6 S), exposed for 48 h with increasing concentrations of Dex (n = 4 independent experiments). i Viability relative to the Ctr of Nalm-6 R exposed for 48 h to increasing concentrations of PLC inhibitors (n = 3 independent experiments). j, k RNA-seq analysis of PLCγ2 expression in glucocorticoid-sensitive (S) or -resistant (R) primary B-ALL. Data are presented as mean ± SD and were extracted from publicly available transcriptomic dataset,. All data were analyzed using a standard Student’s t-test (two-sided). Unless otherwise indicated, data are presented as mean ± SEM. Source data are provided as a Source Data file.
Fig. 3
Fig. 3. Pharmacological inhibition of PLC alters gene expression in Dex-resistant Nalm-6 (Nalm-6 R).
a MA plot showing the relationship between log2-fold changes of RNA reads in U73122 versus Ctr Nalm-6 R cells plotted against mean expression values. Red dots represent genes with an adjusted p-value < 0.05 using DESeq2’s differential expression test. b Differentially expressed genes (DEG) in Nalm-6 R cells after 16-h exposure to 1 µM U73122 determined by RNA-seq analysis (false discovery rate [FDR] adjusted p < 0.05, and fold change (log2 scale) ≥1.5 or ≤ −1.5) using DESeq2 test. c, e, g Summary of Reactome (c), KEGG (e), and GO (g) pathway analysis of Ctr and U73122-treated cells. Venn diagram shows gene sets that are downregulated, non-significant (white), significant with p-value < 0.05 (pink), and unregulated (red) as determined by gene set enrichment analysis (GSEA) Kolmogorov–Smirnov test. Examples of unique pathways are indicated for each group. d, f, h Functional clustering of downregulated genes in U73122-exposed-Nalm-6 R cells (n = 2 biological replicates) with FDR adjusted p-value < 0.05 for KEGG (f), <0.001 for Reactome (d), <0.03 for GO Biological process (h) using GSEA (Kolmogorov–Smirnov) test. Some top pathways are indicated. i Hierarchical clustering after RNA-seq analysis showing DEG calculated by DESeq2 test in Nalm-6 R cells after U73122 exposure (n = 2 biological replicates). j Normalized enrichment scores of significantly up- or downregulated gene sets in Nalm-6 R cells after U73122 exposure (n = 2 biological replicates). k Representative GSEA enrichment plot showing upregulation of phosphatase_complex-related genes and downregulation of cell cycle checkpoint-related genes in Nalm-6 R cells after U73122 exposure (n = 2 biological replicates). l Heatmap of ER_stress_induced_apoptotic and cell cycle DEG in Nalm-6 R cells after U73122 exposure (n = 2 biological replicates). Source data are provided as a Source Data file.
Fig. 4
Fig. 4. Dexamethasone (Dex) triggers PLC-mediated Ca2+ signaling in ALL cells.
a Colored time-lapse images of Nalm-6 cells show the changes in cytosolic Ca2+ evoked by Dex in Ca2+-containing buffer. b Cytosolic Ca2+ measurements in Nalm-6 cells stimulated with 125 nM Dex in nominally Ca2+-free buffer (0 mM Ca2+) and Ca2+-containing buffer (4 mM Ca2+). c Quantification of maximal Ca2+ entry from (b). Data shown are the mean ± SEM (n = 6 independent experiments). d Flow cytometry plots of the active form of PLCγ2 (phospho-PLCγ2 (Tyr759)) stimulated with Dex or Ctr for 5 min. e Quantification from (d) normalized to Ctr. Data are mean ± SEM (n = 3 independent experiments). f, g Quantification of PLC activity (f) and intracellular concentration of PLC (mU/mL) (g) in Nalm-6 cells stimulated with 100 nM Dex or Ctr for 24 h with or without 1 µM U73122 and normalized to Ctr in (g). Data are mean ± SEM from n = 2 independent experiments, performed in technical octuplicates. h, i Cytosolic Ca2+ measurements in Nalm-6 (h) and RS4;11 (i) cells stimulated with 125 nM Dex in Ca2+-containing buffer (4 mM Ca2+). Cells were preincubated with SPK-601, and either Manoalide (h) or Edelfosine (i) during Fura-2 loading before stimulation. All inhibitors are used at 10 µM. j Maximal cytosolic Ca2+ entry from (h, i). Data are mean ± SEM (n = 3 independent experiments). Exact P-values from two-way ANOVA with Sidak’s multiple comparisons test were as follows: Nalm-6: Ctr vs. U73122, p = 0.0491; Ctr vs. Edelfosine, p = 0.0024; Ctr vs. 3-Nitrocoumarin, p = 0.0014; Ctr vs. SPK-601, p = 0.0005; Ctr vs. D609, p = 0.0002; Ctr vs. Manoalide, p = 0.0003. RS4;11: Ctr vs. U73122, p < 0.0001; Ctr vs. Edelfosine, p < 0.0001; Ctr vs. 3-Nitrocoumarin, p < 0.0001; Ctr vs. SPK-601, p < 0.0001; Ctr vs. D609, p = 0.0002; Ctr vs. Manoalide, p < 0.0001. k, l Traces of ER Ca2+ release in Nalm-6 (k) and RS4;11 (l) cells stimulated with 125 nM Dex in Ca2+-free buffer (0 mM Ca2+). Cells were preincubated with either 10 µM Edelfosine (k) or 10 µM 3-Nitrocoumarin (l) during Fura-2 loading before stimulation. m Maximal ER Ca2+ release from (k, l). Data are mean ± SEM (n = 3 independent experiments). Exact P-values from two-way ANOVA with Sidak’s multiple comparisons test were as follows: Nalm-6: Ctr vs. U73122, p < 0.0001; Ctr vs. Edelfosine, p = 0.0004; Ctr vs. 3-Nitrocoumarin, p = <0.0001; Ctr vs. SPK-601, p = 0.0092; Ctr vs. D609, p = 0.0007; Ctr vs. Manoalide, p = 0.0006. RS4;11: Ctr vs. U73122, p = 0.0267; Ctr vs. Edelfosine, p < 0.0001; Ctr vs. 3-Nitrocoumarin, p < 0.0001; Ctr vs. SPK-601, p < 0.0001; Ctr vs. D609, p < 0.0001; Ctr vs. Manoalide, p < 0.0001. Data (in c, eg) was analyzed by two-tailed, unpaired Student’s t-test. Source data are provided as a Source Data file.
Fig. 5
Fig. 5. PLC Inhibition enhances Dex sensitivity in ALL cell lines and overcomes Dex resistance in Dex-resistant cells.
a, b Nalm-6 (a) and RS4;11 (b) cells treated with Dex, U73122, Edelfosine, 3-Nitrocoumarin, SPK-601, D609, and Manoalide alone or in combination. Cell mortality was determined by CCk-8 staining after 48 h of treatment. Data shown are the mean ± SEM of n = 3 (in a) and n = 3 (in b) independent experiments. Two-tailed, unpaired Student’s t-test. c Nalm-6 cells treated with 100 nM Dex and 1 µM U73122 alone or in combination for 48 h. Alive and dead cells were determined by LIVE/DEAD® staining Kits using flow cytometry. d Quantification of alive and dead cell populations from (c). The percentage of cells was established after normalizing cells on Ctr cells. Mean ± SEM (n = 3 independent experiments), two-tailed, unpaired Student’s t-test. e Nalm-6 cells treated with 100 nM Dex and 1 µM U73122 alone or in combination for 48 h. Cell mortality was determined by flow cytometry after annexin V/PI staining. f Quantification of total apoptotic cell populations from (e). Data are mean ± SEM (n = 3 independent experiments). Two-tailed, unpaired Student’s t-test. g Cell viability of Dex-resistant primary diagnostic ALL blood (n = 16 patients) and bone marrow (n = 21 patients) samples exposed to 100 nM Dex and/or 1 μM U73122 for 24 h, normalized to Ctr condition. Data are mean ± SD. Two-tailed, unpaired Student’s t-test. h, i Cell cycle analysis of Nalm-6 cells cells after stimulation with 100 nM Dex and/or 1 μM U73122 for 72 h. Cell cycle distribution (h) and subG1 quantification (i) were determined by PI staining followed by FACS analysis (n = 3 technical replicate). Two-tailed, unpaired Student’s t-test. j, k Proliferation in Nalm-6 cells in the presence of 100 nM Dex and/or 1 μM U73122 for 3 days. Flow cytometry analysis showing CellTrace Violet (CTV) dilution (j) and proliferation quantification (k). Data are mean ± SEM (n = 3 independent experiments in k). Two-tailed, unpaired Student’s t-test. l GSEA of RNA-Seq data showing enrichment in the cellular response to Dex stimulus comparing the transcriptome of Dex-resistant Nalm-6 cells treated with U73122 or Ctr (n = 2 biological replicates). See Supplementary Fig. 11c for differentially expressed gene profiles of cellular response to Dex stimulus-related genes. Source data are provided as a Source Data file.
Fig. 6
Fig. 6. Dex activates PLC/Ca2+ axis pathway in ALL cells through CXCR4.
a Venn diagram depicting the overlap between genes strongly correlated (r > 0.5) with PLCγ2 in the MILE dataset versus Ca2+ mediated signaling genes in GO biological processes. b Distribution of all MILE dataset genes based on their co-expression coefficient (Pearson’s r) relative to PLCγ2. Genes linked to Ca2+ mediated signaling highlighted in red are significantly enriched among the co-expressed genes. c Heatmap showing expression profiles of overlapping genes from (a) in different B-ALL cell lines. Data extracted from the cancer cell line encyclopedia (CCLE). d CXCR4 mRNA ranked by expression level in B-ALL and other human tumors. Data extracted from the CCLE. Numbers refer to cancer cell types with hematological malignancies depicted in red (see Supplementary Fig. 15a). Boxplots show the mean, median, and 75th to 25th percentiles. e Averaged cytosolic Ca2+ measurements in Nalm-6 cells stimulated with 125 nM Dex with or without AMD3465. Data are mean ± SEM from (n  =  6 for Ctr and n = 3 for antagonist; n-values correspond to independent experiments). f Quantification of maximal Ca2+ entry of Nalm-6 cells stimulated with 125 nM Dex in the absence or presence of different CXCR4 antagonists. Data are the mean ± SEM from (n = 6 for Ctr, n = 4 for WZ811, and n = 3 for AMD3465 and AMD3100; n-values correspond to independent experiments). ****p < 0.0001. g Representative flow cytometry plots of CXCR4 surface expression in Nalm-6 cells transfected with small interfering RNA Ctr (siCtr) or siCXCR4. h Representative cytosolic Ca2+ measurements in Nalm-6 cells transfected with either siCtr or siCXCR4 then stimulated with 125 nM Dex in nominally Ca2+-containing buffer (2 mM Ca2+). i Quantification of maximal Ca2+ entry from (h). Data are mean ± SEM (n = 3 independent experiments, p = 0.0209). j Cytosolic Ca2+ measurements in Nalm-6 cells transduced with either CRISPR-Ctr or CRISPR-Cxcr4 then stimulated with 100 nM SDF-1α in nominally Ca2+-containing buffer (4 mM Ca2+). k Quantification of maximal Ca2+ entry from (j). Data are mean ± SEM (n = 5 independent experiments). ****p < 0.0001. l Cytosolic Ca2+ measurements in Nalm-6 cells transduced with either CRISPR-Ctr or CRISPR-Cxcr4 then stimulated with 125 nM Dex in nominally Ca2+-containing buffer (4 mM Ca2+). m Quantification of maximal Ca2+ entry from (l). Data are mean ± SEM (n = 5 independent experiments). ****p < 0.0001. n, o Representative flow cytometry plots of the active form of PLCγ2 (phospho-PLCγ2 (Tyr759)) induced by 125 nM Dex in Nalm-6 cells transfected with either CRISPR-Ctr or CRISPR-Cxcr4 (n) and in Nalm-6 cells in the absence or presence of AMD3465 (o). p, r Representative flow cytometry plots of CXCR4 surface expression of Nalm-6 cells stimulated with 125 nM Dex for 5 min at 37 °C. q, s Quantification of CXCR4 MFI from (p, r), respectively. Data normalized to Ctr are mean ± SEM (n = 3 independent experiments). t Nalm-6 cells were stimulated in a culture medium with either 100 nM Dex, 100 nM SDF-1α or medium alone. Cells were either transferred immediately on ice (T = 0) or after incubation for 1 or 2 h at 37 °C (T = 1 or 2 h) before staining with anti-human CXCR4 mAb. Values represent the percentage of staining, 100% corresponding to unstimulated cells processed in parallel. Data shown are the mean ± SEM (n = 2 for Dex, n = 3 for SDF-1α independent experiments). u Representative flow cytometry plots of CXCR4 surface expression of Nalm-6 cells stimulated with 125 nM Dex for 24 h. v Cytosolic Ca2+ measurements in Nalm-6 cells stimulated with 125 nM Dex and 100 nM SDF-1α in buffer containing 4 mM Ca2+. Data are mean ± SEM (n = 3 independent experiments). w Quantification of maximal Ca2+ entry from (v). Data represent the mean ± SEM (n = 7 independent experiments, performed in duplicates). All statistical significance was analyzed by two-tailed, unpaired Student’s t-test. *p < 0.05, and ****p < 0.0001. Source data are provided as a Source Data file.
Fig. 7
Fig. 7. CXCR4 inhibition enhances Dex sensitivity in ALL cell lines in vitro and ex vivo.
a CXCR4 shRNA ranked by Achilles score level in B-ALL and other human tumors. Data were extracted from the CCLE. Numbers refer to cancer cell types (see Supplementary Fig. 20a) among which hematological malignancies are depicted in red. Boxplots show the mean, median, and 75th–25th percentiles. b Nalm-6 cells were treated with Dex in combination with different CXCR4 inhibitors. Cell mortality was determined by CCk-8 staining after 48 h. The percentage of dead cells was established after normalizing cells on Ctr cells. Data shown are the mean ± SEM (n = 4 independent experiments). Two-tailed, unpaired Student’s t-test. c, e Cell mortality of CRISPR/Cas9 CXCR4-invalidated RS4,11 and Nalm-6 cells treated with Dex (nM) for 48 h determined by flow cytometry after annexin V/PI staining. The percentage of early and late apoptotic cells was calculated by the percentage of annexin V-FITC positive and annexin V-FITC positive plus annexin V-FITC/PI-positive population, respectively. Data are the mean ± SEM (n = 4 independent experiments). Two-tailed, unpaired Student’s t-test. c ****p < 0.0001, **p = 0.0027 (early); ***p = 0.0004, **p = 0.0069 (late). e ****p < 0.0001, ***p = 0.0005 (late). d, f Representative flow cytometry plots from (c, e). g Viability of blood (n = 16 patients) and bone marrow (n = 21 patients) cells from 37 Dex-resistant primary diagnostic ALL patient samples (see Supplementary Fig. 10b) exposed to 100 nM Dex and/or 25 μM AMD3100 for 24 h, normalized to Ctr condition, Statistical significance was determined by two-tailed, unpaired Student’s t-test. Data are the mean ± SD. *p = 0.0136 (blood), **p = 0.0095 (bone marrow). The experiment was carried out under the same conditions as in Supplementary Fig. 10b. h Cell cycle analysis of Nalm-6 cells after stimulation with 100 nM Dex and/or 25 μM AMD3100 for 48 h. Cell cycle distribution determined by flow cytometry after PI staining. Statistical significance was determined by two-tailed, unpaired Student’s t-test. *p < 0.05, **p < 0.01, ***p < 0.001 and ****p < 0.0001. Source data are provided as a Source Data file.
Fig. 8
Fig. 8. CXCR4/PLC inhibition improves survival of Dex-treated NSG mice in vivo.
a Experimental design of NSG mice treatment experiments. BLI bioluminescence imaging. b Flow cytometry Ca2+ assessment in Nalm-6 GFP+ cells in the blood at day 27. c Kaplan–Meier survival analysis of mice transplanted with Nalm-6 GFP-luc cells and treated with Ctr (n = 4), Dex (n = 6), AMD3465 (n = 4), or a combination of Dex and AMD3465 (n = 6), n-values correspond to individual mice. Statistical significance was calculated with the Log-rank (Mantel-Cox) test. d An example of bioluminescence imaging of Nalm-6 GFP/luc at day 25 of tumor challenge from (c). e Experimental design of NSG mice treatment experiments using Dex-resistant B-ALL models. BLI bioluminescence imaging. f Kaplan–Meier survival analysis of mice transplanted with resistant (R) Nalm-6 GFP-luc cells and treated with Ctr (n = 4), Dex (n = 5), AMD3465 (n = 4), U73122 (n = 4) or a combination of Dex and AMD3465 (n = 5) or and U73122 (n = 6), n-values correspond to individual mice. Statistical significance was calculated with the Log-rank (Mantel-Cox) test. g An example of bioluminescence imaging of Nalm-6 R GFP/luc at day 19 of tumor challenge from (f). h Averaged of the median survival over time is shown for the different treatment groups from (f). Data are the mean ± SEM from (n = 4 for Ctr, AMD3465, U73122; n = 5 for Dex and Dex+AMD and n = 6 for Dex+U73122; n-values correspond to individual mice). Boxplots show the mean, median, and 75th–25th percentiles. i Kaplan–Meier survival analysis of mice transplanted with resistant RCH-ACV cells and treated with Ctr (n = 4), Dex (n = 4), AMD3465 (n = 4), U73122 (n = 4) or a combination of Dex and AMD3465 (n = 5) or and U73122 (n = 5). Statistical significance was calculated with the Log-rank (Mantel-Cox) test. Source data are provided as a Source Data file.

References

    1. Conter V, et al. EDUCATIONAL REPORT Long-term results of the Italian Association of Pediatric Hematology and Oncology (AIEOP) Studies 82, 87, 88, 91 and 95 for childhood acute lymphoblastic leukemia. Leukemia. 2010;24:255–264. doi: 10.1038/leu.2009.250. - DOI - PubMed
    1. Hefazi M, Litzow MR. Recent advances in the biology and treatment of B-cell acute lymphoblastic leukemia. Blood Lymphat. Cancer Targets Ther. 2018;8:47–61. doi: 10.2147/BLCTT.S170351. - DOI - PMC - PubMed
    1. Serafin V, et al. Glucocorticoid resistance is reverted by LCK inhibition in pediatric T-cell acute lymphoblastic leukemia. Blood. 2017;130:2750–2761. doi: 10.1182/blood-2017-05-784603. - DOI - PubMed
    1. Irving JAE. Towards an understanding of the biology and targeted treatment of paediatric relapsed acute lymphoblastic leukaemia. Br. J. Haematol. 2016;172:655–666. doi: 10.1111/bjh.13852. - DOI - PubMed
    1. Lauten M, et al. Prediction of outcome by early bone marrow response in childhood acute lymphoblastic leukemia treated in the ALL-BFM 95 trial: differential effects in precursor B-cell and T-cell leukemia. Haematologica. 2012;97:1048–1056. doi: 10.3324/haematol.2011.047613. - DOI - PMC - PubMed

MeSH terms