. 2024 May 29;15(5):376.
doi: 10.1038/s41419-024-06759-7.

The enhanced energy metabolism in the tumor margin mediated by RRAD promotes the progression of oral squamous cell carcinoma

Affiliations

The enhanced energy metabolism in the tumor margin mediated by RRAD promotes the progression of oral squamous cell carcinoma

Aoming Cheng et al. Cell Death Dis. .

Abstract

The tumor margin as the invasive front has been proven to be closely related to the progression and metastasis of oral squamous cell carcinoma (OSCC). However, how tumor cells in the marginal region obtain the extra energy needed for tumor progression is still unknown. Here, we used spatial metabolomics and the spatial transcriptome to identify enhanced energy metabolism in the tumor margin of OSCC and identified that the downregulation of Ras-related glycolysis inhibitor and calcium channel regulator (RRAD) in tumor cells mediated this process. The absence of RRAD enhanced the ingestion of glucose and malignant behaviors of tumor cells both in vivo and in vitro. Mechanically, the downregulation of RRAD promoted the internal flow of Ca2+ and elevated its concentration in the nucleus, which resulted in the activation of the CAMKIV-CREB1 axis to induce the transcription of the glucose transporter GLUT3. GLUT inhibitor-1, as an inhibitor of GLUT3, could suppress this vigorous energy metabolism and malignant behaviors caused by the downregulation of RRAD. Taken together, our study revealed that enhanced energy metabolism in the tumor margin mediated by RRAD promotes the progression of OSCC and proved that GLUT3 is a potential target for future treatment of OSCC.


Conflict of interest statement

The authors declare no competing interests.

Figures

Fig. 1
Fig. 1. Energy status of tumor margin in OSCC is upregulation and correlates with low expression of RRAD.
A H&E stain image of patient with advanced OSCC, divided into different areas guided by pathology experts. Scale bar: 1000 μm. B Visual cluster map of global metabolite expression levels. C Uniform Manifold Approximation and Projection for Dimension Reduction (UMAP) of different clusters. D MS images of representative energy-related metabolites in OSCC tissues (intensity in color scale is relative value). Scale bar: 500 μm. E KEGG pathway enrichment analysis based on differential metabolites in tumor margin. F DSP analysis was performed in FFPEs of OSCC patients, ROIs were separately selected from tumor center and tumor margin. Scale bars: 500 μm and 100 μm. G Volcano Plot of DEGs between tumor center and margin, RRAD was downregulated in tumor margin. H Relative RRAD mRNA expression was detected in OSCC cell lines, normal oral mucosa. *P < 0.05, ***P < 0.001. I Representative IHC images of RRAD correlation with tumor status. Scale bar: 200 μm. J Survival analysis was performed in the OSCC dataset from the TCGA database. The correlation between RRAD expression and overall survival. K Relative RRAD mRNA expression in tumor and normal tissue based on OSCC dataset from the TCGA database. *P < 0.05.
Fig. 2
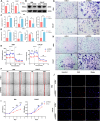
Fig. 2. Low expression of RRAD promotes energy status and malignant progression in OSCC cell lines.
A, B Transfection efficiency was detected using PCR and Western blot after RRAD-specific siRNA transfection for 48 h in HN4 and CAL27 cells. **P < 0.01. C, D Intracellular Ca2+ concentration, glucose uptake ability, lactate production and ADP:ATP ratio were detected after silencing RRAD in HN4 and CAL27 cell lines. *P < 0.05, **P < 0.01. E The real-time ECAR was analyzed by the Seahorse method after silencing RRAD. **P < 0.01. F A wound-healing assay was conducted to detect the migration ability of OSCC cells after silencing RRAD. Scale bar: 250 µm. G, H Migration and invasion abilities were studied using a Transwell assay after silencing RRAD in HN4 and CAL27 cells. Scale bar: 250 µm. I, J The CCK-8 and EdU assays were performed to detect proliferation ability after silencing RRAD in HN4 and CAL27 cells. Scale bar: 250 µm, *P < 0.05, **P < 0.01, ***P < 0.001.
Fig. 3
Fig. 3. GLUT3 is key downstream of low expression of RRAD.
A, B Transfection efficiency was detected using PCR and Western blot after RRAD-specific shRNA transfection in HN4 cells. ***P < 0.001. C, D Representative images of tumors derived from the xenograft model were shown. E Tumor weight was measured after excision from mice. **P < 0.01. F The tumor volume was measured and analyzed once a week. *P < 0.05, **P < 0.01. G IHC staining for RRAD was conducted on xenograft tumors. Scale bar: 200 μm. H The heatmap of DEGs of si-Scr vs. si-RRAD. I The GO enrichment based on DEGs of si-Scr vs. si-RRAD. J The relative SLC2A1, SLC2A2, SLC2A3, and SLC2A4 mRNA levels of HN4 and CAL27 cell lines. **P < 0.01. K GLUT1, GLUT2, GLUT3, and GLUT4 were detected after silencing RRAD in HN4 and CAL27 cell lines. L Survival analysis was performed in the OSCC dataset from the TCGA database. The correlation between SLC2A1, SLC2A2, SLC2A3, and SLC2A4 expression and overall survival.
Fig. 4
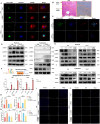
Fig. 4. The low expression of RRAD increased nuclear Ca2+ level and upregulated GLUT3 by activating the CAMKIV-CREB1 axis.
A Intracellular and nuclear Ca2+ distribution after silencing RRAD in OSCC cells. Scale bar: 50 μm. B H&E and IHC stain images of patients with advanced OSCC, dividing into different areas guided by pathology experts for further cell separation. Scale bar: 500 μm. C Intracellular Ca2+ concentration in OSCC cells derived from tumor center and tumor margin. Scale bar: 250 μm. D CAMKIV, p-CAMKIV, CREB1, and p-CREB1 were respectively detected in nuclear and cytoplasm, RRAD, GLUT3 in cytoplasm were detected with western blot after silencing RRAD. E CAMKIV, p-CAMKIV, CREB1, and p-CREB1 were detected in nuclear and RRAD, GLUT3 in cytoplasm was detected with Western blot after RRAD-specific and CAMKIV-specific siRNA transfection. F ChIP-qPCR analysis of CREB1 binding on the known site in the SLC2A3 promoter region in HN4 and CAL27 cells. ***P < 0.001. G, H Glucose uptake ability and ADP:ATP ratio were measured after RRAD-specific and CAMKIV-specific siRNA transfection in OSCC cells. **P < 0.01, ***P < 0.001. I, J EdU assay was performed to detect proliferation ability after RRAD-specific and CAMKIV-specific siRNA transfection. Scale bar: 250 μm.
Fig. 5
Fig. 5. GLUT inhibitor-1 counteracted the vigorous metabolic level and malignant progression of OSCC cells mediated by GLUT3 upregulation.
A, B Intracellular Ca2+ concentration, glucose uptake ability and ADP:ATP ratio were detected in OSCC cells treated with 200 nM GLUT inhibitor-1 for 24 h. *P < 0.05, **P < 0.01, ***P < 0.001. C The real-time ECAR was analyzed by the Seahorse method in OSCC cells treated with 200 nM GLUT inhibitor-1. **P < 0.01, ***P < 0.001. D, E A wound-healing assay was performed to detect the migration ability of OSCC cells treated with 200 nM GLUT inhibitor-1. Scale bar: 250 μm. F, G Migration and invasion abilities were studied using a Transwell assay after treating with 200 nM GLUT inhibitor-1. Scale bar: 250 μm. H, I EdU assay was performed to detect proliferation ability after treating with 200 nM GLUT inhibitor-1 Scale bar: 250 μm.
Fig. 6
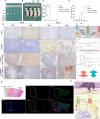
Fig. 6. RRAD expression negatively correlated with GLUT3 in OSCC tissues.
A, B Representative images of tumors derived from the xenograft model were shown. C Tumor weight was measured after excision from mice. **P < 0.01. D The tumor volume was measured and analyzed once a week. *P < 0.05, ** P < 0.01. E IHC staining for RRAD and GLUT3 was conducted on xenograft tumors. Scale bar: 500 μm and 250 μm. F Construction of risk model based on OSCC dataset from the TCGA database. Survival analysis based on RRAD and GLUT3 mRNA level. And the condition of lymph node metastases of patients with different risk levels. G H&E stain and multiplex immunofluorescence of the primary lesion tissue, including tumor margin and tumor center. Scale bar: 1000 μm. H A schematic diagram shows that low expression of RRAD in the tumor margin increased intracellular and nuclear Ca2+ concentration and upregulated GLUT3 by activating CAMKIV-CREB1 axis, which improved the energy status of OSCC cells in the tumor margin to lead progression.

Similar articles

Cited by

References

    1. Cheng A, Wang Z, Yuan X, Liu H, Cao W, Wei W, et al. Development and validation of a nomogram for the prediction of lymph node metastasis within 2-year postoperatively in cT1-T2N0 oral squamous cell carcinoma. Head Neck. 2023;45:103–14. doi: 10.1002/hed.27215. - DOI - PubMed
    1. Sun L, Zhang H, Gao P. Metabolic reprogramming and epigenetic modifications on the path to cancer. Protein Cell. 2022;13:877–919. doi: 10.1007/s13238-021-00846-7. - DOI - PMC - PubMed
    1. Lewinsohn MA, Bedford T, Müller NF, Feder AF. State-dependent evolutionary models reveal modes of solid tumour growth. Nat Ecol Evol. 2023;7:581–96. doi: 10.1038/s41559-023-02000-4. - DOI - PMC - PubMed
    1. He JZ, Chen Y, Zeng FM, Huang QF, Zhang HF, Wang SH. Spatial analysis of stromal signatures identifies invasive front carcinoma-associated fibroblasts as suppressors of anti-tumor immune response in esophageal cancer. J Exp Clin Cancer Res. 2023;42:136. doi: 10.1186/s13046-023-02697-y. - DOI - PMC - PubMed
    1. Planque M, Igelmann S, Ferreira Campos AM, Fendt SM. Spatial metabolomics principles and application to cancer research. Curr Opin Chem Biol. 2023;76:102362. doi: 10.1016/j.cbpa.2023.102362. - DOI - PubMed

Publication types