. 2024 May 29;15(1):4528.
doi: 10.1038/s41467-024-48317-x.

Liver and pancreatic-targeted interleukin-22 as a therapeutic for metabolic dysfunction-associated steatohepatitis

Affiliations

Liver and pancreatic-targeted interleukin-22 as a therapeutic for metabolic dysfunction-associated steatohepatitis

Haressh Sajiir et al. Nat Commun. .

Abstract

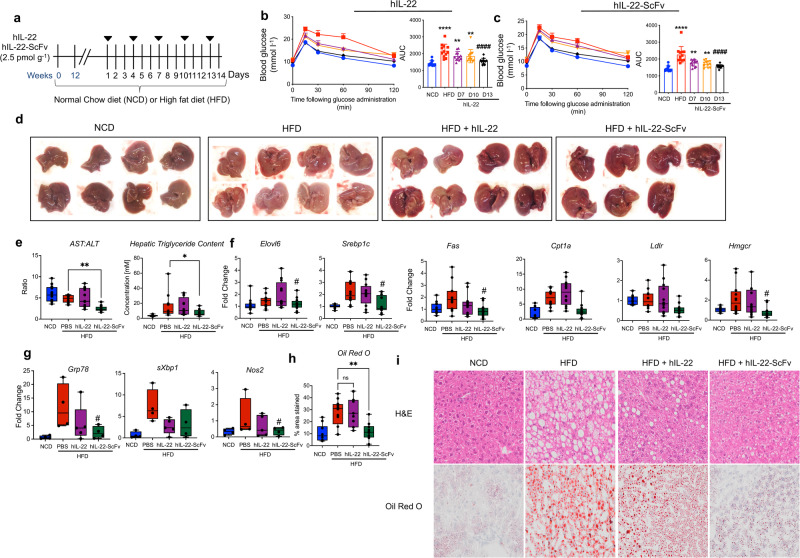
Metabolic dysfunction-associated steatohepatitis (MASH) is the most prevalent cause of liver disease worldwide, with a single approved therapeutic. Previous research has shown that interleukin-22 (IL-22) can suppress β-cell stress, reduce local islet inflammation, restore appropriate insulin production, reverse hyperglycemia, and ameliorate insulin resistance in preclinical models of diabetes. In clinical trials long-acting forms of IL-22 have led to increased proliferation in the skin and intestine, where the IL-22RA1 receptor is highly expressed. To maximise beneficial effects whilst reducing the risk of epithelial proliferation and cancer, we designed short-acting IL-22-bispecific biologic drugs that successfully targeted the liver and pancreas. Here we show 10-fold lower doses of these bispecific biologics exceed the beneficial effects of native IL-22 in multiple preclinical models of MASH, without off-target effects. Treatment restores glycemic control, markedly reduces hepatic steatosis, inflammation, and fibrogenesis. These short-acting IL-22-bispecific targeted biologics are a promising new therapeutic approach for MASH.


Conflict of interest statement

S.Z.H., M.A.M., and J.B.P. are inventors on a patent relating to IL-22 use in metabolic disease. The remaining authors declare no other competing interests.

Figures

Fig. 1
Fig. 1. Recombinant mouse IL-22 (rmIL-22) treatment reduces lipid accumulation, but extended treatment with long-acting forms can lead to hyperproliferation in the skin and intestine.
ae mice were fed a normal chow diet (NCD) or a high fat diet (HFD) for 14 weeks and treated biweekly for the last two weeks with 100 ng g−1 of recombinant mouse IL-22 (rmIL-22), i.p. Control NCD and HFD animals received PBS. a Experimental schematic. b Representative images of epididymal and subcutaneous fats stained with hematoxylin and eosin (H&E). c Average size of 100 adipocytes was measured in each section of the fat tissues. d Oil Red O staining and H&E staining of liver. e graph shows the % area stained with Oil Red O in the liver. fi C57BL/6 animals were treated with either PBS or 6, 12, 30, or 60 μg of rmIL-22-Fc daily for 8 weeks (s.c.). f Experimental schematic. g Ratio of colon weight:length as a measure of inflammation. h Quantification of epidermal thickness in μm from the un-injected and injected sites. i H&E. Ki67 and MPO staining of skin. ae n = 8 biologically independent animals, ANOVA, Bonferroni’s post hoc test. **p < 0.01 ****p < 0.0001 compared to NCD mice and ##p < 0.01 ####p < 0.0001 compared to control HFD. fi n = 4 biologically independent animals. One-way ANOVA, Bonferroni’s post hoc test. Data are presented as mean values ± SEM. *p < 0.05, ****p < 0.0001 compared to PBS-treated controls. Scale bar = 50 μm. Source data are provided as a Source Data file.
Fig. 2
Fig. 2. Human IL-22-fusion drugs can enhance targeting to pancreas and liver.
ad C57BL/6 animals were treated with native human IL-22 (hIL-22) or 3 different hIL-22-fusions at 2.5 pmol g−1, i.p and sampled 1 h post-treatment. a Experimental schematic. Phospho-Stat3 staining analyzed by confocal microscopy in (b) pancreas, (c) liver and (d) intestine, (e) quantification of fluorescence staining intensity is shown as arbitrary units. (f) mRNA expression of ER stress marker (spliced XBP1; sXBP1) and protein levels of proinsulin in human islets cultured for 24 h (controls) or treated with a N-glycosylation inhibitor (tunicamycin) in the presence of native hIL-22, ScFv-hIL-22, hIL-22-ScFv and hIL-22-GLP1 (3 pmol mL−1). ND = not detected. g Mice were fed a normal chow diet (NCD) or a high fat diet (HFD) for 14 weeks and treated biweekly for the last two weeks with native hIL-22 or hIL-22-fusions (ScFv-hIL-22, hIL-22-ScFv, hIL-22-GLP1), 2.5 pmol g−1, i.p. Control NCD and HFD animals received PBS. Fed serum proinsulin:insulin ratio on day 14 post-treatment. h Fasting blood glucose on day 7 (D7) and day 10 (D10) post-treatment. ae n = 5–6, One-way ANOVA, Bonferroni’s post hoc test. *p < 0.05, **p < 0.01, ***p < 0.001, ****p < 0.0001 compared to mice given hIL-22. f n = 4 biologically independent human islet donors (gh) n = 12 biologically independent animals. One-way ANOVA, Bonferroni’s post hoc test. #p < 0.05, ##p < 0.01 ####p < 0.0001 compared to control HFD. Source data are provided as a Source Data file.
Fig. 3
Fig. 3. Targeted IL-22 improves glucose tolerance and hepatic lipid accumulation.
a Mice were fed a normal chow diet (NCD) or a high fat diet (HFD) for 14 weeks and treated biweekly for the last two weeks with 2.5 pmol g−1 of native hIL-22 or hIL-22-ScFv, i.p. Control NCD and HFD animals received PBS. Oral glucose tolerance test on day 7, 10, 13 post-treatment of animals treated with (b) hIL-22 or (c) hIL-22-ScFv. AUC for each treatment shown. d Gross macroscopic images of the livers from NCD, HFD and HFD animals treated for 2 weeks with hIL-22 or hIL-22-ScFv. e Serum AST:ALT ratio, hepatic triglyceride content (presented as concentration) in homogenized liver (normalized to weight of liver). f Hepatic mRNA expression of genes associated with lipid biosynthesis, and (g) ER stress markers Grp78 and spliced-Xbp1 (sXbp1) and oxidative stress marker Nos2. h Quantification of Oil Red O staining shown as percentage area stained. i Hematoxylin and Eosin (H&E) and Oil Red O staining of livers 2 weeks post-treatment. n = 8 biologically independent animals for NCD, HFD/hIL-22 and HFD/hIL-22-ScFv groups, and n = 10 biologically independent animals for the HFD/PBS group. One-way ANOVA, Bonferroni’s post hoc test. Bar graphs in (b, c) are presented as mean values ± SEM. #/*p < 0.05, ##/**p < 0.01 ####/****p < 0.0001 compared to control HFD or NCD, respectively. Source data are provided as a Source Data file.
Fig. 4
Fig. 4. Murine IL-22-ScFv stops the progression of hepatic fibrosis.
a Fatty Liver RT2 Profiler PCR Array on HFD (12 weeks) and HFD animals treated with 6.25 pmol g−1 mIL-22-ScFv (2 weeks), n = 2 biologically independent animals. b Schematic showing C57BL/6 animals placed on a choline-deficient, L-amino acid-defined, high-fat diet (CDAHFD) for 6 weeks and treated biweekly with mIL-22-Fc (62.5 pmol g−1) or mIL-22-ScFv (6.25 pmol g−1) for 5 weeks. c End-point histology assessment, H&E, Oil Red O staining and gross morphology representative images. d shows the % area stained with Oil Red O, image J analyses of lipid droplet size, NAS scoring and fibrosis scores. e Sirius Red and Masson’s Trichrome staining on CDAHFD animals with and without treatment. f RT-PCR was used to confirm the improvements in fibrosis markers and inflammation. n = 6 biologically independent animals for the CDAHFD/PBS group, n = 5 biologically independent animals for the NCD, CDAHFD/mIL-22-ScFv and CDAHFD/mIL-22-Fc groups. g Obese C57BL/6 animals were placed on an HFD/TAA (regime shown in Supplementary Fig. 11e) and treated with mIL-22-Fc or mIL-22-ScFv. H&E, Sirius Red and Masson’s Trichrome staining of representative images shown. h shows the fibrosis scores. n = 3 biologically independent animals for the NCD group, n = 4 biologically independent animals for the HFD/TAA/PBS group, n = 5 biologically independent animals for the HFD/TAA/mIL-22-Fc and HFD/TAA/mIL-22-ScFv groups. One-way ANOVA, Bonferroni’s post hoc test. *p < 0.05, **p < 0.01, ***p < 0.001, ****p < 0.0001 compared to HFD control. Source data are provided as a Source Data file.
Fig. 5
Fig. 5. IL-22-ScFv acts through hepatic IL-22RA1 signaling in hepatocytes and stellate cells to provide multiple benefits in MASLD/MASH.
a Oral glucose tolerance test in animals with an IL-22ra1 β-cell specific deletion IL-22ra1β-cell−/−; animals were put on a HFD for 12 weeks and treated biweekly with 6.25 pmol g−1 mIL-22-ScFv or PBS (s.c.) for the last 2 weeks of diet. n = 14 biologically independent animals in the control group, and n = 9 biologically independent animals in the IL-22ra1β-cell−/− group. b Insulin and Proinsulin staining of pancreas, and Oil red O staining of liver in the animals in (a). c Quantitation of proinsulin:insulin ratio and Oil red O area stained. n = 8 biologically independent animals in control islet staining group, n = 9 biologically independent animals in IL-22ra1β-cell−/− islet staining group; n = 5 biologically independent animals in Oil red O staining groups. d Animals with a hepatocyte specific deletion of IL-22ra1, IL-22ra1Hep−/−, were put on a HFD for 12 weeks and treated biweekly with 6.25 pmol g−1 mIL-22-ScFv or PBS (s.c.) for the last 2 weeks of diet, liver tissue stained with Oil Red O. e Quantitation of Oil Red O area stained. n = 6 biologically independent animals in the control group, n = 3 biologically independent animals in the IL-22ra1Hep−/− group. f, g HEPG2 cells treated with Palmitate (200 µM) to induce lipid accumulation and treated with hIL-22-ScFv (300 nmol mL−1); (f) representative images and (g) mean fluorescence intensity (MFI) shows lipid accumulation using BodipyTM 493/503 (shown as fold change of BSA controls). n = 12 independent samples and (h) Mass Spectrometry and KEGG pathway analyses of differentially expressed unique proteins in lipid-containing HEPG2 cells treated with hIL-22-ScFv compared with control. n = 3 for BSA controls; n = 4 for PA-BSA ± hIL-22-ScFv. i CDAHFD animals were pulsed with a single dose of 400 pmol g−1 of mIL-22-ScFv (s.c), liver tissue stained with STAT3p and, GFAP and Reelin to identify stellate cells (white arrows); inset = z-stack. n = 4 biologically independent animals. Scale bar = 50 μm. j LX2 cells were activated using hTGF-beta and subsequently treated with 300 nmol mL−1 hIL-22-ScFv, gene expression fold change in ACTA2, COL1A3, TGFbeta2, SOCS3 compared to control. n = 3 independent samples. T-test or One-way ANOVA, Bonferroni’s post hoc test. Bar graphs in (a, c, e, g) are presented as mean values ± SEM. *p < 0.05, **p < 0.01, ***p < 0.001, ****p < 0.0001. scale bar = 100 μm. Source data are provided as a Source Data file.

References

    1. Rinella ME, et al. A multisociety Delphi consensus statement on new fatty liver disease nomenclature. Ann. Hepatol. 2023;29:101133. doi: 10.1016/j.aohep.2023.101133. - DOI - PubMed
    1. Farrell GC, Larter CZ. Nonalcoholic fatty liver disease: from steatosis to cirrhosis. Hepatology. 2006;43:S99–S112. doi: 10.1002/hep.20973. - DOI - PubMed
    1. Harrison SA, et al. A phase 3, randomized, controlled trial of resmetirom in NASH with liver fibrosis. N. Engl. J. Med. 2024;390:497–509. doi: 10.1056/NEJMoa2309000. - DOI - PubMed
    1. Vuppalanchi R, Noureddin M, Alkhouri N, Sanyal AJ. Therapeutic pipeline in nonalcoholic steatohepatitis. Nat. Rev. Gastroenterol. Hepatol. 2021;18:373–392. doi: 10.1038/s41575-020-00408-y. - DOI - PubMed
    1. Hasnain SZ, et al. Glycemic control in diabetes is restored by therapeutic manipulation of cytokines that regulate beta cell stress. Nat. Med. 2014;20:1417–1426. doi: 10.1038/nm.3705. - DOI - PubMed

LinkOut - more resources