. 2024 May 29;15(1):4571.
doi: 10.1038/s41467-024-48784-2.

Stochasticity, determinism, and contingency shape genome evolution of endosymbiotic bacteria

Affiliations

Stochasticity, determinism, and contingency shape genome evolution of endosymbiotic bacteria

Bret M Boyd et al. Nat Commun. .

Abstract

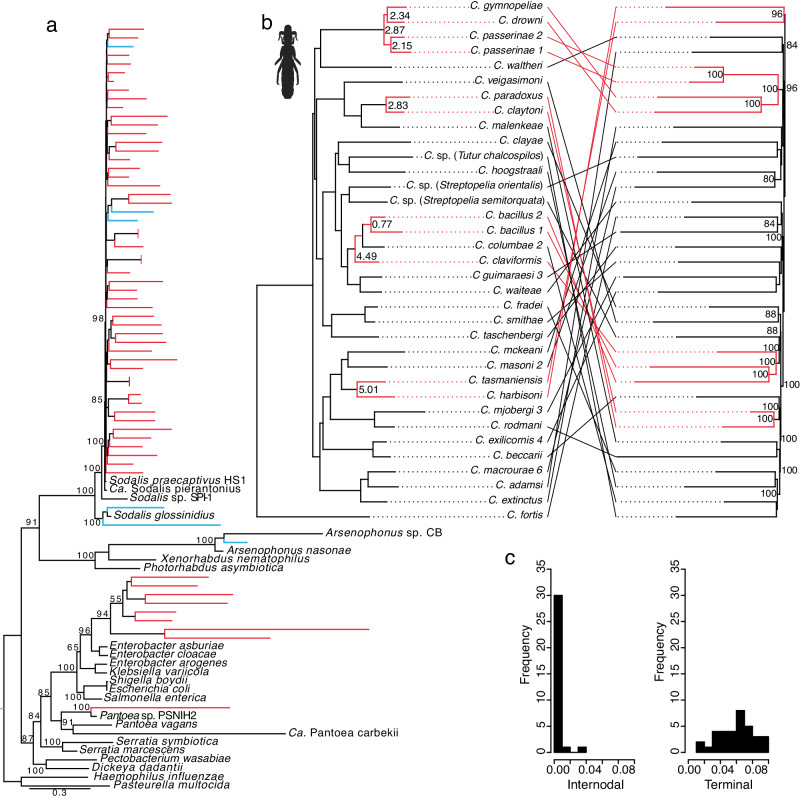
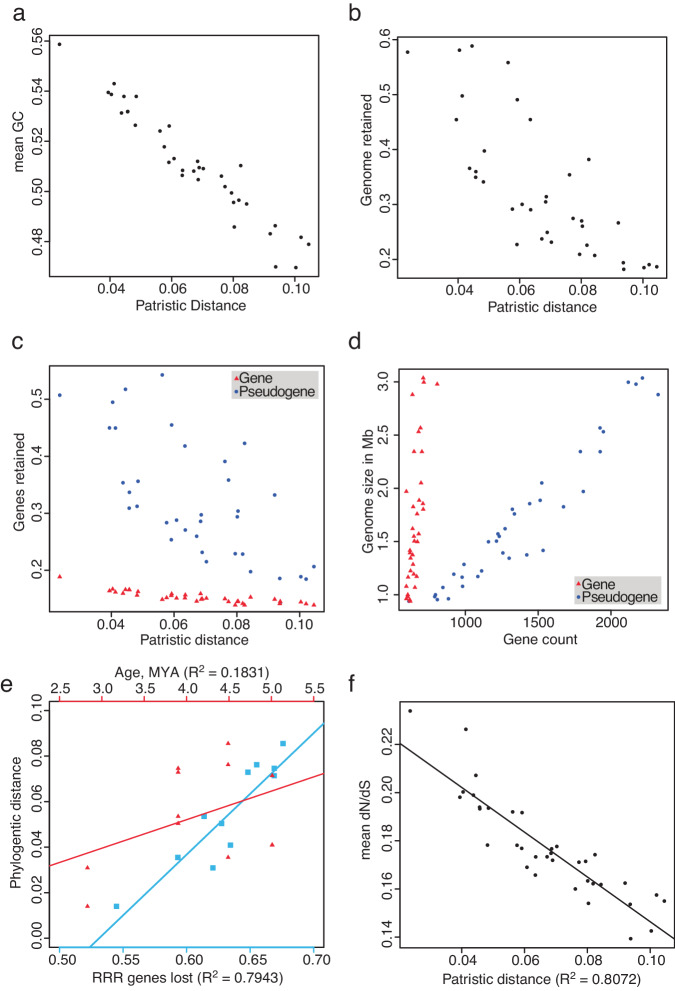
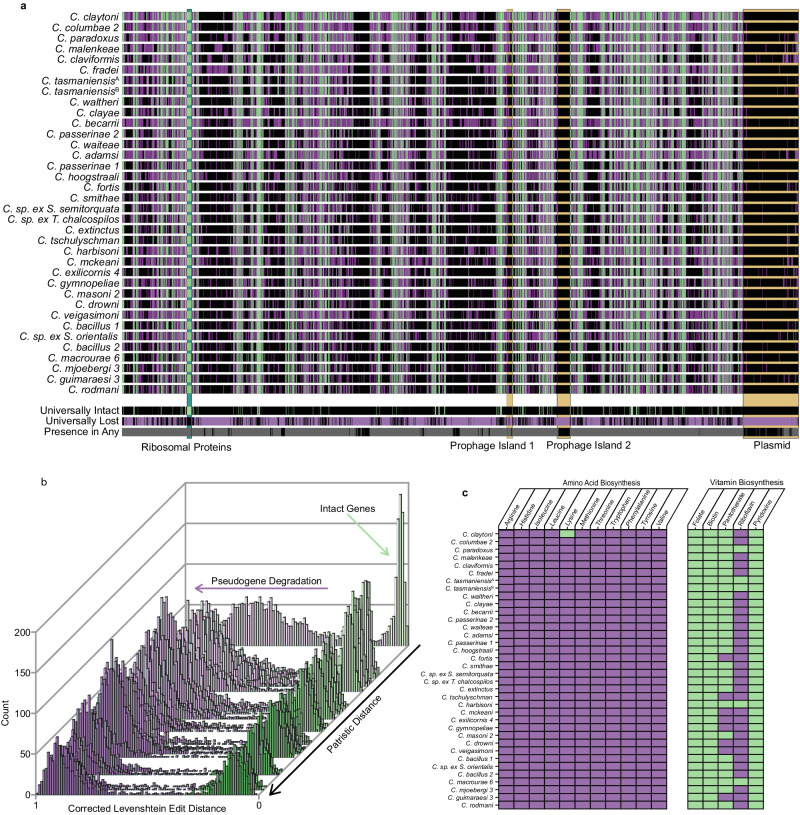
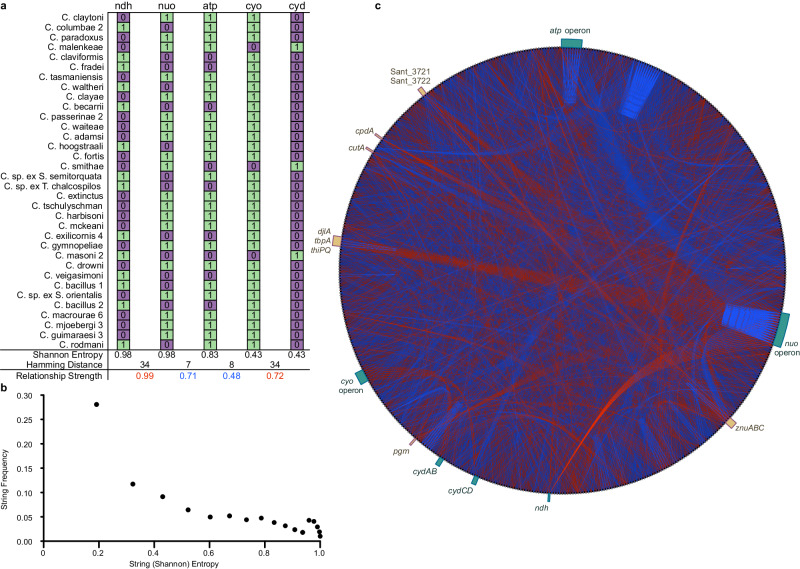
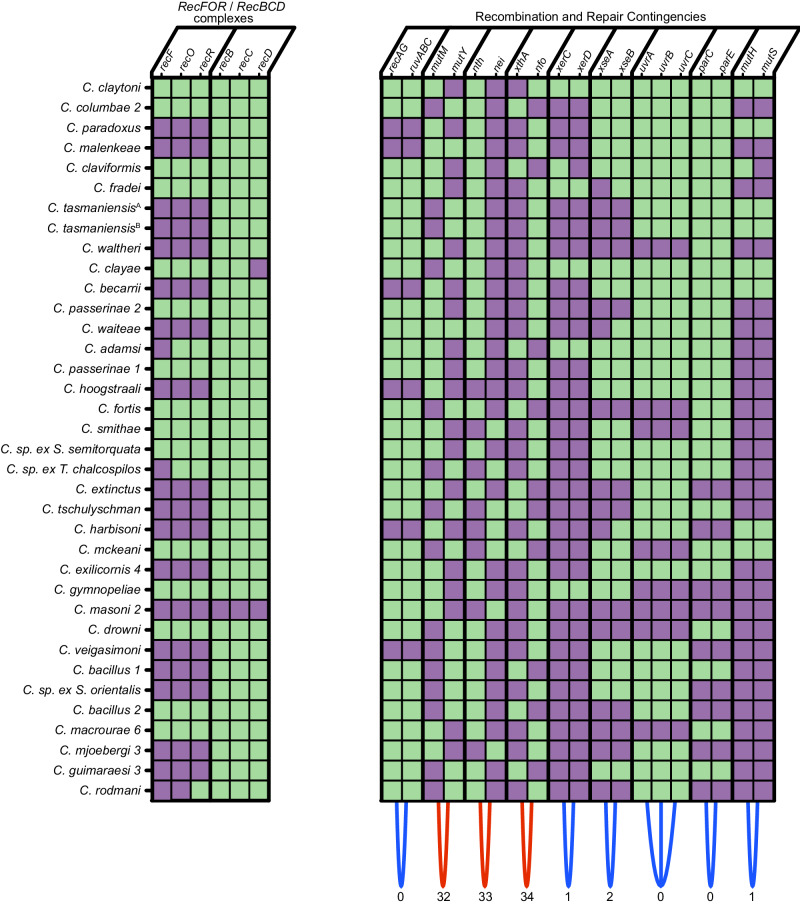
Evolution results from the interaction of stochastic and deterministic processes that create a web of historical contingency, shaping gene content and organismal function. To understand the scope of this interaction, we examine the relative contributions of stochasticity, determinism, and contingency in shaping gene inactivation in 34 lineages of endosymbiotic bacteria, Sodalis, found in parasitic lice, Columbicola, that are independently undergoing genome degeneration. Here we show that the process of genome degeneration in this system is largely deterministic: genes involved in amino acid biosynthesis are lost while those involved in providing B-vitamins to the host are retained. In contrast, many genes encoding redundant functions, including components of the respiratory chain and DNA repair pathways, are subject to stochastic loss, yielding historical contingencies that constrain subsequent losses. Thus, while selection results in functional convergence between symbiont lineages, stochastic mutations initiate distinct evolutionary trajectories, generating diverse gene inventories that lack the functional redundancy typically found in free-living relatives.


Conflict of interest statement

The authors declare no competing interests.

Figures

Fig. 1
Fig. 1. Phylogenetic reconstructions showing relationships of louse endosymbionts to other bacteria and comparisons to the evolutionary history of host species.
a Maximum-likelihood phylogeny of louse endosymbionts and representative Enterobacterales based on 13 single copy orthologs. Red tips indicate endosymbionts from Columbicola species and blue tips indicate endosymbionts from feather-feeding lice not belonging to the genus Columbicola. Numbers at nodes indicate bootstrap support. Branch length to the root has been shortened and some node and tip labels have been omitted to facilitate presentation. b Tanglegram comparing a phylogeny of Columbicola lice (left) with the phylogeny of their louse endosymbionts (right). Louse tree is a maximum-likelihood phylogeny based on 977 loci. Numbers at nodes of louse tree indicate species divergence times in millions of years before present for predicted host-endosymbiont cospeciation events (dates ranged from 1.74-3.22 or 2.83-5.01 million years ago, depending on the phylogenetic calibrations employed; latter age range shown). Endosymbiont tree is a maximum-likelihood phylogeny of endosymbionts closely related to S. praecaptivus and is based on 297 universally conserved single copy orthologs. Numbers at nodes of endosymbiont tree indicate bootstrap support >80%. Red branches and connecting bars indicate louse-endosymbiont cospeciation events. Statistical comparisons of louse endosymbiont trees showed they were not more similar than would be expected by chance (ParaFit Global Fit = 0.02, P = 0.24, based on 999 randomizations of host-parasite associations; JANE Cost=126). c Histograms showing frequency of branch lengths (internodal, left and terminal, right) from the endosymbiont tree presented in panel b right-hand side. Abbreviations: Ca. = Candidatus, C. = Columbicola, sp. = species. Source data are provided as a Source Data file.
Fig. 2
Fig. 2. Comparison of evolutionary distances and genomic features in endosymbionts, and comparisons of genome features.
a Mean fraction of GC bases in 297 universally conserved orthologs in endosymbiont compared to patristic distance separating the endosymbiont from S. praecaptivus. b Fraction of the genome of S. praecaptivus recovered in endosymbionts (total length of the aligned reads / total length of the S. praecpativus genome) compared to patristic distance separating the endosymbiont from S. praecaptivus. c Fraction of genes found in S. praecaptivus discovered in endosymbionts (either intact or as a pseudogene) compared to patristic distance separating the endosymbiont from S. praecaptivus. d Genome length compared to gene content in endosymbionts. e Fraction of replication, repair, and recombination genes found in S. praecaptivus discovered in endosymbionts derived from louse-endosymbiont cospeciation events (x-axis, red, tics at top of plot) and time since cospeciation events in millions of years (x-axis, blue, tics at base of plot), compared with phylogenetic distance (y-axis). f Mean dN/dS for 297 single copy orthologs universally conserved in S. praecaptivus and closely related louse endosymbionts compared to patristic distance separating the endosymbiont from S. praecaptivus. In ac and f patristic distances on x-axis are defined as the distance between an endosymbiont and S. praecaptivus in the tree illustrated in Fig. 1b. In e, phylogenetic distance is defined as the patristic distance between the endosymbiont tip and the node from which all endosymbionts diverge. Abbreviations: MYA = million years ago, RRR = repair, replication, and recombination. Source data are provided as a Source Data file.
Fig. 3
Fig. 3. Reduced gene inventories and functions in Columbicola endosymbionts.
a Matrix displaying endosymbiont gene inventories mapped to S. praecaptivus chromosome and plasmid arranged in order of patristic distance (from top) showing intact genes in green, pseudogenes in purple and missing genes in black. Summary information, derived from all 36 individual louse endosymbionts, is presented in the lower three rows, comprising universally intact genes (top; green), genes universally lost (middle; purple) and genes that are present, at least fractionally, in any endosymbiont (gray; bottom). b Histogram showing the numbers of genes with given corrected Levenshtein Edit Distances (cLEDs) among the 36 endosymbionts arranged in accordance with patristic distance from S. praecaptivus (back to front). Genes predicted to be intact are shown in green and those predicted to be pseudogenes are shown in purple. Note that as patristic distance increases, the cLEDs of pseudogenes are observed to increase, consistent with increased levels of deletion. c Predicted status of amino acid and B vitamin biosynthesis pathways. Pathways describing amino acid biosynthetic enzymes are annotated as intact (green) only if genes encoding all biosynthetic steps are predicted to be intact in the respective symbiont genome. Pathways describing B-vitamin biosynthesis are annotated as intact (green) if genes encoding all biosynthetic steps are intact in the respective symbiont genome and/or present in a representative (C. columbae) host sequence. Note that in panels a and c, C. tasmaniensisA and C. tasmaniensisB are endosymbionts of lice obtained from closely related dove species: Phaps chalcopteraA and P. elegansB. Abbreviations: C. = Columbicola, sp. = species, ex. = isolated from. Source data are provided as a Source Data file.
Fig. 4
Fig. 4. Identification of genes with direct and reciprocal retention patterns among the louse endosymbionts.
a Matrix depicting functional status of genes encoding respiratory chain components (1/green = functional, 0/purple = pseudogene or absent) in each louse endosymbiont. Binary strings derived from each gene are analyzed to determine string (Shannon) entropy (E) and Hamming distances (H) between strings leading to derivation of relationship strength as 0.5E+0.517(H17)2 (see Supplementary Materials). b Plot depicting frequencies of strings with different string (Shannon) entropies, showing that low entropy strings are overrepresented in the dataset. c Circle plot showing relationships between genes that are fractionally retained among the louse endosymbionts, highlighting co-retention (blue) and reciprocal retention (red). Only genes whose binary strings have entropies ≥ 0.43 (corresponding to at least three cases of retention or loss) and relationships with Hamming distances ≠ 17 are rendered. Color intensity reflects relationship strength as defined in (a) and determines the order of rendering in the plot. Genes functioning in the respiratory chain are highlighted in teal whereas genes with other functions are highlighted in tan. Regarding the latter, several genes predicted to function as ATP-powered transporters (znuABC, Sant_3721, Sant_3722, tbpA and thiPQ), along with genes encoding other proteins known to influence energy homeostasis (cutA, cpdA, pgm and djlA). Abbreviations: C. = Columbicola, sp. = species, ex. = isolated from. Source data are provided as a Source Data file.
Fig. 5
Fig. 5. Co-retention and contingent loss of genes in endosymbiont genomes involved in DNA repair and recombination.
Genes predicted to be intact are shown in green, and genes predicted to be inactive or lost are shown in purple. Blue arcs at the bottom indicate genes that are co-retained, while red arcs indicate genes that are reciprocally retained. Hamming distances are listed below the arcs, indicating the strength of direct or reciprocal similarity with zero representing a perfect match and 34 representing perfect reciprocality. C. tasmaniensisA and C. tasmaniensisB are endosymbionts in lice collected from closely related species of doves: Phaps chalcopteraA and P. elegansB. Abbreviations: C. = Columbicola, sp. = species, ex. = isolated from. Source data are provided as a Source Data file.

Similar articles

Cited by

References

    1. Kopac SM, Klassen JL. Can they make it on their own? Hosts, microbes, and the holobiont niche. Front. Microbiol. 2016;7:1647. doi: 10.3389/fmicb.2016.01647. - DOI - PMC - PubMed
    1. Zimorski V, Ku C, Martin WF, Gould SB. Endosymbiotic theory for organelle origins. Curr. Opin. Microbiol. 2014;22:38–48. doi: 10.1016/j.mib.2014.09.008. - DOI - PubMed
    1. Moran NA, McCutcheon JP, Nakabachi A. Genomics and evolution of heritable bacterial symbionts. Annu. Rev. Genet. 2008;42:165–190. doi: 10.1146/annurev.genet.41.110306.130119. - DOI - PubMed
    1. Nováková E, Hypša V, Moran NA. Arsenophonus, an emerging clade of intracellular symbionts with a broad host distribution. BMC Microbiol. 2009;9:143. doi: 10.1186/1471-2180-9-143. - DOI - PMC - PubMed
    1. Buchner, P. Endosymbiosis of animals with plant microorganisms. 1–909 (Interscience, 1965).