. 2024 May 29;9(1):139.
doi: 10.1038/s41392-024-01838-9.

Targeting BCL9/BCL9L enhances antigen presentation by promoting conventional type 1 dendritic cell (cDC1) activation and tumor infiltration

Affiliations

Targeting BCL9/BCL9L enhances antigen presentation by promoting conventional type 1 dendritic cell (cDC1) activation and tumor infiltration

Fenglian He et al. Signal Transduct Target Ther. .

Abstract

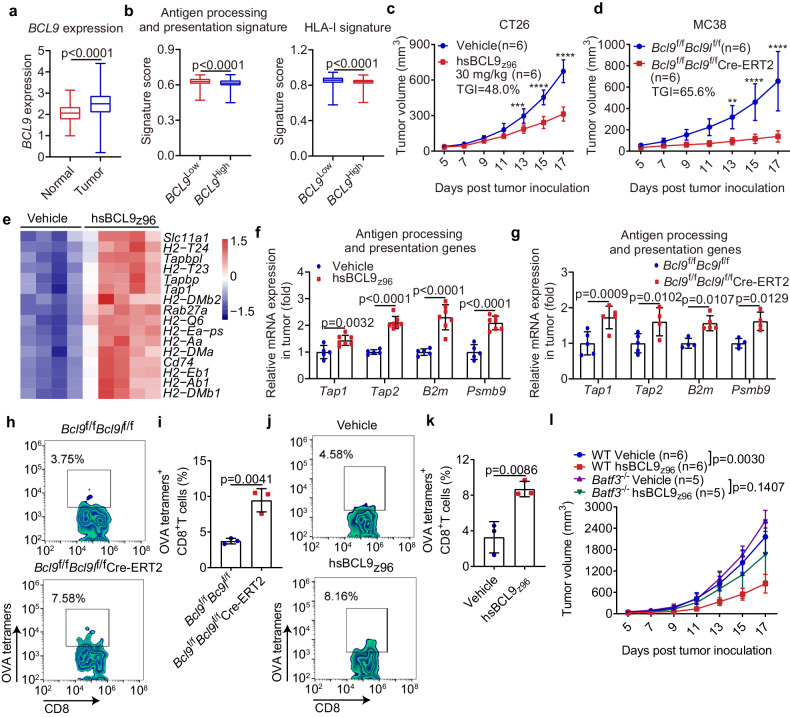
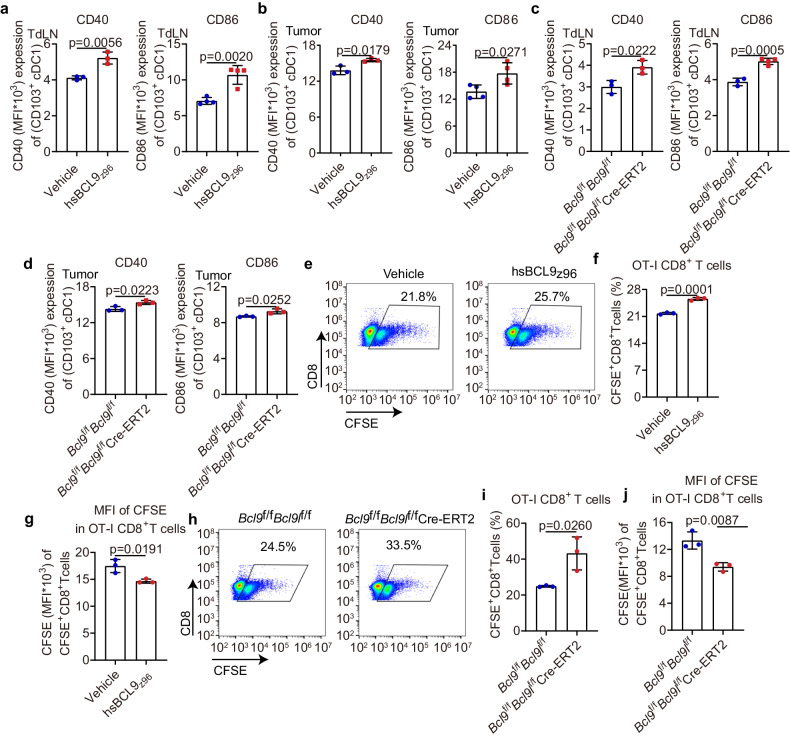
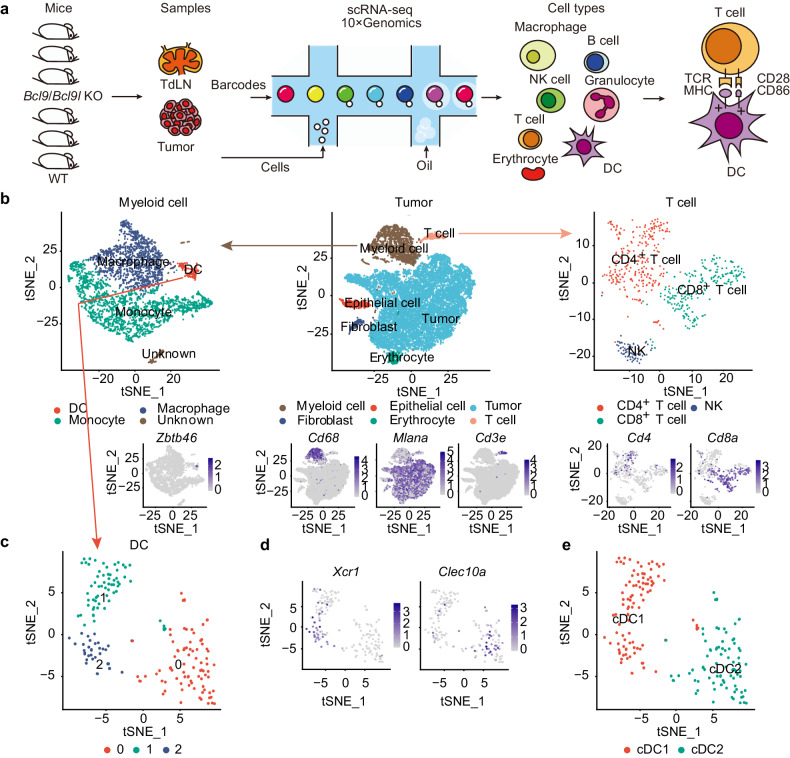
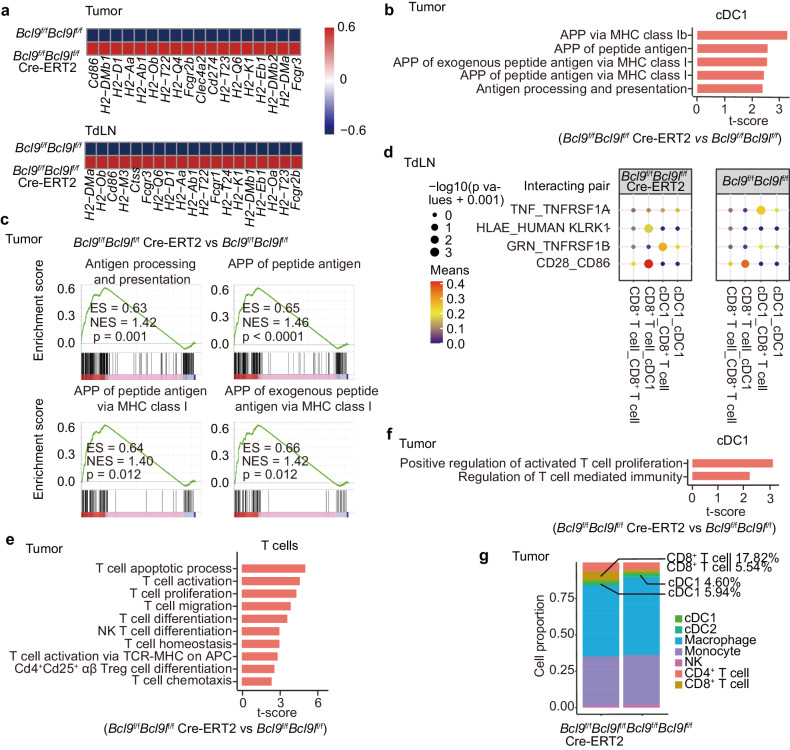
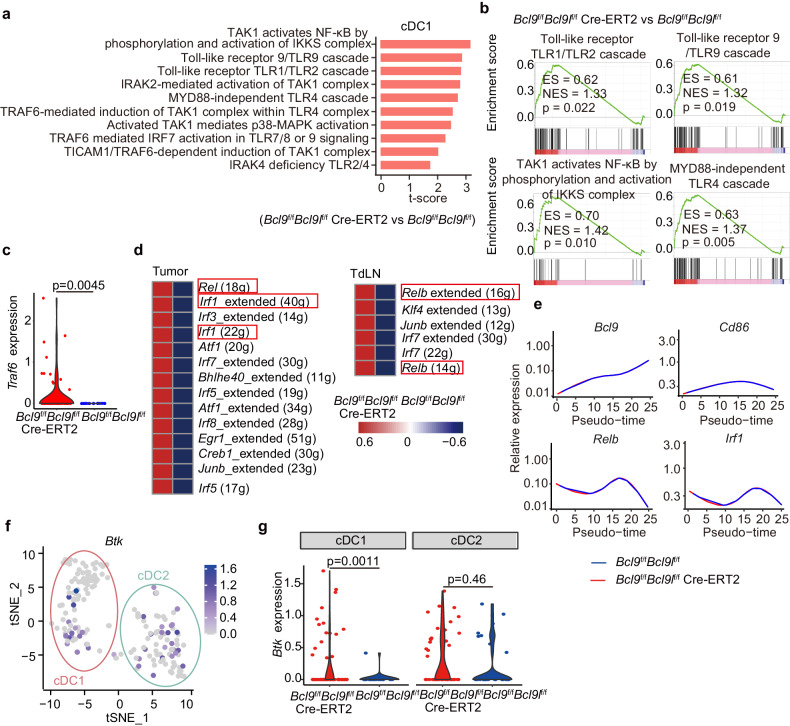
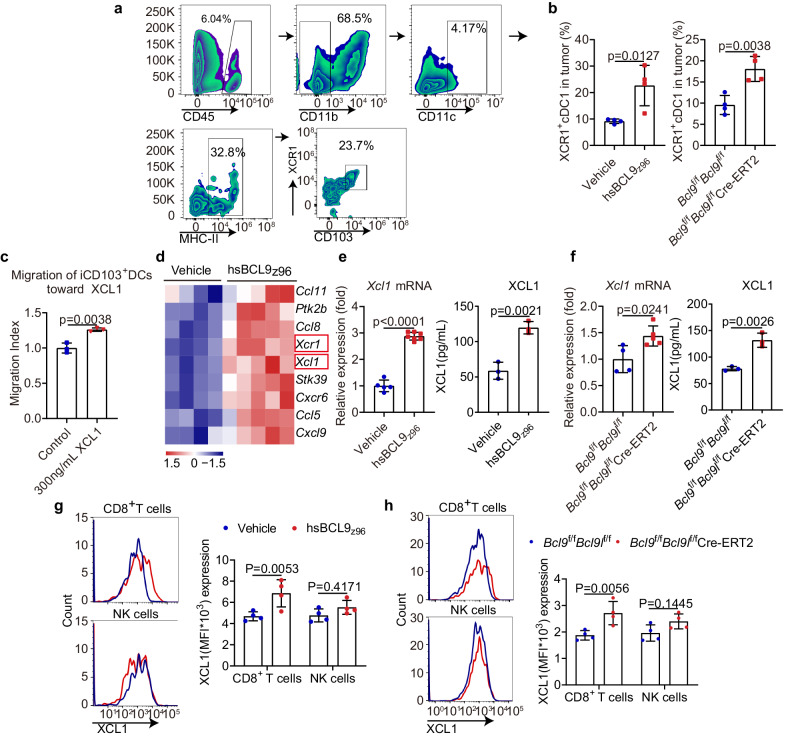
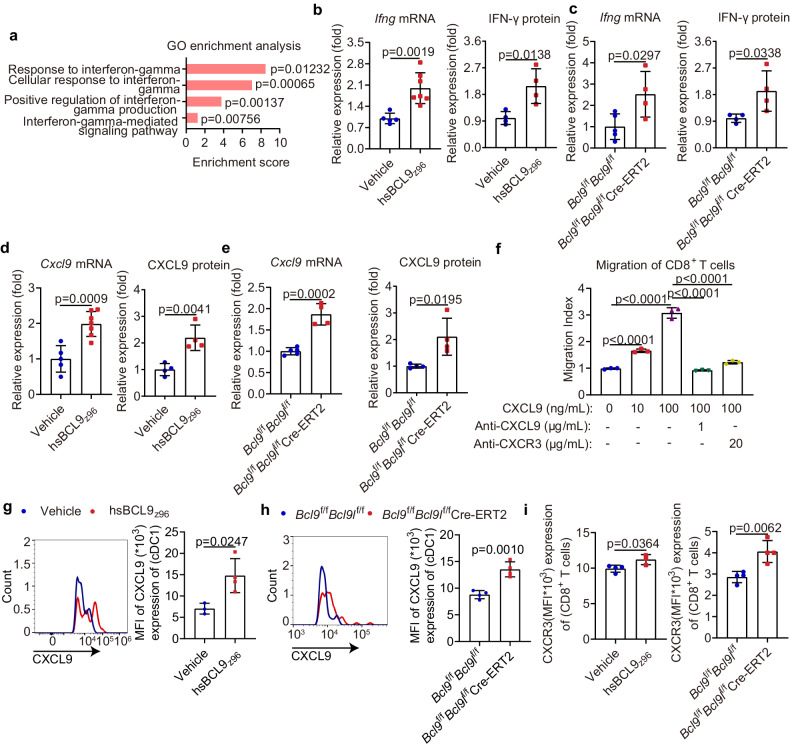
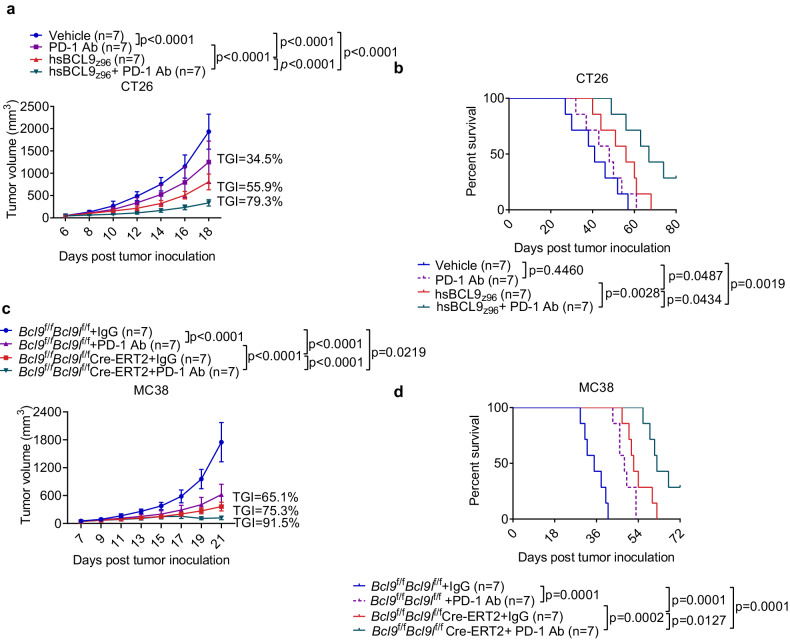
Conventional type 1 dendritic cells (cDC1) are the essential antigen-presenting DC subset in antitumor immunity. Suppressing B-cell lymphoma 9 and B-cell lymphoma 9-like (BCL9/BCL9L) inhibits tumor growth and boosts immune responses against cancer. However, whether oncogenic BCL9/BCL9L impairs antigen presentation in tumors is still not completely understood. Here, we show that targeting BCL9/BCL9L enhanced antigen presentation by stimulating cDC1 activation and infiltration into tumor. Pharmacological inhibition of BCL9/BCL9L with a novel inhibitor hsBCL9z96 or Bcl9/Bcl9l knockout mice markedly delayed tumor growth and promoted antitumor CD8+ T cell responses. Mechanistically, targeting BCL9/BCL9L promoted antigen presentation in tumors. This is due to the increase of cDC1 activation and tumor infiltration by the XCL1-XCR1 axis. Importantly, using single-cell transcriptomics analysis, we found that Bcl9/Bcl9l deficient cDC1 were superior to wild-type (WT) cDC1 at activation and antigen presentation via NF-κB/IRF1 signaling. Together, we demonstrate that targeting BCL9/BCL9L plays a crucial role in cDC1-modulated antigen presentation of tumor-derived antigens, as well as CD8+ T cell activation and tumor infiltration. Targeting BCL9/BCL9L to regulate cDC1 function and directly orchestrate a positive feedback loop necessary for optimal antitumor immunity could serve as a potential strategy to counter immune suppression and enhance cancer immunotherapy.


Conflict of interest statement

The authors declare no competing interests.

Figures

Fig. 1
Fig. 1
Pharmacological inhibition of BCL9 induces tumor regression and increases antigen presentation. a The BCL9 expression between tumors and normal tissues in TCGA COAD datasets (Normal, n = 41; Tumor, n = 462). b The antigen processing and presentation signature (left) and HLA-I signature (right) between low and high BCL9 expression (median value) in TCGA COAD datasets (BCL9Low, n = 209; BCL9High, n = 236). c Tumor growth of 30 mg/kg hsBCL9z96-treated CT26 tumor-bearing mice (n = 6). d Tumor growth of MC38 tumor-bearing Bcl9f/fBcl9lf/f mice and Bcl9f/fBcl9lf/f Cre-ERT2 mice treated i.p. with tamoxifen (1 mg/100 μL) in olive oil on days −7, −6, −5, +1, +6, and +11 post inoculation (n = 6). e Heatmap of the genes included in the GO:0019882 from 30 mg/kg hsBCL9z96-treated CT26 tumors (Vehicle, n = 4; hsBCL9z96, n = 5). f, g The relative expression of Tap1, Tap2, B2m and Psmb9 of tumors from hsBCL9z96-treated CT26 tumor-bearing mice (f) and MC38 tumor-bearing Bcl9f/fBcl9lf/f Cre-ERT2 mice (g) analyzed by qPCR (n = 4–7). hk Representative plot (h, j) and quantitative analysis (i, k) of OVA257-264-specific CD8+ T cells in TILs of tumors from MC38-OVA tumor-bearing Bcl9f/fBcl9lf/f Cre-ERT2 mice (h, i) and hsBCL9z96-treated MC38-OVA tumor-bearing mice (j, k) treated i.p. with tamoxifen (1 mg/100 μL) in olive oil on days −7, −6, −5, +1, +6, and +11 post inoculation and analyzed by flow cytometry (n = 3). l Tumor growth of C57BL/6 WT (n = 6) and Batf3−/− mice (n = 5) that had been injected subcutaneously with MC38 tumor cells and were treated i.p. with vehicle or 40 mg/kg hsBCL9z96 every day for 2 weeks. These data are representative values expressed as the mean ± SD of each group; n indicates biological replicate; **p < 0.01; ***p < 0.001; ****p < 0.0001; Unpaired Student’s t test (a, b, i, k); Two-way ANOVA followed by Bonferroni test (c, d, f, g)
Fig. 2
Fig. 2
Inhibition of BCL9/BCL9L enhances cDC1 activation and facilitates cross-priming of CD8+ T cells. a, b CD40 (left) and CD86 (right) expression by CD103+ cDC1 of TdLNs (a) and tumors (b) from 30 mg/kg hsBCL9z96-treated CT26 tumor-bearing mice analyzed by flow cytometry (n = 3-4). c, d CD40 (left) and CD86 (right) expression by CD103+ cDC1 of TdLNs (c) and tumors (d) from MC38 tumor-bearing Bcl9f/fBcl9lf/f Cre-ERT2 mice treated i.p. with tamoxifen (1 mg/100 μL) in olive oil on days −7, −6, −5, +1, +6, and +11 post inoculation analyzed by flow cytometry (n = 3–4). e The representative plot of OT-I CD8+ T cells in TdLNs from hsBCL9z96-treated MC38-OVA tumor-bearing mice analyzed by flow cytometry. f and g Quantitative analysis of the percentage of OT-I CD8+ T cells (f) and CFSE dilution of OT-I CD8+ T cells (mean fluorescent intensity, MFI) (g) based on the result of (e) (n = 3). h The representative plot of OT-I CD8+ T cells in TdLNs from MC38-OVA tumor-bearing Bcl9f/fBcl9lf/f Cre-ERT2 mice treated i.p. with tamoxifen (1 mg/100 μL) in olive oil on days −7, −6, −5, +1, and +6 post inoculation analyzed by flow cytometry. i, j Quantitative analysis of the percentage of OT-I CD8+ T cells (i) and CFSE dilution of OT-I CD8+ T cells (j) based on the result of (h) (n = 3). These data are representative values expressed as the mean ± standard deviation (SD) for each group, derived from three independent experiments; “n” denotes the number of biological replicates. An unpaired Student’s t test was used for statistical analysis of the data in groups ad, f, g, i, and j
Fig. 3
Fig. 3
Single-cell transcriptional profiling of CD8+ T cells and cDC1 in tumors and TdLNs from B16-OVA tumor-bearing Bcl9/Bcl9l deficiency mice. a Illustration of experiment and analysis process of single-cell transcriptional analysis. b TSNE plots of clustering process and marker genes (Zbtb46 for DCs, Cd68 for myeloid cells, Mlana for B16-OVA tumor cells, Cd3e for T cells, Cd4 for CD4+ T cells and Cd8a for CD8+ T cells) in tumors from B16-OVA tumor-bearing Bcl9f/fBcl9lf/f mice and Bcl9f/fBcl9lf/f Cre-ERT2 mice treated i.p. with tamoxifen (1 mg/100 μL) in olive oil on days −7, −6, −5, +1, +6 and +11 post inoculation. ce TSNE plots of DC reclustering (c, e) and marker genes (Xcr1 for cDC1 and Clec10a for cDC2) (d) in tumors from B16-OVA tumor-bearing Bcl9f/fBcl9lf/f mice and Bcl9f/fBcl9lf/f Cre-ERT2 mice treated i.p. with tamoxifen (1 mg/100 μL) in olive oil on days −7, −6, −5, +1, +6, and +11 post inoculation
Fig. 4
Fig. 4
Bcl9/Bcl9l deficient cDC1 are superior to WT cDC1 in activation, antigen presentation and cross-priming of CD8+ T cells. a Expression of genes related to cDC1 maturation and antigen presentation in tumors and TdLNs from B16-OVA tumor-bearing Bcl9f/fBcl9lf/f mice and Bcl9f/fBcl9lf/f Cre-ERT2 mice treated i.p. with tamoxifen (1 mg/100 μL) in olive oil on days −7, −6, −5, +1, +6 and +11 post inoculation. b, c GSVA (b) and GSEA (c) of cDC1 for gene sets in tumors from B16-OVA tumor-bearing Bcl9f/fBcl9lf/f mice and Bcl9f/fBcl9lf/f Cre-ERT2 mice treated i.p. with tamoxifen (1 mg/100 μL) in olive oil on days −7, −6, −5, +1, +6, and +11 post inoculation. APP, antigen processing and presentation. d Cell communication analysis of cDC1 and CD8+ T cells in TdLNs from B16-OVA tumor-bearing Bcl9f/fBcl9lf/f mice and Bcl9f/fBcl9lf/f Cre-ERT2 mice treated i.p. with tamoxifen (1 mg/100 μL) in olive oil on days −7, −6, −5, +1, +6, and +11 post inoculation. e GSVA of T cells in tumors from B16-OVA tumor-bearing Bcl9f/fBcl9lf/f mice and Bcl9f/fBcl9lf/f Cre-ERT2 mice treated i.p. with tamoxifen (1 mg/100 μL) in olive oil on days −7, −6, −5, +1, +6, and +11 post inoculation. The gene sets related to T cell activation and function are shown. T cell activation via TCR-MHC on APC, is the abbreviation for T cell activation via TCR contact with Ag (antigen) bound to MHC on APC. f GSVA of cDC1 in tumors from B16-OVA tumor-bearing Bcl9f/fBcl9lf/f mice and Bcl9f/fBcl9lf/f Cre-ERT2 mice treated i.p. with tamoxifen (1 mg/100 μL) in olive oil on days −7, −6, −5, +1, +6, and +11 post inoculation. The gene sets related to regulation of T cells are shown. g Cell fraction of TILs from tumors of B16-OVA tumor-bearing Bcl9f/fBcl9lf/f mice and Bcl9f/fBcl9lf/f Cre-ERT2 mice treated i.p. with tamoxifen (1 mg/100 μL) in olive oil on days −7, −6, −5, +1, +6, and +11 post inoculation
Fig. 5
Fig. 5
Bcl9/Bcl9l deficiency facilitates cDC1 activation and antigen presentation via TAK1/NF-κB/IRF1 axis. ac GSVA (a), GSEA (b) and Traf6 expression (c) of cDC1 in tumors from B16-OVA tumor-bearing Bcl9f/fBcl9lf/f mice and Bcl9f/fBcl9lf/f Cre-ERT2 mice treated i.p. with tamoxifen (1 mg/100 μL) in olive oil on days −7, −6, −5, +1, +6, and +11 post inoculation. d Transcription factors that were activated in cDC1 of tumors and TdLNs from B16-OVA tumor-bearing Bcl9f/fBcl9lf/f mice and Bcl9f/fBcl9lf/f Cre-ERT2 mice treated i.p. with tamoxifen (1 mg/100 μL) in olive oil on days −7, −6, −5, +1, +6, and +11 post inoculation. e Pseudo-time analysis of cDC1 in tumors from B16-OVA tumor-bearing Bcl9f/fBcl9lf/f mice and Bcl9f/fBcl9lf/f Cre-ERT2 mice treated i.p. with tamoxifen (1 mg/100 μL) in olive oil on days −7, −6, −5, +1, +6, and +11 post inoculation. The trends of Bcl9, Cd86, Relb, and Irf1 expression through time are shown. f TSNE plots of Btk in DC. g The expression of Btk in cDC1 and cDC2 between tumors from B16-OVA tumor-bearing Bcl9f/fBcl9lf/f and Bcl9f/fBcl9lf/f Cre-ERT2 mice treated i.p. with tamoxifen (1 mg/100 μL) in olive oil on days −7, −6, −5, +1, +6, and +11 post inoculation. These data are representative charts or values expressed as the mean ± SD of each group; Unpaired Student’s t test (c, g)
Fig. 6
Fig. 6
Targeting of BCL9/BCL9L increases cDC1 accumulation in tumors through XCL1-XCR1 axis. a Gating strategy of XCR+ cDC1 (CD45+ CD11b CD11c+ MHC-II+ CD103+ XCR1+) in TILs. b The XCR+ cDC1 in TILs of 30 mg/kg hsBCL9z96-treated CT26 tumor-bearing mice (left) and MC38 tumor-bearing Bcl9f/fBcl9lf/fCre-ERT2 mice (right) treated i.p. with tamoxifen (1 mg/100 μL) in olive oil on days −7, −6, −5, +1, +6, and +11 post inoculation were analyzed by flow cytometry (n = 4). c iCD103+ DC migration toward XCL1 for 3 h by trans well assay (n = 3). d Heatmap of the genes included in GO:0070098 of 30 mg/kg hsBCL9z96-treated CT26 tumors (vehicle, n = 4; hsBCL9z96, n = 5). e, f Xcl1 mRNA (left) and XCL1 protein (right) levels in tumors from 30 mg/kg hsBCL9z96-treated CT26 tumor-bearing mice (e) and MC38 tumor-bearing Bcl9f/fBcl9lf/fCre-ERT2 mice (f) treated i.p. with tamoxifen (1 mg/100 μL) in olive oil on days −7, −6, −5, +1, +6, and +11 post inoculation were analyzed by qPCR and ELISA, respectively (n = 4-5). g, h Representative plot (left) and quantitative analysis (right) of XCL1 expression of CD8+ T cells and NK cells in TILs from 30 mg/kg hsBCL9z96-treated CT26 tumor-bearing mice analyzed by flow cytometry (n = 4). g Representative plot (left) and quantitative analysis (right) of XCL1 expression among CD8+ T cells and NK cells in TILs from MC38 tumor-bearing Bcl9f/fBcl9lf/f Cre-ERT2 mice treated i.p. with tamoxifen (1 mg/100 μL) in olive oil on days −7, −6, −5, +1, +6, and +11 post inoculation were analyzed by flow cytometry (n = 4). h Results are presented as the mean ± standard deviation (SD) for each group, derived from three independent experiments; “n” denotes the number of biological replicates; Unpaired Student’s t test (b, c, e, f); Two-way ANOVA followed by Bonferroni test (g, h)
Fig. 7
Fig. 7
Targeting BCL9/BCL9L results in CD8+ T cells accumulation in tumors through CXCL9-CXCR3 axis. a Significantly upregulated GO terms related to IFN-γ response of 30 mg/kg hsBCL9z96-treated CT26 tumors are depicted (vehicle, n = 4; hsBCL9z96, n = 5). b and c Relative Ifng mRNA (left) and IFN-γ protein (right) levels in tumors from 30 mg/kg hsBCL9z96-treated CT26 tumor-bearing mice (b) and MC38 tumor-bearing Bcl9f/fBcl9lf/f Cre-ERT2 mice (c) treated i.p. with tamoxifen (1 mg/100 μL) in olive oil on days −7, −6, −5, +1, +6, and +11 post inoculation analyzed by qPCR and ELISA, respectively (n = 4–7). d, e Relative Cxcl9 mRNA (left) and CXCL9 protein (right) expression of tumors from 30 mg/kg hsBCL9z96-treated CT26 tumor-bearing mice (d) and MC38 tumor-bearing Bcl9f/fBcl9lf/f Cre-ERT2 mice (e) treated i.p. with tamoxifen (1 mg/100 μL) in olive oil on days −7, −6, −5, +1, +6, and +11 post inoculation analyzed by qPCR and ELISA, respectively (n = 4-7). f Assessment of CD8+ T cell migration toward CXCL9 or with the indicated doses of antibodies or chemokine for 4 h by trans well assay (n = 3). g Representative plot (left) and quantitative analysis (right) of CXCL9 expression in cDC1 of tumors from 30 mg/kg hsBCL9z96-treated CT26 tumor-bearing mice analyzed by flow cytometry (n = 3–4). h Representative plot (left) and quantitative analysis (right) of CXCL9 expression in cDC1 of tumors from MC38 tumor-bearing Bcl9/Bcl9l deficiency mice analyzed by flow cytometry (n = 4). i The expression of CXCR3 in CD8+ T cells of tumors from 30 mg/kg hsBCL9z96-treated CT26 tumor-bearing mice (left) and MC38 tumor-bearing Bcl9f/fBcl9lf/f Cre-ERT2 mice (right) treated i.p. with tamoxifen (1 mg/100 μL) in olive oil on days −7, −6, −5, +1, +6, and +11 post inoculation analyzed by flow cytometry (n = 4). Results are presented as the mean ± standard deviation (SD) for each group, derived from three independent experiments; “n” denotes the number of biological replicates; Unpaired Student’s t test (be, gi); One-way ANOVA followed by Bonferroni test (f)
Fig. 8
Fig. 8
Targeting BCL9/BCL9L sensitizes tumors to immune checkpoint blockade therapy. a, b Tumor growth (a) and survival (b) of CT26 tumor-bearing mice treated i.p. with vehicle, 30 mg/kg hsBCL9z96, 10 mg/kg anti-PD-1 or combinational therapy (n = 5-7). c, d Tumor growth (c) and survival (d) of MC38 tumor-bearing Bcl9f/fBcl9lf/f mice and Bcl9f/fBcl9lf/f Cre-ERT2 mice. Individual mice were treated with tamoxifen on days −7, −6, −5, +1, +6, and +11 post inoculation. For anti-PD-1 combination therapy, individual mice were treated with 10 mg/kg anti-PD-1 every 3 days (n = 5). Results are presented as the mean ± standard deviation (SD) for each group, derived from three independent experiments; n indicates biological replicate; Two-way ANOVA followed by Bonferroni test (a, c); One-way ANOVA followed by Bonferroni test (b, d)

Similar articles

Cited by

References

    1. Jhunjhunwala S, Hammer C. Antigen presentation in cancer: insights into tumour immunogenicity and immune evasion. Nat Rev Cancer. 2021;21:298–312. doi: 10.1038/s41568-021-00339-z. - DOI - PubMed
    1. Cancel JC, Crozat K, Dalod M, Mattiuz R. Are conventional type 1 dendritic cells critical for protective antitumor immunity and how? Front. Immunol. 2019;10:9. doi: 10.3389/fimmu.2019.00009. - DOI - PMC - PubMed
    1. Wculek SK, et al. Dendritic cells in cancer immunology and immunotherapy. Nat. Rev. Immunol. 2020;20:7–24. doi: 10.1038/s41577-019-0210-z. - DOI - PubMed
    1. Hildner K, et al. Batf3 deficiency reveals a critical role for CD8alpha+ dendritic cells in cytotoxic T cell immunity. Science. 2008;322:1097–1100. doi: 10.1126/science.1164206. - DOI - PMC - PubMed
    1. Salmon H, et al. Expansion and activation of CD103(+) dendritic cell progenitors at the tumor site enhances tumor responses to therapeutic PD-L1 and BRAF inhibition. Immunity. 2016;44:924–938. doi: 10.1016/j.immuni.2016.03.012. - DOI - PMC - PubMed

Publication types