. 2024 May 29;15(1):4584.
doi: 10.1038/s41467-024-48922-w.

Small molecule induced STING degradation facilitated by the HECT ligase HERC4

Affiliations

Small molecule induced STING degradation facilitated by the HECT ligase HERC4

Merve Mutlu et al. Nat Commun. .

Abstract

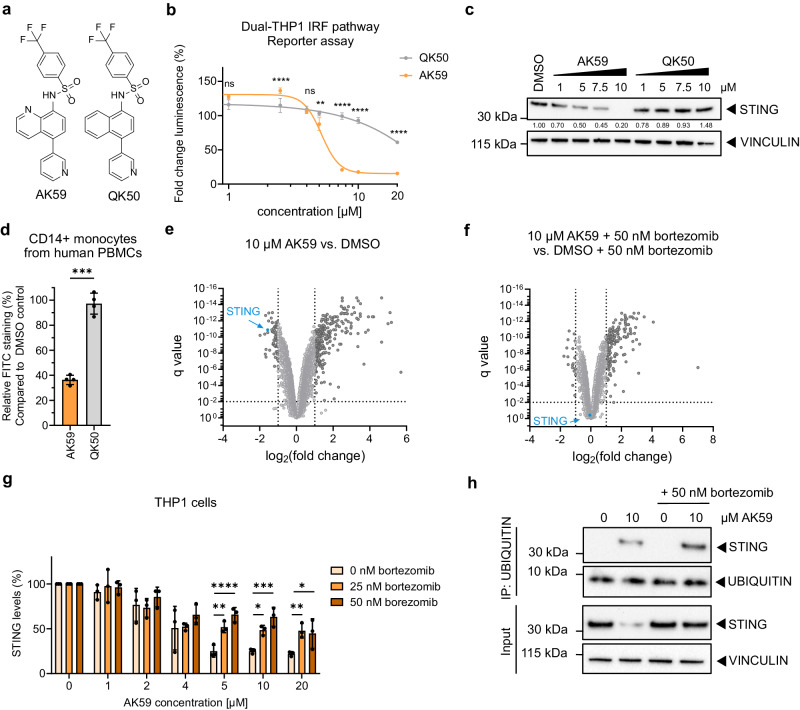
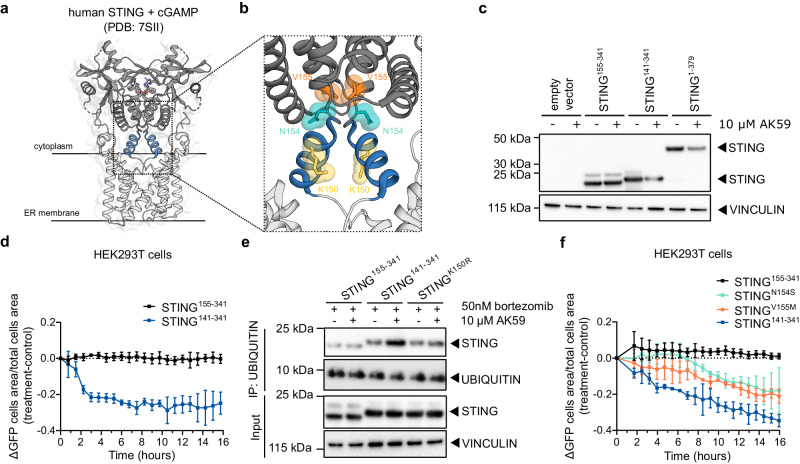
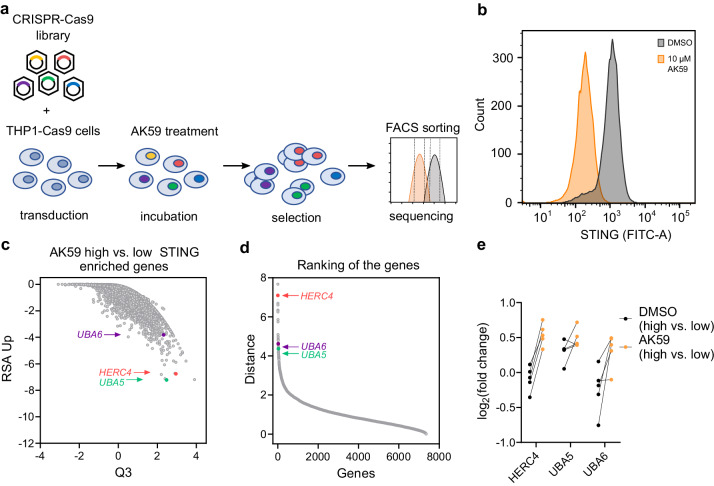
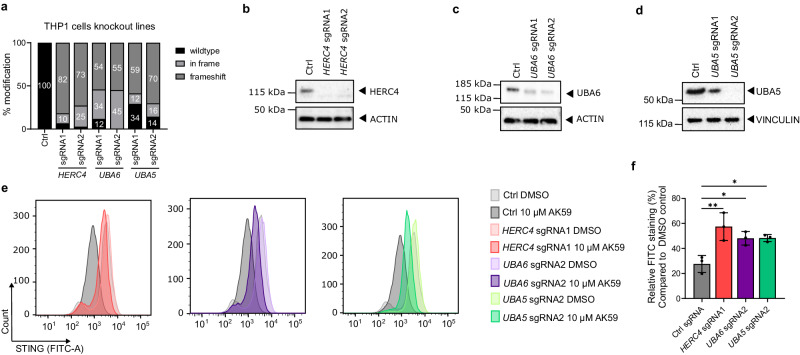
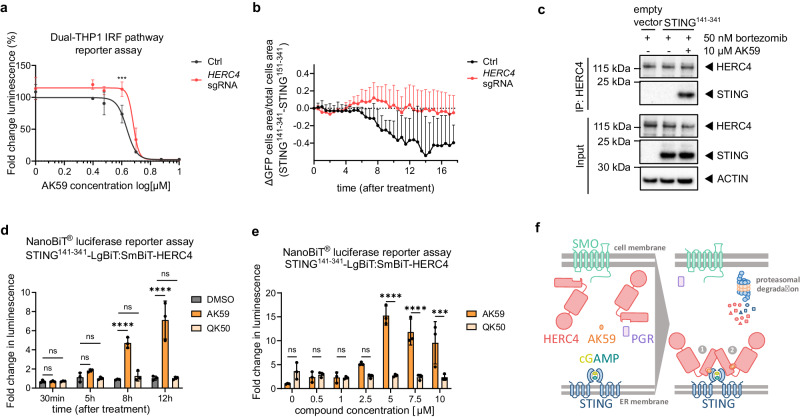
Stimulator of interferon genes (STING) is a central component of the cytosolic nucleic acids sensing pathway and as such master regulator of the type I interferon response. Due to its critical role in physiology and its' involvement in a variety of diseases, STING has been a focus for drug discovery. Targeted protein degradation (TPD) has emerged as a promising pharmacology for targeting previously considered undruggable proteins by hijacking the cellular ubiquitin proteasome system (UPS) with small molecules. Here, we identify AK59 as a STING degrader leveraging HERC4, a HECT-domain E3 ligase. Additionally, our data reveals that AK59 is effective on the common pathological STING mutations, suggesting a potential clinical application of this mechanism. Thus, these findings introduce HERC4 to the fields of TPD and of compound-induced degradation of STING, suggesting potential therapeutic applications.


Conflict of interest statement

M.M., I.S., B.G., F.F., D.B., O.S., N.P., E.A., S.K., S.R., D.J., T.T., R.M., S.A., A.R., F.N., A.H., C.N.P., and D.G. are current employees and shareholders of Novartis Pharma. A.I.M., D.Bo., and J.R.H. are former employees of Novartis Pharma. D.Bo. is a current employee of Monte Rosa Therapeutics, Basel, Switzerland., J.R.H. is a current employee of Vector Biology, Cambridge, MA, USA.

Figures

Fig. 1
Fig. 1. AK59 induces STING depletion in THP1 cells through proteasomal degradation.
a Chemical structure of AK59 and QK50. b IRF pathway reporter assay on wild-type Dual-THP1 cells treated with increasing doses of AK59 or QK50 for 16 h. Data plotted as mean ± SD of three individual biological replicates. Calculated half-maximal inhibitory concentrations (IC50s) are 5.196 and 54.23 for AK59 and QK50 respectively. Significance was calculated using two-way ANOVA followed by Šidák’s correction. Significance indicated as ns p > 0.05, **p = 0.004, ****p < 0.0001. c Western blot showing STING protein expressions in THP1 cells upon increasing doses of AK59 or QK50. Results are representative of three independent experiments. d STING expression of CD14+ human PBMCs treated with either 10 µM AK59 or QK50 over 16 h. Four donors were represented as biological replicates and plotted as mean ± SD as well as individual samples represented. Significance calculated using paired t-test. Significance indicated as ***p = 0.0001. e, f Proteomic analysis of 10 µM AK59-treated THP1 cells in the absence (e) or presence (f) of bortezomib and compared to control DMSO control. Significantly altered protein abundances (in dark grey) are shown with a log2 fold change <− 1 or >1 and a q value cutoff of 0.01. g STING expression of THP1 cells treated with AK59 with or without prior bortezomib treatment (25 or 50 nM). STING expression was detected via FACS analysis on fixed cells. Bortezomib treatment was 1 h prior to AK59 treatments. Each treatment group was normalized to its individual DMSO control and represented in percentage. Three biological replicates were plotted as the mean ± SD. Significance was calculated using two-way ANOVA followed by Šidák’s correction. Significance indicated as ns p > 0.05, ** at 5 µM p = 0.0068, *** at 10 µM p = 0.0001, * at 10 µM p = 0.0191, ** at 20 µM p = 0.0096, * at 20 µM p = 0.0237, ***p < 0.001. h Ubiquitin pulldown followed by western blot on THP1 cells treated with 16 h of 10 µM AK59 and 1 h of our prior 50 nM bortezomib addition. Source data are provided as a Source Data file.
Fig. 2
Fig. 2. K150 is essential for STING ubiquitination upon AK59 treatment.
a Crystal structure of the dimerized STING. The N-terminus of the structure, containing transmembrane domains are shown in light gray and the C-terminus of the structure containing ligand biding domain is shown in dark gray. The connector helix is shown in blue. cGAMP, represented in pink, bound to the cytosolic domain of STING dimer. b STING dimer crystal structure zoomed in to the K150 residue (shown in yellow), N154 residue (shown in cyan), and V155 residue (shown in orange). c Western blot showing the STING expression levels in empty vector, STING155-341, STING141-341, or STING1-379 (not GFP tagged) expressing in HEK293T cells. Cells were either treated with 10 µM of AK59 or DMSO control for 16 h. Results are representative of three independent experiments. d Live cell tracking of C-terminally GFP-tagged STING141-341-GFP or STING155-341-GFP. For each data point, 16 pictures/well were averaged per biological replicate. Three biological replicates were plotted as mean ± SD. e Ubiquitin pulldown followed by western blot on HEK293T cells transfected with STING141-341, STING155-341, STING141-341_K150R (not GFP tagged) and treated with either 10 µM AK59 or DMSO (vehicle) control for 16 h. All samples were treated with 50 nM bortezomib 1 h prior to the AK59 (or DMSO control) treatment. Results are representative of three independent experiments. f Live cell tracking of C-terminally GFP-tagged STING141-341-GFP and SAVI mutants STING141-341_N154S-GFP, STING141-341_V155M-GFP transfected HEK293T cells after 10 µM AK59 treatment. The connector helix deficient construct STING155-341 was used as a negative control. GFP+ cell area divided by total cell area normalized to the start of the treatment and delta GFP signal calculated by (AK59 treatment-DMSO control) for each time point. For each data point, 16 pictures/well were taken. Data from biological replicates were plotted as mean ± SD. Source data are provided as a Source Data file.
Fig. 3
Fig. 3. CRISPR-Cas9 genome-wide screening unveils genes responsible for AK59 activity on STING expression.
a Schematic representation of the workflow of CRISPR-Cas9 genome-wide knockout screen. See the main text or Materials and methods section for details. b FACS analysis of THP1-Cas9 cells treated with either DMSO (black) or 10 µM AK59 (orange). Detection of STING expression was repeated in three biological replicates and representative FACS reads were plotted using FlowJo (Version 10.6.1). c Comparison of RSA up values with Q3 values from the CRISPR-Cas9 screen of 10 µM treated THP1 cells represented in a dot plot. The data represented in the plot corresponds to the comparison between high STING expression versus low STING expression in the AK59 treatment group. Each dot represents a gene from the CRISPR-Cas9 library. d Ranking of genes that upon AK59 treatment of THP1 cells, have enriched sgRNAs in the high STING expression group compared to the low expression group. The ranking distance was calculated as the change of RSA and Q values between the two treatment groups. Each gene is represented with a dot on the graph. e Individual fold changes of each sgRNA targeting HERC4, UBA5, and UBA6 in the high vs. low STING expression comparison groups in the compound treated and untreated samples. Source data are provided as a Source Data file.
Fig. 4
Fig. 4. Validation of HERC4, UBA5, and UBA6 as genes responsible for AK59 activity on STING levels.
a TIDE analysis of either Ctrl sgRNA, sgRNA1 or sgRNA2 transduced THP1-Cas9 cells for HERC4, UBA5, and UBA6. Modification rates were checked at the third passage after the initial transduction. Undefined sequencing reads were excluded. bd Western blot to detect HERC4 (b), UBA5 (c), and UBA6 (d) protein levels of either Ctrl sgRNA, sgRNA1, or sgRNA2 transduced THP1 cells. Proteins from each cell line were collected at the third passage after the initial transduction. ACTIN or VINCULIN was used as a loading control. Results are representative of 3 independent experiments. e FACS analysis of STING expression on Ctrl sgRNA or HERC4 sgRNA1, UBA6 sgRNA2, UBA5 sgRNA2 transduced THP1-Cas9 cells that were treated with either DMSO or 10 µM AK59. The experiment was repeated in three biological replicates and representative FACS reads plotted using FlowJo (Version 10.6.1). f Relative STING expression levels HERC4 sgRNA1, UBA5 sgRNA2, and UBA6 sgRNA2 transduced THP1-Cas9 cell lines determined via FACS analysis. Data were normalized to the DMSO (vehicle) treated group and three biological replicates were plotted as mean ± SD. Statistical significance was calculated using one-way ANOVA followed by Dunnett’s multiple comparison test. Significance indicated as **p = 0.0024, *p = 0.0202, and *p = 0.0194 respectively. Source data are provided as a Source Data file.
Fig. 5
Fig. 5. AK59 acts as STING degrader mediated by HERC4.
a IRF pathway reporter assay on wildtype or HERC4 knockout Dual-THP1-Cas9 cells. Data plotted as mean ± SD of three individual biological replicates. Calculated half-maximal inhibitory concentrations (IC50s) are 4.316 and 4.792 for Ctrl and HERC4 sgRNA, respectively. Significance was calculated using two-way ANOVA followed by Šidák’s correction. Significance indicated as ***p < 0.001. b Live cell tracking of STING141-341-GFP and STING151-341-GFP in wildtype or HERC4 knockout HEK293-JumpIN-Cas9 cells after 10 µM AK59 treatment. Four biological replicates were plotted as mean ± SD. c Co-immunoprecipitation with HERC4 followed by western blot of indicated proteins on HEK293T cells transiently expressing STING141-341 and treated either with 10 µM AK59 or DMSO control. Transfection of an empty vector was used as a negative control. Results are representative of 3 independent experiments. d NanoBiT® assay on STING-LgBiT and SmBiT-HERC4 expressing HEK293T cells treated with either 10 µM AK59, 10 µM QK50, or DMSO control. Three biological replicates were plotted as mean ± SD. Significance was calculated using two-way ANOVA followed by Šidák’s correction. Significance indicated as ns p > 0.05, ****p < 0.0001. e NanoBiT® assay on STING-LgBiT and SmBiT-HERC4 expressing HEK293T cells in the presence of increasing concentrations of either AK59 or QK50 over 16-hour treatment. Three biological replicates were plotted as mean ± SD. Significance was calculated using two-way ANOVA followed by Šidák’s correction. Significance indicated as ns p > 0.05, ***p = 0.0007, and ****p < 0.0001. f Graphical representation of naive and compound added state of the cells and the suggested protein–protein interactions in the presence of AK59. The panel represents two possible PPI induced by AK59: with AK59 interacting directly with both STING and HERC4 (indicated as 1) or via an allosteric site on HERC4, allowing neosubstrate recognition (indicated as 2). Source data are provided as a Source Data file.

Similar articles

Cited by

References

    1. Motwani M, Pesiridis S, Fitzgerald KA. DNA sensing by the cGAS–STING pathway in health and disease. Nat. Rev. Genet. 2019;20:657–674. doi: 10.1038/s41576-019-0151-1. - DOI - PubMed
    1. Wan D, Jiang W, Hao J. Research advances in how the cGAS-STING pathway controls the cellular inflammatory response. Front. Immunol. 2020;11:615. doi: 10.3389/fimmu.2020.00615. - DOI - PMC - PubMed
    1. Decout A, Katz JD, Venkatraman S, Ablasser A. The cGAS–STING pathway as a therapeutic target in inflammatory diseases. Nat. Rev. Immunol. 2021;21:548. doi: 10.1038/s41577-021-00524-z. - DOI - PMC - PubMed
    1. Hines JB, Kacew AJ, Sweis RF. The development of STING agonists and emerging results as a cancer immunotherapy. Curr. Oncol. Rep. 2023;25:189–199. doi: 10.1007/s11912-023-01361-0. - DOI - PMC - PubMed
    1. Su T, et al. STING activation in cancer immunotherapy. Theranostics. 2019;9:7759. doi: 10.7150/thno.37574. - DOI - PMC - PubMed

Substances