. 2024 May 29;15(1):4578.
doi: 10.1038/s41467-024-48910-0.

Mucus production, host-microbiome interactions, hormone sensitivity, and innate immune responses modeled in human cervix chips

Affiliations

Mucus production, host-microbiome interactions, hormone sensitivity, and innate immune responses modeled in human cervix chips

Zohreh Izadifar et al. Nat Commun. .

Abstract

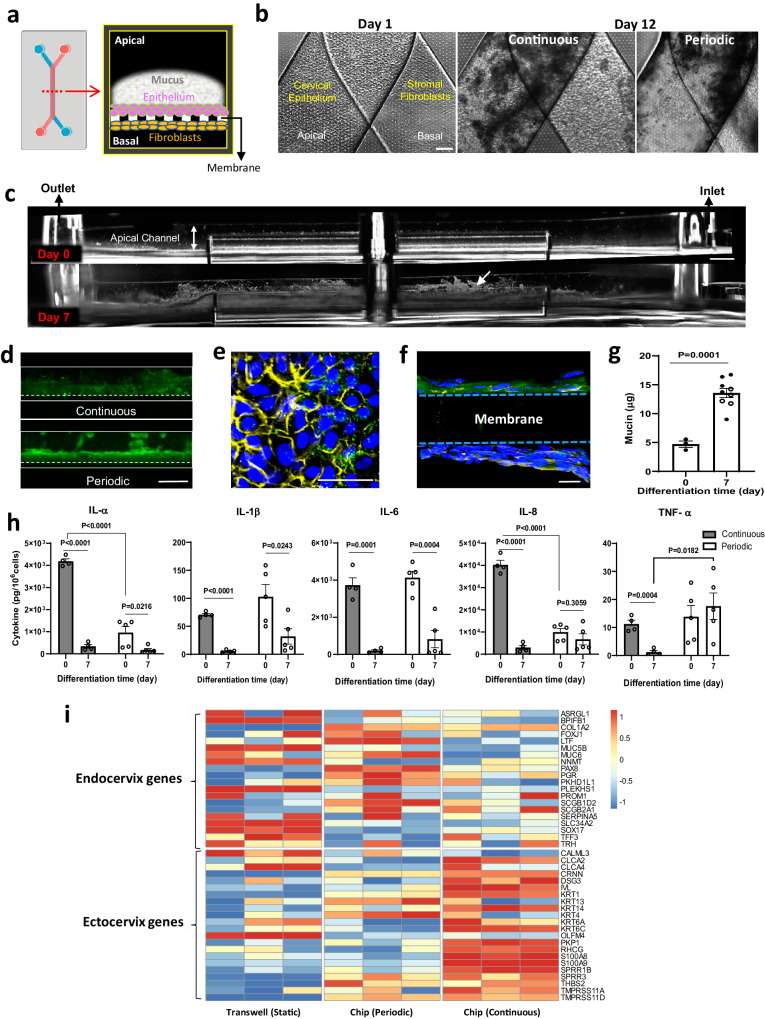
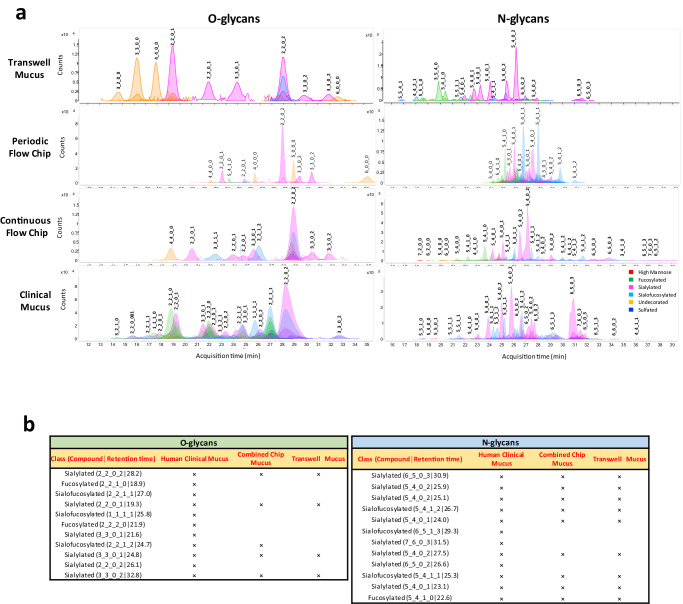
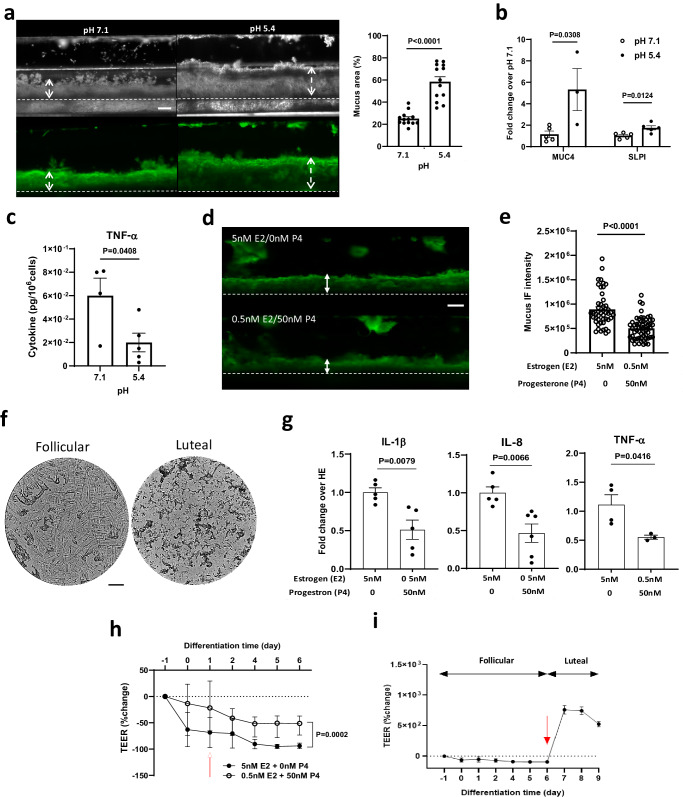
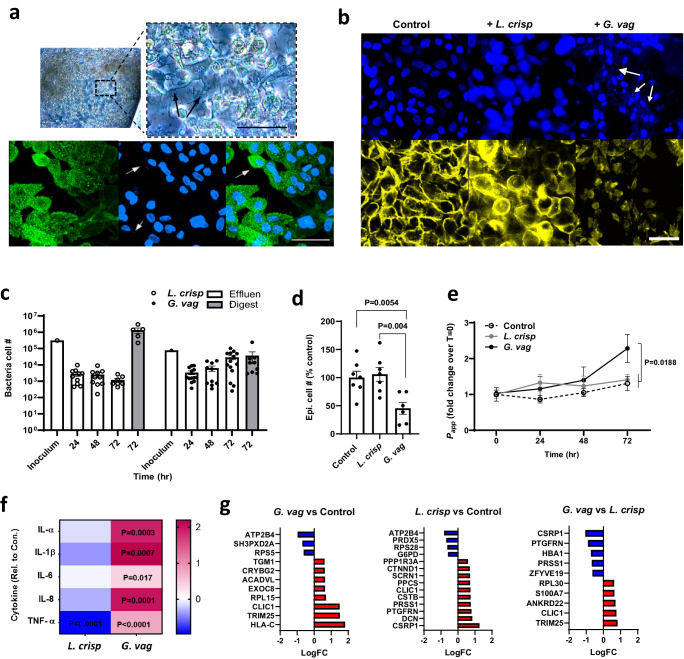
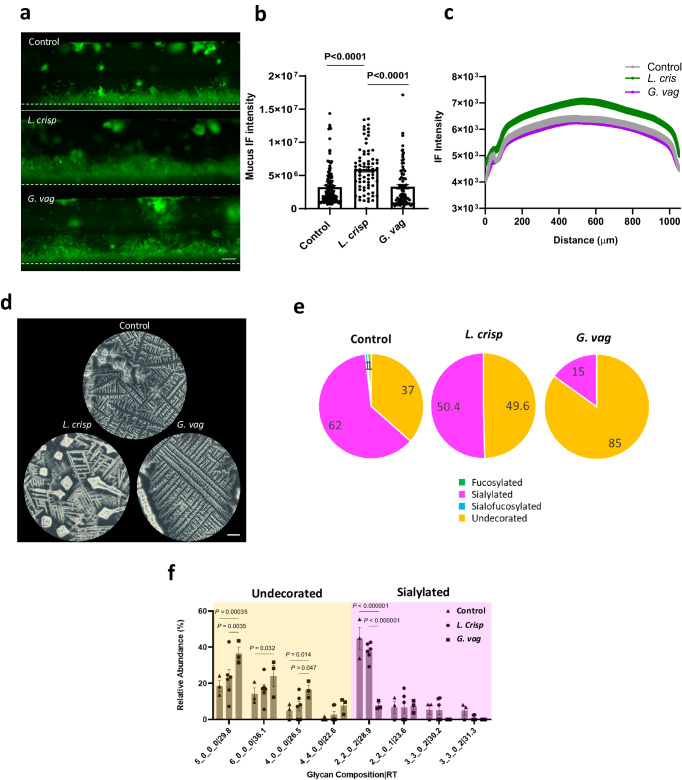
Modulation of the cervix by steroid hormones and commensal microbiome play a central role in the health of the female reproductive tract. Here we describe organ-on-a-chip (Organ Chip) models that recreate the human cervical epithelial-stromal interface with a functional epithelial barrier and production of mucus with biochemical and hormone-responsive properties similar to living cervix. When Cervix Chips are populated with optimal healthy versus dysbiotic microbial communities (dominated by Lactobacillus crispatus and Gardnerella vaginalis, respectively), significant differences in tissue innate immune responses, barrier function, cell viability, proteome, and mucus composition are observed that are similar to those seen in vivo. Thus, human Cervix Organ Chips represent physiologically relevant in vitro models to study cervix physiology and host-microbiome interactions, and hence may be used as a preclinical testbed for development of therapeutic interventions to enhance women's health.


Conflict of interest statement

D.E.I. holds equity in Emulate, chairs its scientific advisory board and is a member of its board of directors. The remaining authors declare no competing interests.

Figures

Fig. 1
Fig. 1. Development and characterization of human ecto-and endo-cervix chips.
a Schematic top (left) and cross-sectional views (right) of the dual channel microfluidic organ chip lined by human cervical epithelium interfaced across an ECM-coated porous membrane with human cervical fibroblasts. b Phase-contrast microscopic view from above of a Cervix Chip lined by cervical epithelium and fibroblasts on the apical and basal sides of the chip porous membrane, respectively, on day 1 (left) as well as after 12 days of culture under continuous (middle) or periodic (right) flow (bar, 200 μm). c Side view, dark field images of living Cervix Chip hours after cell seeding day 0 (top) and after 7 days of differentiation (bottom). White arrow indicates light reflective mucus accumulating above the differentiated epithelium (bar, 1 mm). d Fluorescence microscopic side views of mucus layers in live Cervix Chip cultures stained with fluorescent wheat germ agglutinin (WGA) (green) on day 7 of differentiation under continuous (top) and periodic (bottom) flow regimens (bar, 1 mm). e Immunofluorescence microscopic view from above of the cervical epithelium stained for mucin 5B (MUC5B, green), F-actin (yellow), and nuclei with Hoechst (blue) (bar, 50 μm) stained at day 7 of differentiation. f Immunofluorescence microscopic vertical cross sectional view of the chip showing the cervical epithelium stained for MUC5B (green) overlaying the porous membrane, the underlying layer of fibroblasts stained for vimentin (yellow), and Hoechst-stained nuclei (blue) (bar, 20 μm). g Quantification of the total mucin content produced by Cervix Chips cultured under continuous (black symbols) or periodic (white symbols) flow measured at days 0 and 7 of differentiation. h Cytokine proteins in effluents of Cervix Chips cultured under continuous (gray bars) or periodic flow (white bars) on day 0 versus 7 of differentiation. i RNAseq analysis of genes expressed in cervical epithelial cells from three different donors differentiated in static Transwells or Cervix Chips under periodic or continuous flow. Expression levels of the signature genes associated with the endo- and ecto-cervical epithelial cells were compared using Z-scores calculated per donor across samples for the three flow conditions, emphasizing common trends among samples of different donors (colors represent gene expression levels; each column represents one of the three donors). Data represent the mean ± s.e.m.; n = 3 (periodic flow) and 5 (continuous flow) (g), 4 (continuous flow) and 5 (periodic flow) (h), and 3 (i) experimental chip replicates. Micrographs in (bf) are representatives of three separate experiments. Source data and statistical tests are provided as a Source Data file. Left image in (a) was created with BioRender.com.
Fig. 2
Fig. 2. Recapitulation of the compositional properties of cervical mucus.
a Glycomic analysis showing representative O- and N-glycan profiles of mucus produced by cervical epithelial cells cultured in Transwells or Cervix Chips exposed to periodic or continuous flow compared to a clinical sample of human mucus. The compound peaks are color coded to show the glycan subtypes and numbered to represent the glycan molecules structures: (#_#_#_#) format represents number of core structure type 1_number of core structure type 2_number of glycan subtype 1_number of glycan subtype 2. b Tables showing the most abundant O- and N-glycan subtypes observed in the mucus profiles of human clinical samples compared with Cervix Chips exposed to periodic or continuous flow (combined peaks) versus Transwell cultures.
Fig. 3
Fig. 3. Recapitulation of cervical mucus responses to physiological pH and sex hormones in the Cervix Chip.
a (Left) Dark field (top) and fluorescence (bottom) side views of unlabeled and WGA-stained (green) mucus in live Cervix Chips cultured at pH 7.1 compared to pH 5.4. Double headed dashed arrows show mucus thickness (bar, 200 μm). (Right) Graph showing changes in the % of area containing WGA-stained mucus in the apical epithelium channel. b Graph showing fold change in expression of cervical epithelial genes encoding mucin 4 (MUC4) and secretory leukocyte peptidase inhibitor (SLPI) in Cervix Chips cultured at pH 7.1 and pH 5.4. c Graph showing TNF-α level in Cervix Chips cultured at pH 5.4 compared to 7.1. d Fluorescence side view micrographs of WGA-stained mucus (green) in live cervix chips showing increased mucus layer thickness when cultured with high estrogen (follicular, 5 nM E2 + 0 nM P4) compared to high progesterone (luteal, 0.5 nM E2 + 50 nM P4) levels (double headed arrows show mucus thickness (bar, 200 μm)). e Total mucus content (mucus thickness x immunofluorescence intensity) measured in live Cervix Chips cultured under different hormonal conditions shown in (d). f Bright field images of the mucus Fern Test collected from Cervix Chips under high estrogen compared to high progesterone hormone conditions (bar, 200 μm). g Cytokine secretion levels measured in cervix chips under high estrogen (HE, 5 nM E2 + 0 nM P4) compared to high progesterone (0.5 nM E2 + 50 nM P4) hormone conditions. h Changes in tissue barrier function in the Cervix Chip measured using transepithelial electrical resistance (TEER) under high estrogen versus high progesterone hormone levels using the TEER sensor-integrated chip (red arrow indicate start of hormone treatment). i Dynamic changes in the epithelial barrier function when hormones are changed from follicular to luteal conditions at day 6 of differentiation (red arrow indicates time that hormone treatment switches from follicular to luteal conditions). Data represents the mean ± s.e.m.; n = 13 (a) 5 (b) 4 (c) 6 (e) 5 (g) and 3 (h, i) experimental chip replicates for each group. Source data and statistical tests are provided as a Source Data file.
Fig. 4
Fig. 4. Modeling cervical epithelial host interactions with L. crispatus and G. vaginalis consortia in Cervix Chips.
a Phase-contrast (Top) and immunofluorescence (bottom) microscopic views from above of the Cervix Chip co-cultured with L. crispatus consortia. (Top) Phase-contrast microscopic view (left) and higher magnification image (right) of live chip cervical epithelium colonized with L. crispatus bacteria. (Bottom) Immunofluorescence micrographs of cervical epithelium stained for MUC5B (green) (left), nuclei with Hoechst (blue) (middle) and the overlay image (right) (Black and white arrows show L. crispatus bacteria colonized on-chip (bar, 50 μm)). b Immunofluorescence micrographs of cervical epithelium stained for F-actin (yellow) and nuclei with Hoechst (blue) in Cervix Chip co-cultured with no bacteria (left), L. crispatus (middle) and G. vaginalis (right) (White arrows show G. vaginalis bacteria colonized on the epithelium (bar, 50 μm)). c Enumeration of the total non-adherent (Effluent; white bar) and adherent (Digest; gray bar) bacteria in the Cervix Chip during and at the end of co-culture, respectively, with the L. crispatus or G. vaginalis consortia compared to the initial inoculum in the Cervix Chip. d Graph showing percentage change in the viability of cervical epithelial cells after 72 h of co-culture with L. crispatus or G. vaginalis consortia in the Cervix Chip compared to control chip without bacteria. e Graph showing fold change in the cervix Chip barrier permeability during co-culture time with L. crispatus or G. vaginalis consortia compared to non-inoculated, control chip as measured by apparent permeability (Papp). f Heat map showing Cervix Chip epithelium innate immune response to L. crispatus or G. vaginalis consortia at 72 h post inoculation quantified by levels of IL-1α, IL1-β, IL-6, IL-8, and TNF-α, in the epithelial channel effluents. The color-coded scale represents LOG10 fold change in cytokine levels over control chip. g Proteomic analysis showing significantly up- (red) and down- (blue) regulated proteins in the cervical epithelial cells on-chip in response to G. vaginalis and L. crispatus consortia as compared to control chips without bacteria, as well as to each other. P ≤ 0.05, log2FC ≥ |0.58| for all the presented protein gene symbols. Data represent the mean ± s.e.m.; n = 10 (c) 6 (d) 10 (e) 10 (f) and 3 (g) experimental chip replicates for each group. Micrographs in (a, b) are representatives of three separate experiments. Source data and statistical tests are provided as a Source Data file.
Fig. 5
Fig. 5. Modeling modulation of cervical mucus with L. crispatus and G. vaginalis consortia on Cervix Chip.
a Fluorescence side view micrographs of WGA-stained mucus (green) in live Cervix Chips co-cultured with L. crispatus (middle) or G. vaginalis (bottom) compared to control chip (top) without bacteria (white dashed line indicates porous membrane) (bar, 200 μm). b Total mucus content (mucus thickness x immunofluorescence intensity) measured in live Cervix Chips cultured with L. crispatus or G. vaginalis compared to non-inoculated control chip. c Graph showing the spatial distribution of the live mucus immunofluorescence intensity along the width of the epithelial channel in the Cervix Chip co-cultured with L. crispatus or G. vaginalis consortia compared to control chip. d Bright field images of the mucus Fern Test collected from Cervix Chips co-cultured with L. crispatus or G. vaginalis consortia compared to control chip without bacteria (bar, 200 μm). e Pie charts representing the relative abundances of O-glycan types in the Cervix Chip mucus after 72 h of co-culture with L. crispatus or G. vaginalis consortia compared to control chip without bacteria quantified using nanoscale liquid chromatography quadrupole time-of-flight coupled to tandem mass spectrometry (nanoLC-QTOF MS/MS). f Relative abundance of undecorated and sialylated O-glycans in the Cervix Chip mucus collected after 72 h of co-culture with L. crispatus or G. vaginalis consortia compared to control chip. Data represent the mean ± s.e.m.; n = 120 fields of view from 3 (b) and 6 (f) experimental chip replicates for each group. Micrographs in (a) are representatives of six separate experiments for each group. Source data and statistical tests are provided as a Source Data file.

References

    1. Ravel J, et al. Vaginal microbiome of reproductive-age women. Proc. Natl Acad. Sci. USA. 2011;108:4680–4687. doi: 10.1073/pnas.1002611107. - DOI - PMC - PubMed
    1. Bradshaw CS, Sobel JD. Current treatment of bacterial vaginosis-limitations and need for innovation. J. Infect. Dis. 2016;214:S14–S20. doi: 10.1093/infdis/jiw159. - DOI - PMC - PubMed
    1. Peebles K, Velloza J, Balkus JE, McClelland RS, Barnabas RV. High global burden and costs of bacterial vaginosis: a systematic review and meta-analysis. Sex. Transm. Dis. 2019;46:304–311. doi: 10.1097/OLQ.0000000000000972. - DOI - PubMed
    1. Myer L, et al. Intravaginal practices, bacterial vaginosis, and women’s susceptibility to HIV infection: epidemiological evidence and biological mechanisms. Lancet Infect. Dis. 2005;5:786–794. doi: 10.1016/S1473-3099(05)70298-X. - DOI - PubMed
    1. Cherpes TL, Meyn LA, Krohn MA, Lurie JG, Hillier SL. Association between acquisition of herpes simplex virus type 2 in women and bacterial vaginosis. Clin. Infect. Dis. 2003;37:319–325. doi: 10.1086/375819. - DOI - PubMed