. 2024 May 29;15(1):4564.
doi: 10.1038/s41467-024-48956-0.

Development of a novel non-invasive biomarker panel for hepatic fibrosis in MASLD

Affiliations

Development of a novel non-invasive biomarker panel for hepatic fibrosis in MASLD

Lars Verschuren et al. Nat Commun. .

Abstract

Accurate non-invasive biomarkers to diagnose metabolic dysfunction-associated steatotic liver disease (MASLD)-related fibrosis are urgently needed. This study applies a translational approach to develop a blood-based biomarker panel for fibrosis detection in MASLD. A molecular gene expression signature identified from a diet-induced MASLD mouse model (LDLr-/-.Leiden) is translated into human blood-based biomarkers based on liver biopsy transcriptomic profiles and protein levels in MASLD patient serum samples. The resulting biomarker panel consists of IGFBP7, SSc5D and Sema4D. LightGBM modeling using this panel demonstrates high accuracy in predicting MASLD fibrosis stage (F0/F1: AUC = 0.82; F2: AUC = 0.89; F3/F4: AUC = 0.87), which is replicated in an independent validation cohort. The overall accuracy of the model outperforms predictions by the existing markers Fib-4, APRI and FibroScan. In conclusion, here we show a disease mechanism-related blood-based biomarker panel with three biomarkers which is able to identify MASLD patients with mild or advanced hepatic fibrosis with high accuracy.


Conflict of interest statement

The authors declare no competing interests.

TNO has a patent filed for the use of protein biomarkers for NAFLD (Inventors: L.V., A.v.K., and R.H.). Other authors declare no competing interests.

Figures

Fig. 1
Fig. 1. HFD feeding in LDLr−/−.Leiden mice results in obesogenic phenotype.
a Body weight in chow-fed (white bars; n = 6) and HFD-fed (gray bars; n = 15) LDLr−/−.Leiden mice after 24 weeks (P = 0.025); b ALT levels (pooled plasma of 3 mice; n = 2 for chow; n = 2 for HFD; P = 0.002); c AST levels (pooled plasma of 3 mice; n = 2 for chow; n = 2 for HFD; P = 0.02); d Hepatic cholesterol ester concentration (n = 6 for chow; n = 14 for HFD; P < 0.0001); e Hepatic free cholesterol concentration (n = 6 for chow; n = 14 for HFD; P < 0.0001); f Hepatic triglyceride concentration (n = 6 for chow; n = 14 for HFD; P < 0.0001). Values are shown in box and whisker plots, data are median (horizontal line), interquartile range (boxes), and min. to max. (error bars); Data consist of biological replicates where HFD-fed mice are compared to control chow-fed mice. A two-sided Student’s t-test was used to test the statistical significance; *p < 0.01.
Fig. 2
Fig. 2. HFD feeding induces liver pathology associated to MASH.
a Macrovesicular steatosis in chow-fed (white bars; n = 6) and HFD-fed (gray bars; n = 14) LDLr−/−.Leiden mice after 24 weeks (P < 0.0001); b Number of inflammatory aggregates (n = 6 for chow; n = 14 for HFD; P = 0.01); c Perisinusoidal fibrosis area (n = 5 for chow; n = 14 for HFD; P = 0.02). Values are shown as floating bars (min. to max.), line indicates mean. Data consist of biological replicates where HFD-fed mice are compared to control chow-fed mice. A two-sided Student’s t-test with Welch’s correction was used to test the statistical significance; *p < 0.05.
Fig. 3
Fig. 3. Molecular effects in liver tissue.
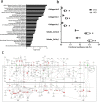
a Top selected pathways affected in HFD-fed mice as compared to chow-fed mice. b Box and Whisker plot showing fractional synthesis rate of collagens in liver of chow- or HFD-fed mice (collagen1α2, P = 0.007; collagen3α1, P = 0.004; collagen1α1, P = 0.014; soluble collagen1α2, P = 0.001; soluble collagen1α2, P = 0.001) after 24 weeks of treatment (n = 3 chow and n = 4 HFD). Data are median (vertical line), interquartile range (boxes) and 10–90% percentile (error bars). A two-sided Student’s t-test was used to test the statistical significance; *p < 0.01. c Visualization of significant genes up- (red) and down (green) regulated in the Hepatic Fibrosis Pathway in HFD-fed mice as compared to chow-fed control mice.
Fig. 4
Fig. 4. Translational gene markers in human biopsies.
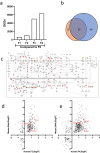
a Quantification of differentially expressed liver genes in MASLD patients across various fibrosis stages (P < 0.01). b Comparative analysis of pathway overlaps between stages F3 (orange) and F4 (blue) against stage F0. c Visualization of the Hepatic Fibrosis Signaling Pathway using DEGs in F4 patients as compared to F0 (P < 0.01). d, e Dual-axis log2-FoldChange plots showing signature genes that exhibit differential expression in both mouse models (24 weeks, HFD vs. chow) and human MASLD patients (stages F3 and F4 vs. F0). The 11 selected biomarkers are highlighted as red-colored genes with the selection of 3 biomarkers specifically named.
Fig. 5
Fig. 5. Biomarker selection.
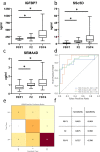
Box and Whisker plot showing feature importance list of the machine learning model, showing the contribution of each of the 11 serum biomarkers to the classification into fibrosis groups in 128 patients of the testing cohort. Data are median (vertical line), interquartile range (boxes) and 10–90% percentile (error bars). The diamonds indicate outliers.
Fig. 6
Fig. 6. Biomarker verification in an independent cohort.
Serum levels of a IGFBP7, b SSc5D, c SEMA4D in samples from 128 patients with MASLD fibrosis score (F0–F4) in testing cohort (F0/F1, n = 38; F2, n = 38; F3/F4, n = 52). Values from biological replicates are shown in box and whisker plots, data are median (horizontal line), interquartile range (boxes) and 10–90% percentile (error bars). A two-sided Student’s t-test was used to test the statistical significance. *p < 0.05, vs. F0/F1 samples. d AUROC curve to show the predictive value of this set of biomarkers to distinguish the individual MASLD fibrosis F-scores (F0–F1 versus F2 versus F3–F4); e Confusion matrix of the hold-out set (n = 8 F0/F1; n = 8 F2; n = 22 F3/F4) of predicted and true classes; f Sensitivity and specificity as calculated from the LGBM classifier Confusion Matrix.
Fig. 7
Fig. 7. Biomarker validation in a second independent cohort.
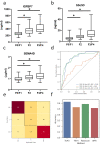
Serum levels of a IGFBP7, b SSc5D, c SEMA4D as measured in samples from 156 patients from the independent validation cohort from Denmark (F0/F1, n = 66; F2, n = 30; F3/F4, n = 60). Values are shown in box and whisker plots, data are median (horizontal line), interquartile range (boxes) and 10–90% percentile (error bars). A two-sided Student’s t-test was used to test the statistical significance. *p < 0.05, vs. F0/F1 samples. d AUROC curve to show the predictive value of this set of biomarkers to distinguish the individual MASLD fibrosis F-scores (F0/F1 versus F2 versus F3/F4). e Confusion matrix of the hold-out set of predicted and true classes. f Overview of model performances (accuracy) of different NITs in predicting fibrosis.

References

    1. Riazi K, et al. The prevalence and incidence of NAFLD worldwide: a systematic review and meta-analysis. Lancet Gastroenterol. Hepatol. 2022;7:851–861. doi: 10.1016/S2468-1253(22)00165-0. - DOI - PubMed
    1. Rinella, M. E. et al. A multi-society Delphi consensus statement on new fatty liver disease nomenclature. J. Hepatol. 78, 1966-1986 (2003). - PubMed
    1. Younossi ZM, et al. Global epidemiology of nonalcoholic fatty liver disease-Meta-analytic assessment of prevalence, incidence, and outcomes. Hepatology. 2016;64:73–84. doi: 10.1002/hep.28431. - DOI - PubMed
    1. Taylor RS, et al. Association between fibrosis stage and outcomes of patients with nonalcoholic fatty liver disease: a systematic review and meta-analysis. Gastroenterology. 2020;158:1611–1625.e12. doi: 10.1053/j.gastro.2020.01.043. - DOI - PubMed
    1. Hagström H, et al. Fibrosis stage but not NASH predicts mortality and time to development of severe liver disease in biopsy-proven NAFLD. J. Hepatol. 2017;67:1265–1273. doi: 10.1016/j.jhep.2017.07.027. - DOI - PubMed

MeSH terms

Substances