. 2024 May 29;14(1):12350.
doi: 10.1038/s41598-024-61908-4.

Identification of modules and key genes associated with breast cancer subtypes through network analysis

Affiliations

Identification of modules and key genes associated with breast cancer subtypes through network analysis

María Daniela Mares-Quiñones et al. Sci Rep. .

Abstract

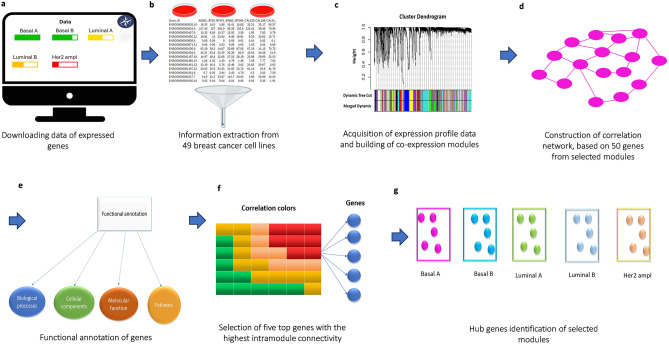
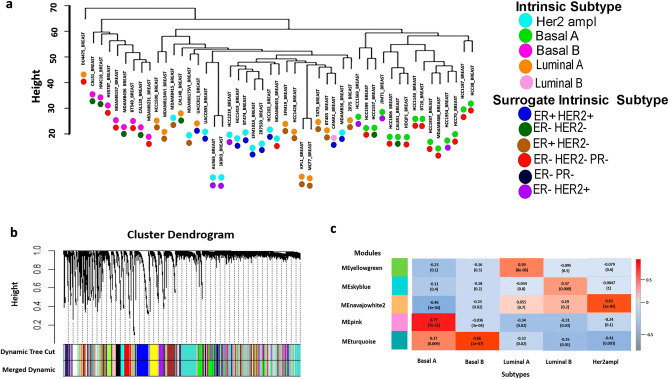
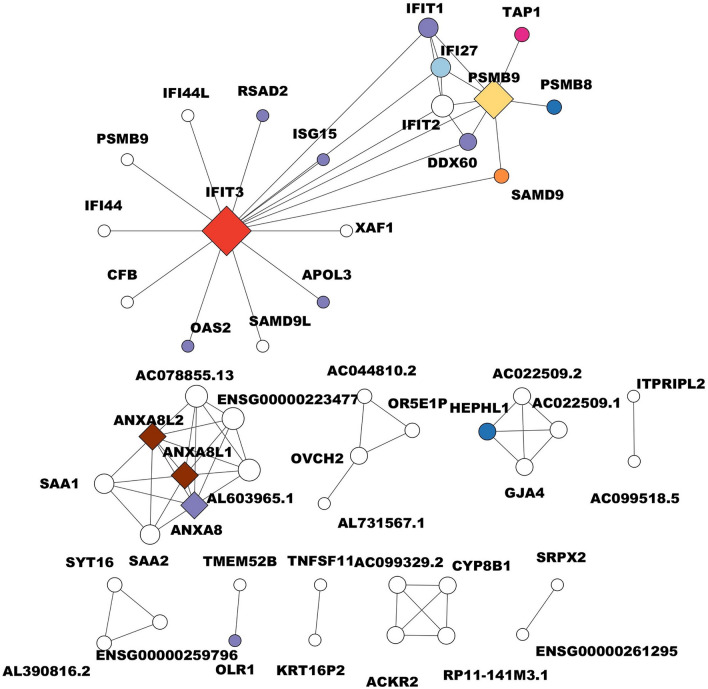
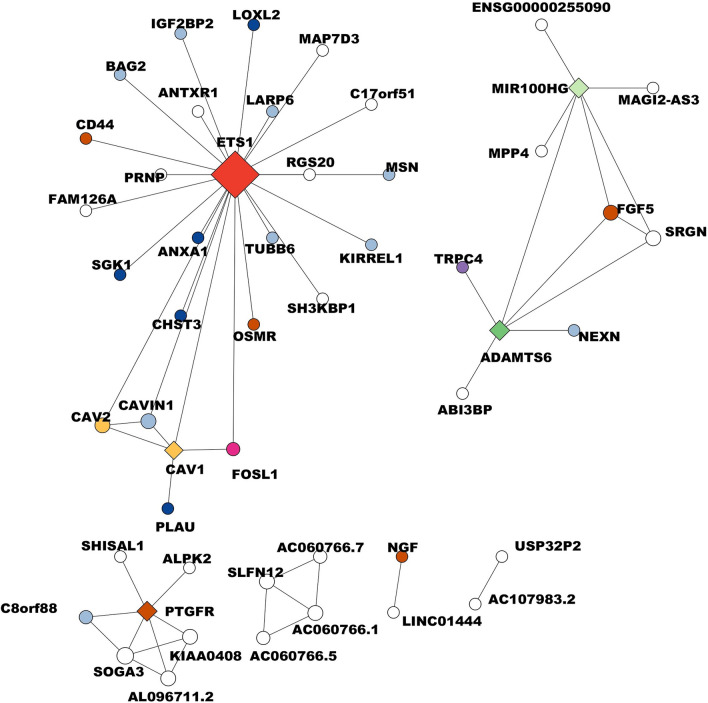
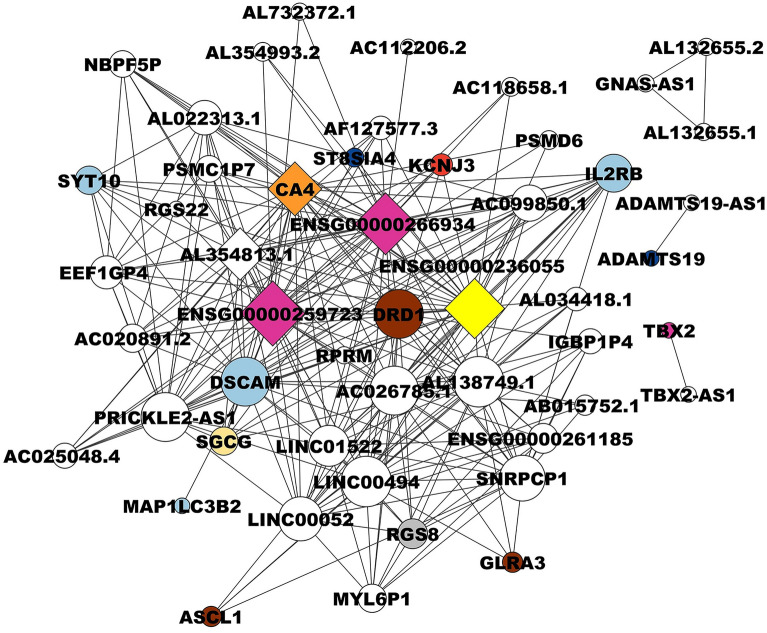
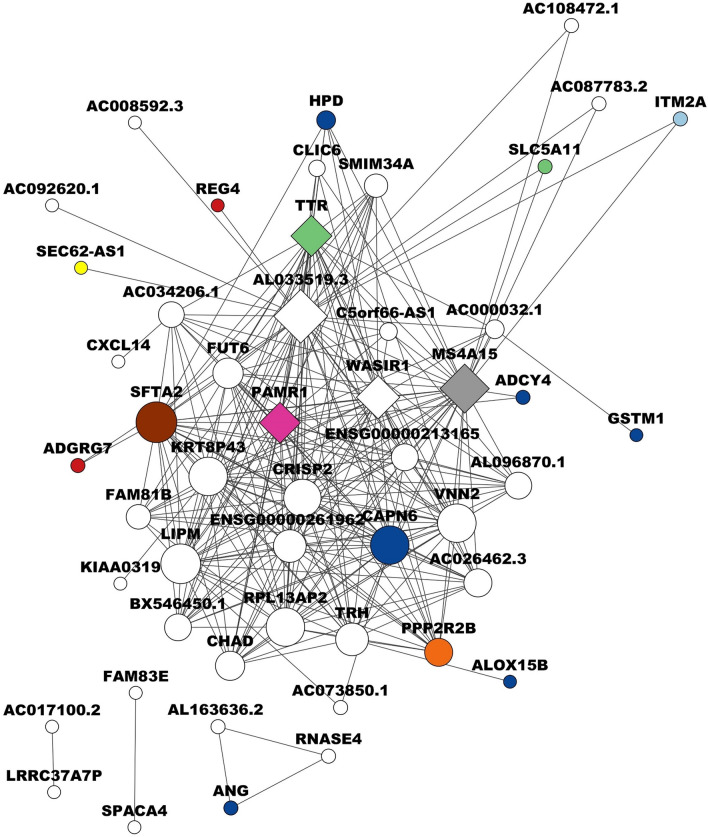
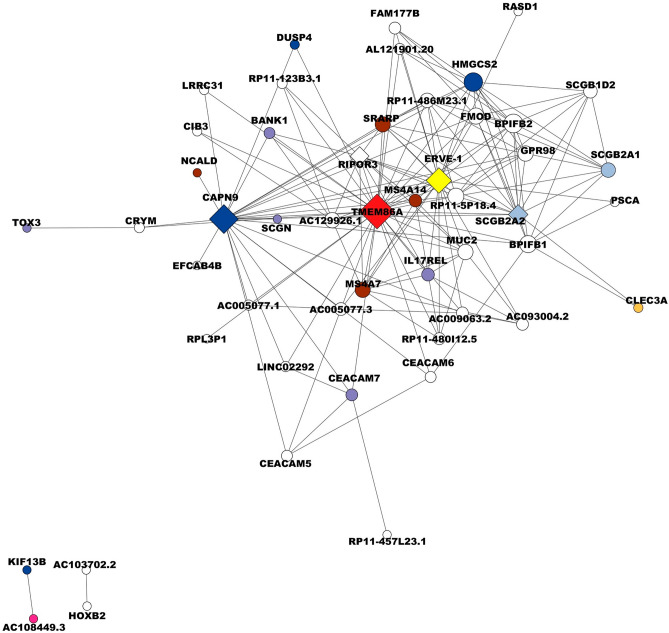
Breast cancer is the most common malignancy in women around the world. Intratumor and intertumoral heterogeneity persist in mammary tumors. Therefore, the identification of biomarkers is essential for the treatment of this malignancy. This study analyzed 28,143 genes expressed in 49 breast cancer cell lines using a Weighted Gene Co-expression Network Analysis to determine specific target proteins for Basal A, Basal B, Luminal A, Luminal B, and HER2 ampl breast cancer subtypes. Sixty-five modules were identified, of which five were characterized as having a high correlation with breast cancer subtypes. Genes overexpressed in the tumor were found to participate in the following mechanisms: regulation of the apoptotic process, transcriptional regulation, angiogenesis, signaling, and cellular survival. In particular, we identified the following genes, considered as hubs: IFIT3, an inhibitor of viral and cellular processes; ETS1, a transcription factor involved in cell death and tumorigenesis; ENSG00000259723 lncRNA, expressed in cancers; AL033519.3, a hypothetical gene; and TMEM86A, important for regulating keratinocyte membrane properties, considered as a key in Basal A, Basal B, Luminal A, Luminal B, and HER2 ampl breast cancer subtypes, respectively. The modules and genes identified in this work can be used to identify possible biomarkers or therapeutic targets in different breast cancer subtypes.


Conflict of interest statement

The authors declare no competing interests.

Figures

Figure 1
Figure 1
Workflow diagram outlining the proposed method for identifying modules and key genes associated with breast cancer subtypes using gene co-expression networks. (a) Initially, gene expression data from breast cancer cell lines were retrieved from the DepMap database version 21Q1. (b) A comprehensive analysis was then conducted on 49 breast cancer cell lines to obtain specific details about gene expression in these cell lines. (c) Next, a gene co-expression network was reconstructed based on the processed expression profiles using the WGCNA package in the R programming environment, resulting in 65 modules. (d) Subsequently, the module with the highest correlation for each breast cancer subtype (pink, turquoise, yellowgreen, skyblue, and navajowhite2) was selected to construct a correlation network consisting of 50 highly correlated genes from each chosen module. The software used for this process was Cytoscape. (e) Gene Ontology (GO) and Kyoto Encyclopedia of Genes and Genomes (KEGG) were then utilized to perform functional analyses aiming to understand the biological functions and metabolic pathways associated with the genes in the module. (f) The top five genes with the highest intramodule connectivity were identified. (g) Finally, the hub genes within each module were identified for each subtype of breast cancer.
Figure 2
Figure 2
Weighted gene co-expression network analysis. (a) Clustering analysis to remove outliers. Sample dendrogram and trait indicator. Each color circle represents an SBC, five intrinsic subtypes, and six surrogate intrinsic subtype. (b) Network analysis of gene expression in BC identifying distinct modules of co-expression genes. (c) Correlations between module eigengenes and different SBCs with only the most significant module. The most correlated modules are shown for each SBC.
Figure 3
Figure 3
Basal A breast cancer subtype correlation network. The circles in the network represent different biological functions, each color-coded for easy identification. Dark blue circles represent catalytic activity, pink circles represent ATP-dependent activity, and brown circles represent calcium-binding proteins. Purple circles indicate binding functions, while yellow circles are involved in antigen processing to generate class I binding peptides. Red circles represent defense or immunity proteins, light blue circles represent signaling functions, and green circles represent transported activity. Lastly, orange circles represent the regulation of cell proliferation and apoptosis. The diamond shapes in the network represent hub genes, which are genes that have a high degree of connectivity in the network and play a crucial role in the biological processes. The size of each node (circle or diamond) corresponds to the number of connections or the degree of involvement in biological processes. Larger nodes have more connections, indicating a higher degree of involvement in various biological processes.
Figure 4
Figure 4
Basal B breast cancer subtype correlation network. The circles in the network symbolize different biological functions, each distinguished by a unique color. Dark blue circles represent catalytic activity, pink circles represent transcriptional regulator activity, and brown circles symbolize molecular transduction activity. Light blue circles indicate binding functions, while yellow circles are associated with molecular adaptor activity. Red circles represent gene-specific transcriptional regulators, purple circles indicate transporter activity, green circles represent modifying enzymes, and light green circles indicate regulators of cell proliferation. The diamond shapes in the network represent hub genes. These are genes that have a high degree of connectivity within the network and play a significant role in the biological processes. The size of each node, whether a circle or diamond, corresponds to the number of connection degrees involved in biological processes. Larger nodes have more connections, indicating a higher degree of involvement in various biological processes.
Figure 5
Figure 5
Representation of a correlation network for the Luminal A subtype of breast cancer. Visualising the relationships between different biological functions and hub genes. The circles in the network represent different biological functions, each distinguished by a unique color. Dark blue circles denote catalytic activity, pink circles represent transcriptional regulator activity, and brown circles symbolize molecular transduction activity. Light blue circles indicate binding functions, while orange circles are associated with metabolite interconversion enzyme activity. Red circles represent transporter activity, purple circles indicate transmembrane signal receptor activity, yellow circles indicate cytoskeletal protein functions, and gray circles represent protein-binding activity modulators. The diamond shapes in the network represent hub genes, which are genes with a high degree of connectivity within the network, indicating their important role in the biological processes. The size of each node, whether a circle or diamond, corresponds to the number of connection degrees involved in biological processes. Larger nodes have more connections, indicating a higher degree of involvement in various biological processes.
Figure 6
Figure 6
Correlation network for the Luminal B subtype of breast cancer. The circles in the network symbolize different biological functions, each distinguished by a unique color. Dark blue circles denote catalytic activity, pink circles represent proliferation inhibitor activity, and brown circles symbolize disease-susceptibility for panbronchiolitis. Light blue circles indicate binding functions, while orange circles are associated with molecular function regulator activity. Red circles represent molecular transducer activity, green circles denote transporter activity, and gray circles represent signal transduction functions. The diamond shapes in the network represent hub genes. These are genes that have a high degree of connectivity within the network, indicating their significant role in the biological processes. The size of each node, whether a circle or diamond, corresponds to the number of connection degrees involved in biological processes. Larger nodes have more connections, indicating a higher degree of involvement in various biological processes.
Figure 7
Figure 7
Visualisation of a correlation network for the HER2 ampl subtype of breast cancer. The circles in the network represent different biological functions, each distinguished by a unique color. Dark blue circles denote catalytic activity, pink circles represent ATP-dependent activity, and brown circles symbolize biological regulation. Purple circles indicate binding functions, while yellow circles are associated with multicellular organismal processes. Red circles represent functions linked to autosomal recessive congenital ichthyosis, and light blue circles denote signaling functions. The diamond shapes in the network represent hub genes, which have a high degree of connectivity within the network, indicating their important role in biological processes. The size of each node, whether a circle or diamond, corresponds to the number of connection degrees involved in biological processes. Larger nodes have more connections, indicating a higher degree of involvement in various biological processes. This image is a valuable tool for visualizing complex biological interactions and understanding the role of different functions and genes in HER2 ampl.

Similar articles

Cited by

References

    1. World Health Organization. Breast cancer, accessed 12 April 2021; https://www.who.int/news-room/fact-sheets/detail/breast-cancer (2021).
    1. Henderson Craig I. Breast Cancer Fundamentals of Evidence-Based Disease Management. Oxford University Press; 2015. pp. 1–23.
    1. Dunnwald LK, Rossing MA, Li CI. Hormone receptor status, tumor characteristics, and prognosis: A prospective cohort of breast cancer patients. Breast Cancer Res. 2007;9:R6. doi: 10.1186/bcr1639. - DOI - PMC - PubMed
    1. Harbeck N, et al. Breast cancer. Nat. Rev. Dis. Primers. 2019;5:66. doi: 10.1038/s41572-019-0111-2. - DOI - PubMed
    1. Lüönd F, Tiede S, Christofori G. Breast cancer as an example of tumour heterogeneity and tumour cell plasticity during malignant progression. Br. J. Cancer. 2021;125:164–175. doi: 10.1038/s41416-021-01328-7. - DOI - PMC - PubMed

Substances