

Projected patterns of land uses in Africa under a warming climate
- PMID: 38811602
- PMCID: PMC11136982
- DOI: 10.1038/s41598-024-61035-0
Projected patterns of land uses in Africa under a warming climate
Abstract
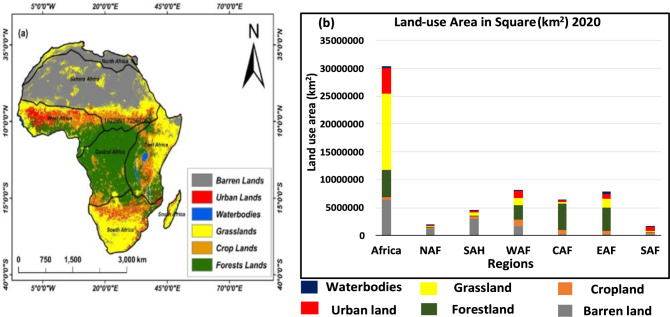
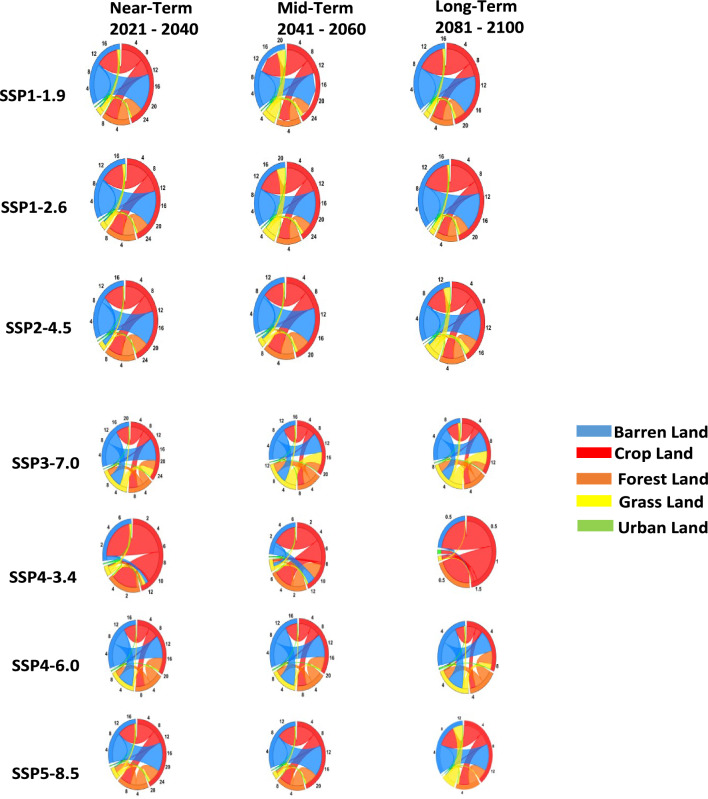
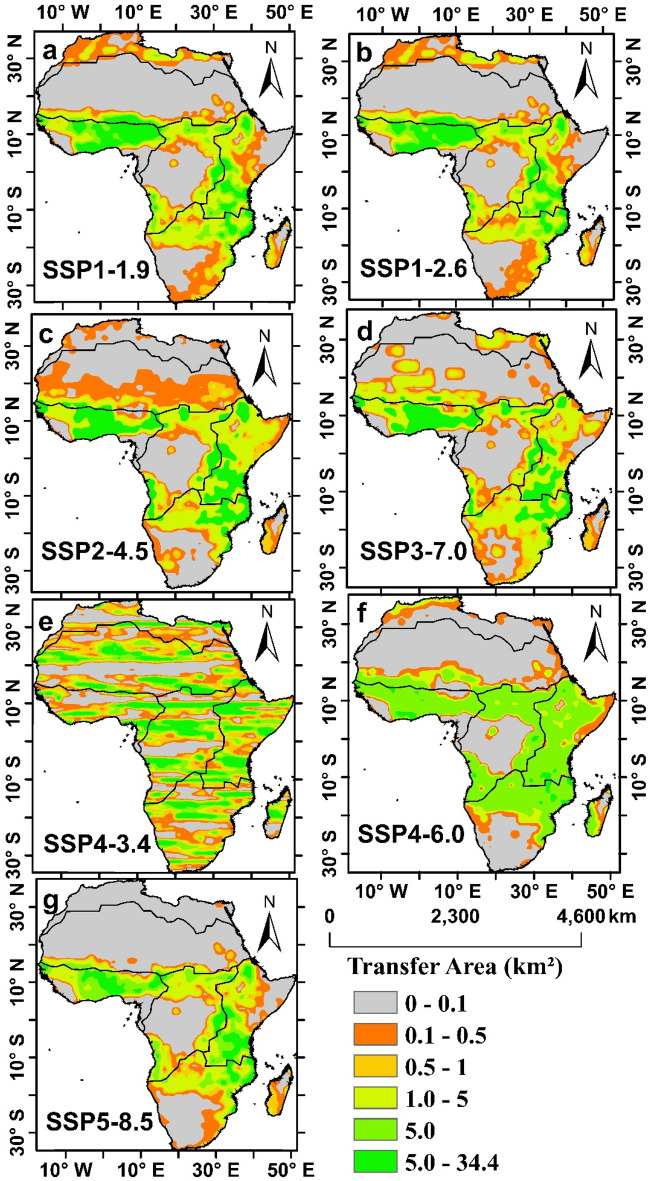
Land-use change is a direct driver of biodiversity loss, projection and future land use change often consider a topical issue in response to climate change. Yet few studies have projected land-use changes over Africa, owing to large uncertainties. We project changes in land-use and land-use transfer under future climate for three specified time periods: 2021-2040, 2041-2060, and 2081-2100, and compares the performance of various scenarios using observational land-use data for the year 2020 and projected land-use under seven Shared Socioeconomic Pathways Scenarios (SSP): SSP1-1.9, SSP1-2.6, SSP2-4.5, SSP3-7.0, SSP4-3.4, SSP4-6.0 and SSP5-8.5 from 2015 to 2100 in Africa. The observational land-use types for the year 2020 depict a change and show linear relationship between observational and simulated land-use with a strong correlation of 0.89 (P < 0.01) over Africa. Relative to the reference period (1995-2014), for (2021-2040), (2041-2060), (2081-2100), barren land and forest land are projected to decrease by an average of (6%, 11%, 16%), (9%, 19%, 38%) respectively, while, crop land, grassland and urban land area are projected to increase by (36%, 58%, and 105%), (4%, 7% and 11%), and (139%, 275% and 450%) respectively. Results show a substantial variations of land use transfer between scenarios with major from barren land to crop land, for the whole future period (2015-2100). Although SSP4-3.4 project the least transfer. Population and GDP show a relationship with cropland and barren land. The greatest conversion of barren land to crop land could endanger biodiversity and have negative effects on how well the African continent's ecosystem's function.
© 2024. The Author(s).
Conflict of interest statement
The authors declare no competing interests.
Figures


References
-
- Ahmed KF, et al. Potential impact of climate and socioeconomic changes on future agricultural land use in West Africa. Earth Syst. Dyn. 2016;7(1):151–165. doi: 10.5194/esd-7-151-2016. - DOI
-
- Lambin EF, Geist HJ, Lepers E. Dynamics of land-use and land-cover change in tropical regions. Annu. Rev. Environ. Resour. 2003;28(1):205–241. doi: 10.1146/annurev.energy.28.050302.105459. - DOI
Grants and funding
- Grant no. 42261144002/This study was supported by the International Cooperation Program between the National Science Foundation of China (NSFC) and the United Nations Environment Program (UNEP)
- GZ 1486/The Cooperation Project of Cooperation Group (GZ 1486) in the Chinese and German Center of the Research Promotion, NSFC/DFG
LinkOut - more resources
Full Text Sources
