

Tuning pore size and density of rigid polylactic acid foams through thermally induced phase separation and optimization using response surface methodology
- PMID: 38811650
- PMCID: PMC11137040
- DOI: 10.1038/s41598-024-62958-4
Tuning pore size and density of rigid polylactic acid foams through thermally induced phase separation and optimization using response surface methodology
Abstract
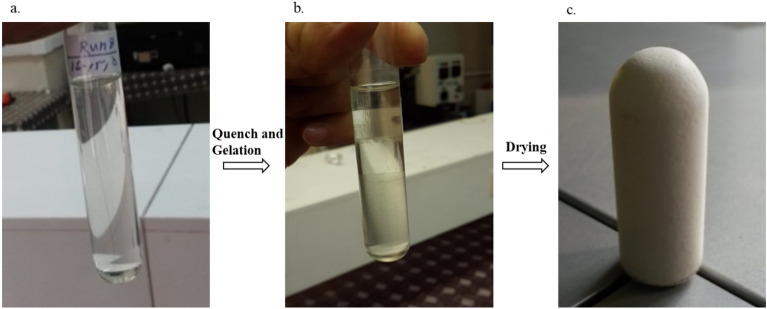
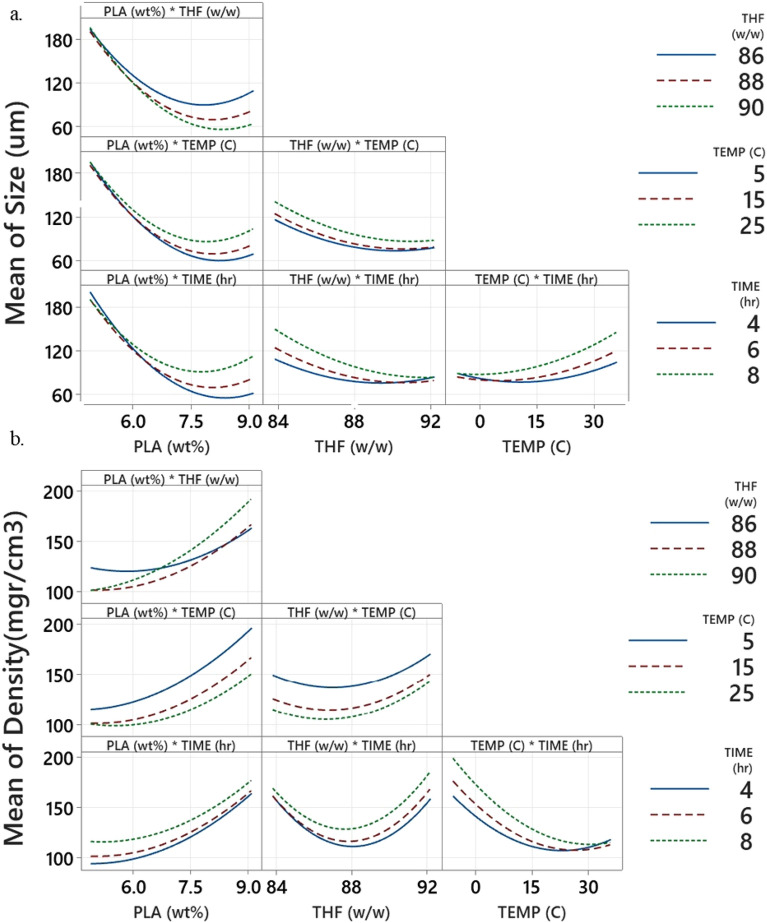
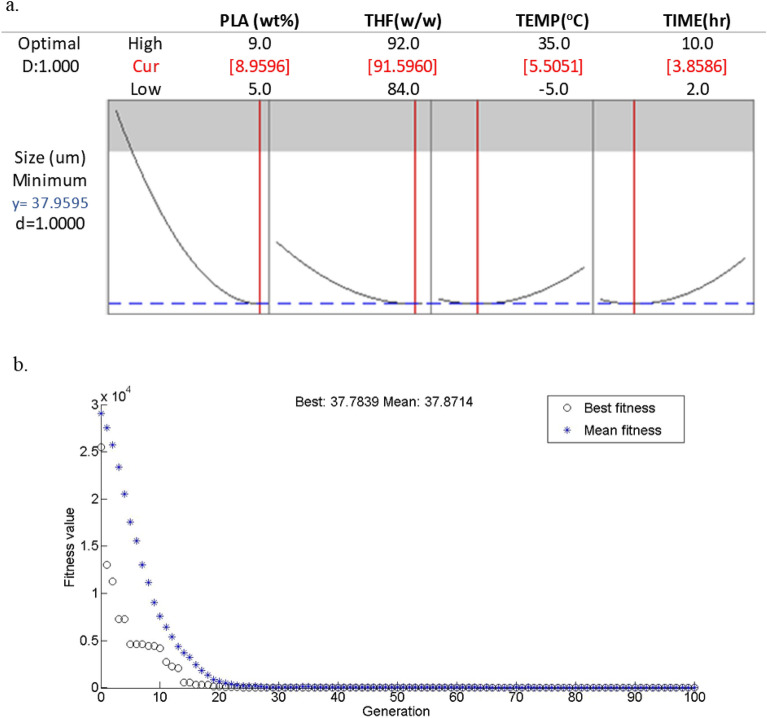
Rigid polylactic acid (PLA) foams fabricated via thermally induced phase separation (TIPS) utilizing a ternary solution of PLA, Tetrahydrofuran (THF), and water. The PLA gels were stabilized mechanically by the substituting of the THF/water solvent mixture with ethanol as non-solvent and subsequently vacuum dried. A comprehensive characterization of PLA foams was achieved by Scanning Electron Microscopy (SEM), X-ray Diffractometry (XRD) and Brunauer-Emmett-Teller (BET) analyses. The BET area obtained in the PLA foam is up to 18.76 m2/g. The Response Surface Methodology (RSM) was utilized to assess the impacts of four independent variables (polymer concentration, solvent composition, quench temperature, and aging time) on the pore size and density of PLA foam. The experimental findings demonstrated that the fabrication parameters could be fine-tuned to govern the morphology of the pores, comprising their size and density. The optimal values of parameters for cell size were identified by RSM to be 8.96 (wt%), 91.60 (w/w), 5.50 °C, and 3.86 h for the optimum cell size of 37.96 µm (37.78 by Genetic Algorithm). Optimum density by RSM 88.88 mgr/cm3 (88.38 mgr/cm3 by Genetic Algorithm) was obtained at 5.00 (wt%), 89.33 (w/w), 14.40 °C and 2.65 h.
Keywords: Foam; Morphology; Phase separation; Polylactic acid; Response surface.
© 2024. The Author(s).
Conflict of interest statement
The authors declare no competing interests.
Figures


Similar articles
-
Effect of some factors on fabrication of poly(L-lactic acid) microporous foams by thermally induced phase separation using N,N-dimethylacetamide as solvent.Prep Biochem Biotechnol. 2011;41(1):53-72. doi: 10.1080/10826068.2010.534222. Prep Biochem Biotechnol. 2011. PMID: 21229464
-
Biodegradable polymeric microcellular foams by modified thermally induced phase separation method.Biomaterials. 1999 Oct;20(19):1783-90. doi: 10.1016/s0142-9612(99)00073-3. Biomaterials. 1999. PMID: 10509188
-
Preparation, characterization, and in vitro degradation of bioresorbable and bioactive composites based on Bioglass-filled polylactide foams.J Biomed Mater Res A. 2003 Aug 1;66(2):335-46. doi: 10.1002/jbm.a.10587. J Biomed Mater Res A. 2003. PMID: 12889004
-
The Preparation of Superhydrophobic Polylactic Acid Membrane with Adjustable Pore Size by Freeze Solidification Phase Separation Method for Oil-Water Separation.Molecules. 2023 Jul 22;28(14):5590. doi: 10.3390/molecules28145590. Molecules. 2023. PMID: 37513463 Free PMC article.
-
Meso-microporous activated carbon derived from Raffia palm shells: optimization of synthesis conditions using response surface methodology.Heliyon. 2021 Jun 12;7(6):e07301. doi: 10.1016/j.heliyon.2021.e07301. eCollection 2021 Jun. Heliyon. 2021. PMID: 34189325 Free PMC article.
Cited by
-
Design of polyurethane composite foam obtained from industrial PET wastes and MXenes for EMI shielding applications.RSC Adv. 2024 Nov 20;14(50):37202-37215. doi: 10.1039/d4ra07447e. eCollection 2024 Nov 19. RSC Adv. 2024. PMID: 39569114 Free PMC article.
References
-
- Ali W, Ali H, Gillani S, Zinck P, Souissi S. Polylactic acid synthesis, biodegradability, conversion to microplastics and toxicity: A review. Environ. Chem. Lett. 2023;21:1761–1786. doi: 10.1007/s10311-023-01564-8. - DOI
-
- Litauszki K, Gere D, Czigany T, Kmetty A. Environmentally friendly packaging foams: Investigation of the compostability of poly(lactic acid)-based syntactic foams. Sustain. Mater. Technol. 2023;35:e525. doi: 10.1016/j.susmat.2022.e00527. - DOI
-
- Narancic T, Verstichel S, Reddy ChS, Morales GL, Kenny ST, Dewilde B, Babu PR, Oconnor KE. Biodegradable plastic blends create new possibilities for end-of-life management of plastics but they are not a panacea for plastic pollution. Environ. Sci. Technol. 2018;52:10441–10452. doi: 10.1021/acs.est.8b02963. - DOI - PubMed
LinkOut - more resources
Full Text Sources
