3D imaging of SARS-CoV-2 infected hamster lungs by X-ray phase contrast tomography enables drug testing
- PMID: 38811688
- PMCID: PMC11137149
- DOI: 10.1038/s41598-024-61746-4
3D imaging of SARS-CoV-2 infected hamster lungs by X-ray phase contrast tomography enables drug testing
Abstract
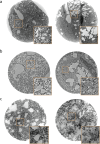
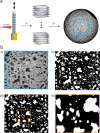
X-ray Phase Contrast Tomography (XPCT) based on wavefield propagation has been established as a high resolution three-dimensional (3D) imaging modality, suitable to reconstruct the intricate structure of soft tissues, and the corresponding pathological alterations. However, for biomedical research, more is needed than 3D visualisation and rendering of the cytoarchitecture in a few selected cases. First, the throughput needs to be increased to cover a statistically relevant number of samples. Second, the cytoarchitecture has to be quantified in terms of morphometric parameters, independent of visual impression. Third, dimensionality reduction and classification are required for identification of effects and interpretation of results. To address these challenges, we here design and implement a novel integrated and high throughput XPCT imaging and analysis workflow for 3D histology, pathohistology and drug testing. Our approach uses semi-automated data acquisition, reconstruction and statistical quantification. We demonstrate its capability for the example of lung pathohistology in Covid-19. Using a small animal model, different Covid-19 drug candidates are administered after infection and tested in view of restoration of the physiological cytoarchitecture, specifically the alveolar morphology. To this end, we then use morphometric parameter determination followed by a dimensionality reduction and classification based on optimal transport. This approach allows efficient discrimination between physiological and pathological lung structure, thereby providing quantitative insights into the pathological progression and partial recovery due to drug treatment. Finally, we stress that the XPCT image chain implemented here only used synchrotron radiation for validation, while the data used for analysis was recorded with laboratory CT radiation, more easily accessible for pre-clinical research.
© 2024. The Author(s).
Conflict of interest statement
The authors declare no competing interests.
Figures


Similar articles
-
3D virtual pathohistology of lung tissue from Covid-19 patients based on phase contrast X-ray tomography.Elife. 2020 Aug 20;9:e60408. doi: 10.7554/eLife.60408. Elife. 2020. PMID: 32815517 Free PMC article.
-
Human lung virtual histology by multi-scale x-ray phase-contrast computed tomography.Phys Med Biol. 2023 May 30;68(11). doi: 10.1088/1361-6560/acd48d. Phys Med Biol. 2023. PMID: 37167977
-
Three-dimensional structure of entire hydrated murine hearts at histological resolution.Sci Rep. 2025 Jan 22;15(1):2766. doi: 10.1038/s41598-024-83853-y. Sci Rep. 2025. PMID: 39843542 Free PMC article.
-
Thoracic imaging tests for the diagnosis of COVID-19.Cochrane Database Syst Rev. 2020 Nov 26;11:CD013639. doi: 10.1002/14651858.CD013639.pub3. Cochrane Database Syst Rev. 2020. Update in: Cochrane Database Syst Rev. 2021 Mar 16;3:CD013639. doi: 10.1002/14651858.CD013639.pub4. PMID: 33242342 Updated.
-
A narrative review on characterization of acute respiratory distress syndrome in COVID-19-infected lungs using artificial intelligence.Comput Biol Med. 2021 Mar;130:104210. doi: 10.1016/j.compbiomed.2021.104210. Epub 2021 Jan 18. Comput Biol Med. 2021. PMID: 33550068 Free PMC article. Review.
Cited by
-
3D multiscale characterization of the human placenta: Bridging anatomy and histology by X-ray phase-contrast tomography.PNAS Nexus. 2025 Jan 3;4(1):pgae583. doi: 10.1093/pnasnexus/pgae583. eCollection 2025 Jan. PNAS Nexus. 2025. PMID: 39831153 Free PMC article.
References
-
- Töpperwien M. 3d virtual histology of neuronal tissue by propagation-based x-ray phase-contrast tomography. Göttingen Series in x-ray Physics. Göttingen: (Göttingen University Press; 2018.
-
- Svetlove A, et al. X-ray phase-contrast 3D virtual histology characterises complex tissue architecture in colorectal cancer. Frontiers in Gastroenterology. 2023 doi: 10.3389/fgstr.2023.1283052. - DOI
MeSH terms
Grants and funding
- Project-ID 432680300 - SFB 1456/Deutsche Forschungsgemeinschaft
- Project-ID 432680300 - SFB 1456/Deutsche Forschungsgemeinschaft
- Project-ID 432680300 - SFB 1456/Deutsche Forschungsgemeinschaft
- Project-ID 432680300 - SFB 1456/Deutsche Forschungsgemeinschaft
- Project-ID 432680300 - SFB 1456/Deutsche Forschungsgemeinschaft
LinkOut - more resources
Full Text Sources
Medical
Research Materials
Miscellaneous

