. 2024 Nov;29(11):3567-3579.
doi: 10.1038/s41380-024-02604-7. Epub 2024 May 29.

Diffusion imaging genomics provides novel insight into early mechanisms of cerebral small vessel disease

Affiliations

Diffusion imaging genomics provides novel insight into early mechanisms of cerebral small vessel disease

Quentin Le Grand et al. Mol Psychiatry. 2024 Nov.

Abstract

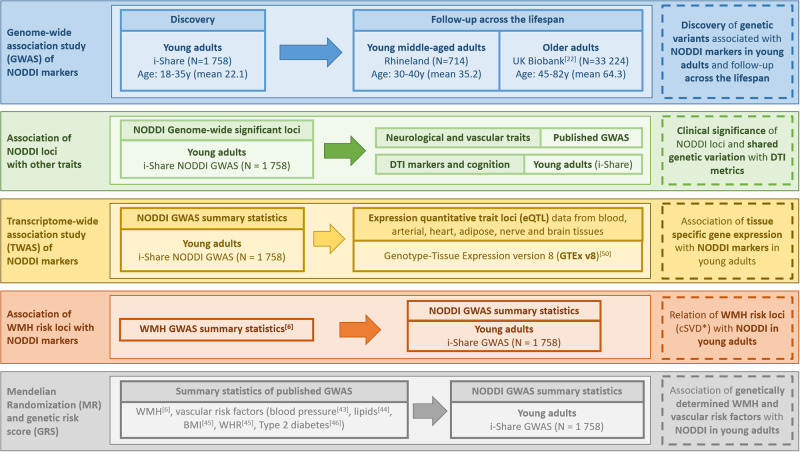
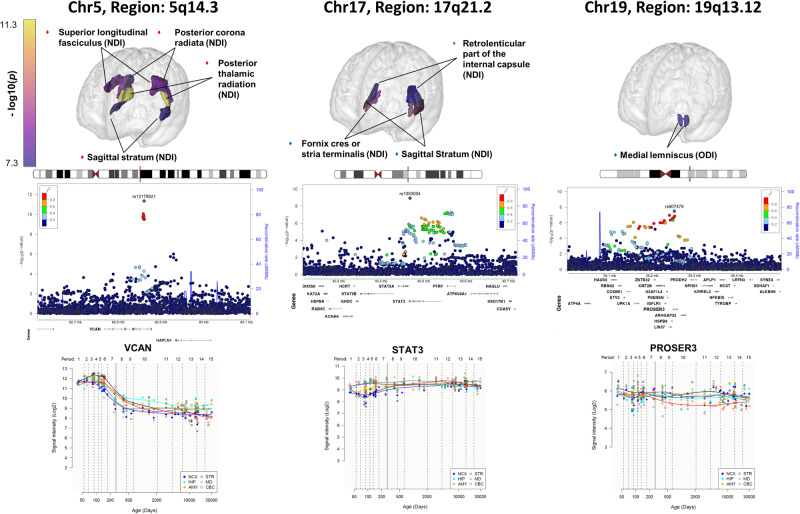
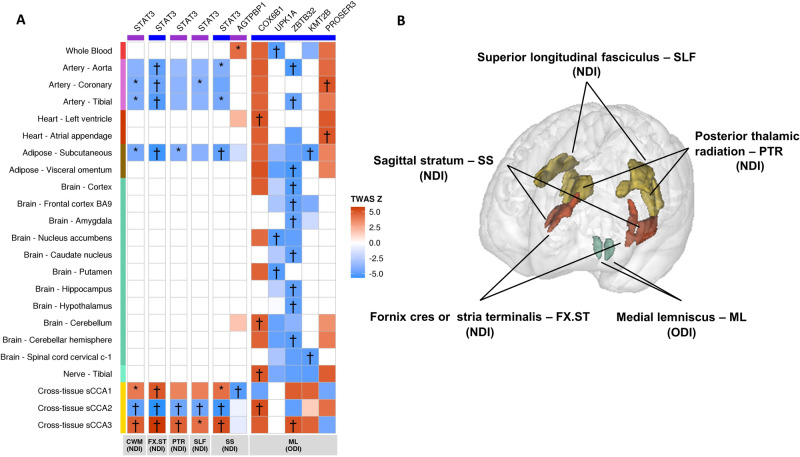
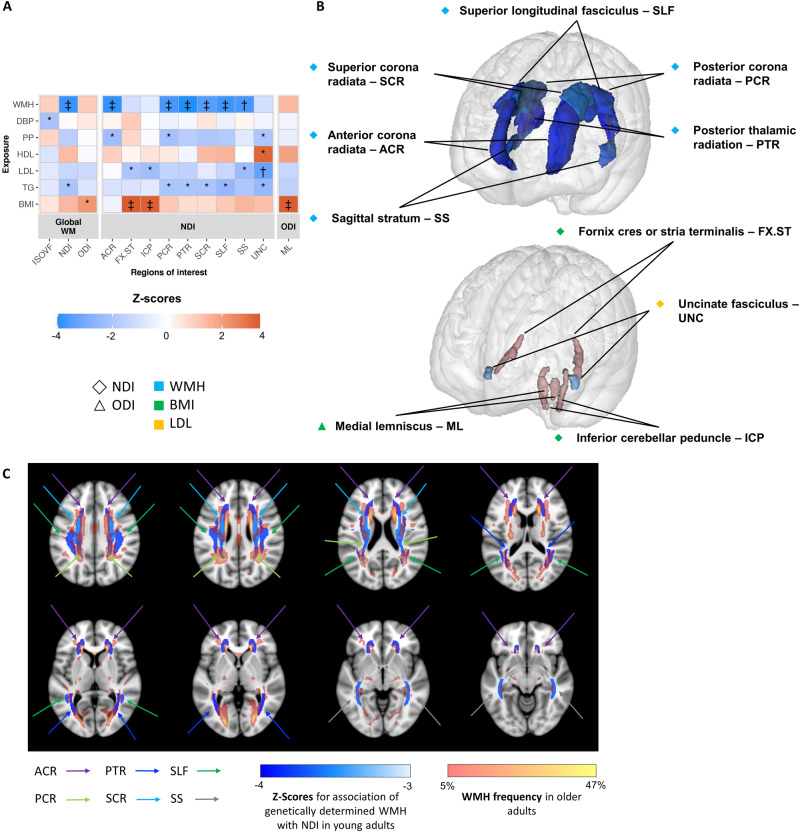
Cerebral small vessel disease (cSVD) is a leading cause of stroke and dementia. Genetic risk loci for white matter hyperintensities (WMH), the most common MRI-marker of cSVD in older age, were recently shown to be significantly associated with white matter (WM) microstructure on diffusion tensor imaging (signal-based) in young adults. To provide new insights into these early changes in WM microstructure and their relation with cSVD, we sought to explore the genetic underpinnings of cutting-edge tissue-based diffusion imaging markers across the adult lifespan. We conducted a genome-wide association study of neurite orientation dispersion and density imaging (NODDI) markers in young adults (i-Share study: N = 1 758, (mean[range]) 22.1[18-35] years), with follow-up in young middle-aged (Rhineland Study: N = 714, 35.2[30-40] years) and late middle-aged to older individuals (UK Biobank: N = 33 224, 64.3[45-82] years). We identified 21 loci associated with NODDI markers across brain regions in young adults. The most robust association, replicated in both follow-up cohorts, was with Neurite Density Index (NDI) at chr5q14.3, a known WMH locus in VCAN. Two additional loci were replicated in UK Biobank, at chr17q21.2 with NDI, and chr19q13.12 with Orientation Dispersion Index (ODI). Transcriptome-wide association studies showed associations of STAT3 expression in arterial and adipose tissue (chr17q21.2) with NDI, and of several genes at chr19q13.12 with ODI. Genetic susceptibility to larger WMH volume, but not to vascular risk factors, was significantly associated with decreased NDI in young adults, especially in regions known to harbor WMH in older age. Individually, seven of 25 known WMH risk loci were associated with NDI in young adults. In conclusion, we identified multiple novel genetic risk loci associated with NODDI markers, particularly NDI, in early adulthood. These point to possible early-life mechanisms underlying cSVD and to processes involving remyelination, neurodevelopment and neurodegeneration, with a potential for novel approaches to prevention.


Conflict of interest statement

PMM is a member of the Steering Committee of UK Biobank. The authors report no other competing interests.

Figures

Fig. 1
Fig. 1. Study workflow.
* WMH risk loci reflect genetic susceptibility to cerebral small vessel disease (cSVD). BMI Body mass index, DTI Diffusion tensor imaging, NODDI Neurite orientation dispersion and density imaging, WHR Waist-to-hip ratio adjusted for BMI; WMH White matter hyperintensities.
Fig. 2
Fig. 2. Representation of brain regions showing associations with the replicated loci in NODDI marker GWAS with regional plots and lifetime brain gene expression profile of the nearest genes.
The first line shows the localization of the 3 regions with significant and replicated signals in GWAS: chr5q14.3, chr17q21.2 and chr19q13.12. Colors of bullet points on brain projection represent the replication of the loci: red if replicated in all studies, blue for i-Share and UK Biobank, and gray for i-Share only. The second line represents the localization of each locus on the chromosome, combined with a regional plot of the locus. The third line represents the spatio-temporal gene expression level for the nearest gene in each locus (VCAN, STAT3 and PROSER3 respectively). It is plotted as log2-transformed exon array signal intensity (y-axis) against the post conception days (x-axis) as provided by the Human Brain Transcriptome project database. Periods of human development and adulthood are indicated by vertical dashed lines: 4–8 post conception weeks [PCW] (period 1), 8–10 PCW (period 2), 10–13 PCW (period 3), 13–16 PCW (period 4), 16–19 PCW (period 5), 19-24 PCW (period 6), 24-38 PCW (period 7), birth- 6 postnatal months (period 8), 6–12 postnatal months (period 9), 1–6 years (period 10), 6–12 years (period 11), 12–20 years (period 12), 20–40 years (period 13), 40–60 years (period 14), and 60 years+ (period 15). The boundary between pre- and postnatal periods is indicated by the solid vertical line. Each colored point represents the expression level of each gene across 16 anatomical brain regions and ages. Brain structure includes 11 neocortical areas (NCX, blue), and 5 subcortical regions: hippocampus (HIP, cyan), amygdala (AMY, orange), striatum (STR, black), mediodorsal nucleus of thalamus (MD, dark green), and cerebellar cortex (CBC, red). NDI Neurite Density Index, ODI Orientation Dispersion Index, ISOVF Isotropic Volume Fraction.
Fig. 3
Fig. 3. Transcriptome-wide association study (TWAS) of NODDI phenotypes in multiple tissues.
A Heatmap of the transcriptome-wide association studies of NODDI markers with genome-wide significant loci in the i-Share study and replicated in the Rhineland study or UK Biobank. Colors in squares represent the association Z-statistic of gene expression with NODDI markers. *: TWAS p < 1 × 10−4, p < 0.05 in conditional analyses and COLOC-PP4 > 0.75. † TWAS p < 7.8 × 10−6, p < 0.05 in conditional analyses and COLOC-PP4 > 0.75. Only genes with † in at least one tissue for the corresponding phenotype are shown. Genes are presented on the x-axis, those underlined in blue are in a GWAS locus, those underlined in purple are not; Tissue types are on the y-axis (orange: blood; pink: arterial; dark orange: heart; brown: adipose, green: brain; turquoise blue: nerve; gold: cross-tissue weights). sCCA Sparse canonical correlation analysis. B Brain representation of regions presenting associations with † in (A), with colors representing the types of tissues as on (A). NDI Neurite Density Index, ODI Orientation Dispersion Index, ISOVF Isotropic Volume Fraction.
Fig. 4
Fig. 4. Association of genetically-predicted neurovascular traits and vascular risk factors with NODDI metrics in young adults.
A Heatmap of the association of neurovascular traits and vascular risk factors with NODDI metrics in young adults using genetic risk score and Mendelian randomization approaches. Only regions of interest with p < 1.27 × 10-3 in GRS analyses and p < 0.05 with at least one method between RadialMR IVW (after removing outliers) and GSMR are shown. Only exposures with p < 0.05 in GRS analyses in at least one region of interest are shown. Z-scores correspond to the effect of the GRS of the exposures on the NODDI phenotypes. *p < 0.05 with GRS. p < 1.27 × 10−3 with GRS and p < 0.05 with at least one method between RadialMR IVW (after removing outliers) and GSMR. p < 1.27 × 10-3 with GRS and p < 0.05 with both RadialMR IVW and GSMR. B Projection of significant results on the brain map. Only significant results († or ‡ on A) are projected on the brain map. For both A and B, colors depend on the Z-score values. C Overlap with brain regions mostly affected by WMH in older age. The same significant regions for NDI results shown on (B), on axial multi-slices to show the overlap with regions affected by WMH in older age; blue scale: Z-score values corresponding to the effect of the GRS for WMH on NDI metrics in young adults (i-Share study); pink to yellow scale: frequency of WMH occurrence in older adults in their seventies (3C). ISOVF Isotropic Volume Fraction, NDI Neurite Density Index, ODI Orientation Dispersion Index, WM White matter, WMH White matter hyperintensities, DBP diastolic blood pressure, PP pulse pressure, HDL HDL-cholesterol, LDL LDL-cholesterol, TG triglycerides, BMI body mass index.

Similar articles

Cited by

References

    1. Alber J, Alladi S, Bae H-J, Barton DA, Beckett LA, Bell JM, et al. White matter hyperintensities in vascular contributions to cognitive impairment and dementia (VCID): Knowledge gaps and opportunities. Alzheimers Dement Transl Res Clin Interv. 2019;5:107–17. - PMC - PubMed
    1. Pasi M, Cordonnier C. Clinical relevance of cerebral small vessel diseases. Stroke. 2020;51:47–53. - PubMed
    1. Chauhan G, Adams HHH, Satizabal CL, Bis JC, Teumer A, Sargurupremraj M, et al. Genetic and lifestyle risk factors for MRI-defined brain infarcts in a population-based setting. Neurology. 2019;92:e486–e503. 10.1212/WNL.0000000000006851 - PMC - PubMed
    1. Debette S, Schilling S, Duperron M-G, Larsson SC, Markus HS. Clinical significance of magnetic resonance imaging markers of vascular brain injury: a systematic review and meta-analysis. JAMA Neurol. 2019;76:81–94. - PMC - PubMed
    1. Mishra A, Chauhan G, Violleau M-H, Vojinovic D, Jian X, Bis JC, et al. Association of variants in HTRA1 and NOTCH3 with MRI-defined extremes of cerebral small vessel disease in older subjects. Brain. 2019;142:1009–23. - PMC - PubMed

LinkOut - more resources