. 2024 Jul;631(8019):232-239.
doi: 10.1038/s41586-024-07488-9. Epub 2024 May 29.

High-resolution in situ structures of mammalian respiratory supercomplexes

Affiliations

High-resolution in situ structures of mammalian respiratory supercomplexes

Wan Zheng et al. Nature. 2024 Jul.

Abstract

Mitochondria play a pivotal part in ATP energy production through oxidative phosphorylation, which occurs within the inner membrane through a series of respiratory complexes1-4. Despite extensive in vitro structural studies, determining the atomic details of their molecular mechanisms in physiological states remains a major challenge, primarily because of loss of the native environment during purification. Here we directly image porcine mitochondria using an in situ cryo-electron microscopy approach. This enables us to determine the structures of various high-order assemblies of respiratory supercomplexes in their native states. We identify four main supercomplex organizations: I1III2IV1, I1III2IV2, I2III2IV2 and I2III4IV2, which potentially expand into higher-order arrays on the inner membranes. These diverse supercomplexes are largely formed by 'protein-lipids-protein' interactions, which in turn have a substantial impact on the local geometry of the surrounding membranes. Our in situ structures also capture numerous reactive intermediates within these respiratory supercomplexes, shedding light on the dynamic processes of the ubiquinone/ubiquinol exchange mechanism in complex I and the Q-cycle in complex III. Structural comparison of supercomplexes from mitochondria treated under different conditions indicates a possible correlation between conformational states of complexes I and III, probably in response to environmental changes. By preserving the native membrane environment, our approach enables structural studies of mitochondrial respiratory supercomplexes in reaction at high resolution across multiple scales, from atomic-level details to the broader subcellular context.


Conflict of interest statement

The authors declare no competing interests.

Figures

Fig. 1
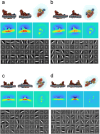
Fig. 1. In situ single-particle cryo-EM and cryo-ET analysis of mammalian mitochondrial respiratory SCs.
a,b, Grid preparation of porcine mitochondria. Mitochondria were extracted from porcine hearts treated under different conditions (fresh, mild and harsh) (a) and directly frozen on to cryo-EM grids (b) for subsequent in situ imaging. c, A representative image of porcine mitochondria under low magnification. Hole diameter, 2 μm. d, Representative cryo-EM micrograph of mitochondria for single-particle analysis (SPA). Scale bar, 20 nm. e, Representative 2D class averages showing different types of SC after 3D classification. f,g, Representative tomographic slices (f) and corresponding subvolume averages (g) of a reconstructed tomogram (Tomo). Scale bar, 100 nm. h,i, Side (h) and top (i) views of a representative high-resolution map of an SC in the native mitochondrial inner membrane. j, A molecular model of the high-resolution SC with the surrounding membrane built. k, High-resolution features shown by representative density of amino acid residues and endogenous ligands. CDL, cardiolipin.
Fig. 2
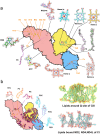
Fig. 2. Architecture, membrane curvature and interaction interfaces of the four types of respiratory SC.
a, Top and side views and cartoon models of SCs I1III2IV1, I1III2IV2, I2III2IV2 and I2III4IV2 with models of the surrounding membranes. These views highlight the impact of different SC compositions on local membrane curvature. b, Contour maps of the native membrane around the four main types of SC, viewed from the mitochondrial matrix side. Red and blue indicate high and low altitudes, respectively. These gradients clearly demonstrate the common feature in which the membranes surrounding the CI heel and CIII2 regions are convex and concave, respectively. They also show distinct local curvature differences among the four types. c, Interaction interfaces among CI (pink), CIII2 (light yellow) and CIV (light blue) in type-A SC. Blue mesh represents the density maps of lipid molecules filling the interstitial space among these complexes. d, Representative local density maps and atomic modes of lipids built in the interface between CIII2 and CIV.
Fig. 3
Fig. 3. High-resolution in situ structures reveal multiple Q/QH2 binding states within the Q-binding channel.
a, Cartoon models of CI active-apo state, with subunits constituting the Q-binding channel highlighted. b, Variations in distances between the Q10 headgroup and membrane surfaces across fully occupied, two intermediate, and half-occupied states. The height of the membrane surface was estimated using the average of lipid headgroups surrounding the CI ‘heel’. c, Spatial positioning of Q10 within the Q-binding channel for the four distinct binding states. d, Comparisons of three other binding states with the fully occupied Q10 (transparent stick). The distance from the Q10 headgroup to the quinone-binding channel entrance varied among different binding states. e, Schematic depiction of the silkworm-like undulatory motion of Q10 within the Q-binding channel.
Fig. 4
Fig. 4. Dynamic intermediates of CIII2 revealed by high-resolution in situ cryo-EM.
a, The structures resolve all reactive centres. b, The endogenous Q10 and lipid molecules in the CIII2 Q-binding pocket and around the pocket entrance. These lipids are organized in a relatively ordered manner. c, Different views of the hydrogen-bonded network and the water chains for proton transfer. Red and purple spheres denote waters in the two branches of the bifurcated proton-influx path, whereas cyan spheres indicate waters in the single-wired proton-influx path. d, Schematic illustration of (1) bifurcated proton-influx path, (2) single-wired proton-influx path and (3) proton-outflow path. e, Structural details of the Qo-binding site in the most abundant class. E271MTCYB displays dual conformations in this class. Q10 and amino acids are coloured purple and green, respectively. Blue spheres denote waters in the proton-outflow path near the Qo site. f, Comparison of E271 conformations between the apo-form CIII (PDB: 1NTK) and its complex with Qo inhibitor stigmatellin (PDB: 2A06) from the same view as shown in e. g, Structural details of the Q-binding site in state I with the closest distance to [2Fe–2S]. h, Four main Q-bound states of CIII as revealed by high-resolution in situ structures. The Rieske domain sequentially moves from b position to c position to shuttle electrons. This movement is coupled with the Q-binding state at the Qo site. Density maps for Q10 headgroups are shown as blue mesh, whereas those for the Rieske domain and cyt c1 are represented as transparent surfaces. i, Schematic representation of the coupling of ISP movement to Q-binding states.
Extended Data Fig. 1
Extended Data Fig. 1. Schematic Overview of Initial Single-Particle Cryo-EM Data Analysis Workflow.
a, High-magnification micrograph exemplifying a typical single-particle cryo-EM sample. b, Preliminary results of reference-free 2D classification. c, Representative outcomes of 2D sub-classification focused on particles displaying discernible side views of mitochondrial membranes. d, Illustrative 2D classification of mitochondrial supercomplex particles derived from the prior 2D classes; features reveal distinct concave membrane morphologies in the CIII2 regions. e, Exemplary 2D class averages after extensive particle sorting and membrane signal weakening. f-h, 3D reconstructions generated using particles selected from steps (c), (d), and (e), respectively. i, Typical results of the iterative cross-3D classification. Reference maps and particle classification/alignment parameters were progressively refined over multiple cycles. Upon reaching this stage, reliable 3D reference models were obtained for subsequent multi-level refinement and focused classification. Particles classified into SCs were merged for all ensuing data processing steps.
Extended Data Fig. 2
Extended Data Fig. 2. Evaluation of the 3D classification by post-3D-refinement 2D classification.
a-d, Atomic models (top) from three representative views, the corresponding projections from the same orientations (middle) and representative reference-free 2D class averages of type-A (a), -B (b), -O (c) and -X (d) SCs after 3D classification and refinement.
Extended Data Fig. 3
Extended Data Fig. 3. Water molecules in CI, CIII2, and CIV.
a-c, The water molecules bound in CI, CIII2 and CIV. Blue dots represent water molecules in the hydrophilic regions, while red dots indicate water molecules near the hydrophobic regions. The core subunits of CI, CIII2 and CIV are color-coded as shown in the figure.
Extended Data Fig. 4
Extended Data Fig. 4. Endogenous cofactors and representative structured lipids revealed by the high resolution in-situ cryo-EM structures.
a, Representative density maps of endogenous cofactors and atomic models fitted. The cartoon in the center represents the contour of the type-A supercomplex projection with the ligand position assigned. b, Structured and associated lipids identified from the high-resolution cryo-EM density of type-A supercomplex.
Extended Data Fig. 5
Extended Data Fig. 5. Complex hydrogen-bonded networks near the Qi sites for proton transfer in CIII2.
a, These networks consist mainly of water molecules, supported by their interacting residues, and polar headgroups of lipids, forming the proton uptake path near the Qi site and the proton release path near the Qi site. b, The high-resolution map enables us to confidently build water molecules in Qi site and their surrounding residues and lipids that form these intricate hydrogen-bonded networks. c, The proton-transfer water chain and local density map near the Qo Site.
Extended Data Fig. 6
Extended Data Fig. 6. Influence of supercomplexes on surrounding membrane curvature.
a-d, Side views illustrating the impact of SCs on membrane curvature.
Extended Data Fig. 7
Extended Data Fig. 7. Different Q-binding states and conformational changes in the Q-channel.
a, Superpositions of the four different Q-binding states with the active-apo state (grey) reveal not only conformational alterations in the Q10 headgroup and H59NDUFS2 (left panel) but also significant changes in long-range structures away from Q10 headgroup (right panel). b-e, Superimposition of the porcine in-situ supercomplex structure with the bovine CI (grey) incorporated into MSP nanodisks indicates that our fully occupied state resembles the active form of bovine CI with a Q10 fully occupying the Q-site (State-α). Residues interacting with Q10 in the other three binding states (State-β, -γ and -δ).
Extended Data Fig. 8
Extended Data Fig. 8. Comparison of intermediate binding sites for Q in the Q-channel in this work (α-δ) and previous study (Site1-3).
(PDB: 7VZV, 7W4C, 7W0R, 7W00). Site-1 is almost identical with State-α, while the other three Q-binding sites (1F, 2, 3) are not the same as that in ours (state-β, -γ and -δ). The distances shown in the figure are from the head of Q to the entrance of Q-channel.
Extended Data Fig. 9
Extended Data Fig. 9. Distribution of the conformational states of CI and CIII under different treatments.
a, CIII utilizes QH2 from either CI or II as its substrate. b, In the ‘fresh’ sample, approximately 75% of CI within SCs is observed to be in an active state. This contrasts with the stability of the active state under varying conditions, where only about 30% and 18% of CI retain their active configuration under ‘mild’ and ‘harsh’ experimental conditions, respectively. Notably, in the ‘fresh’ sample, CI is primarily found in its active form. Simultaneously, within CIII, the ISP domain exhibits a distribution between the b-position (76%) and c-position (24%). c, In the ‘fresh’ sample, approximately 25% of CI is found in a deactive state. This proportion increases significantly under experimental conditions, with about 70% of CI in a deactive state under ‘mild’ conditions and further rising to 82% under ‘harsh’ conditions. Concurrently, the distribution of the ISP domain within CIII in the b-position changes to 60.4% under ‘mild’ conditions and decreases to 23.3% under ‘harsh’ conditions. Conversely, the prevalence of the c-position within CIII shifts to 39.6% under ‘mild’ conditions and escalates to 65.6% under ‘harsh’ conditions.
Extended Data Fig. 10
Extended Data Fig. 10. Comparison of global conformational changes between active/deactive states from different studies.
For clarity, the centers of the core subunits are used for studying the conformational changes. The centers are calculated by averaging the coordinates of Cα of each subunit. a-c, Displacement distances of hydrophilic and hydrophobic core subunits in CI active-apo (cyan) and deactive-class7 (this work, porcine, pink) (a); CI active-apo (7QSL, cyan) and deactive-apo (7QSN, bovine, pink) (b); and CI Native-closed (6ZKO, cyan) and CI deactive-open1 (6ZKS, ovine, pink) (c). d, Bar chart statistics of the distances in a, b, and c. *Because the ND6-TMH4 has a big conformational change, this distance comparison is calculated without ND6-TMH4.

Similar articles

Cited by

References

    1. Pfanner N, Warscheid B, Wiedemann N. Mitochondrial proteins: from biogenesis to functional networks. Nat. Rev. Mol. Cell Biol. 2019;20:267–284. - PMC - PubMed
    1. Lin MT, Beal MF. Mitochondrial dysfunction and oxidative stress in neurodegenerative diseases. Nature. 2006;443:787–795. - PubMed
    1. Sorrentino V, Menzies KJ, Auwerx J. Repairing mitochondrial dysfunction in disease. Annu. Rev. Pharmacol. Toxicol. 2018;58:353–389. - PubMed
    1. Nunnari J, Suomalainen A. Mitochondria: in sickness and in health. Cell. 2012;148:1145–1159. - PMC - PubMed
    1. Morgenstern M, et al. Quantitative high-confidence human mitochondrial proteome and its dynamics in cellular context. Cell Metab. 2021;33:2464–2483.e2418. - PMC - PubMed

MeSH terms

LinkOut - more resources