. 2024 Jun;630(8015):174-180.
doi: 10.1038/s41586-024-07466-1. Epub 2024 May 29.

Transcriptional control of the Cryptosporidium life cycle

Affiliations

Transcriptional control of the Cryptosporidium life cycle

Katelyn A Walzer et al. Nature. 2024 Jun.

Abstract

The parasite Cryptosporidium is a leading agent of diarrhoeal disease in young children, and a cause and consequence of chronic malnutrition1,2. There are no vaccines and only limited treatment options3. The parasite infects enterocytes, in which it engages in asexual and sexual replication4, both of which are essential to continued infection and transmission. However, their molecular mechanisms remain largely unclear5. Here we use single-cell RNA sequencing to reveal the gene expression programme of the entire Cryptosporidium parvum life cycle in culture and in infected animals. Diverging from the prevailing model6, we find support for only three intracellular stages: asexual type-I meronts, male gamonts and female gametes. We reveal a highly organized program for the assembly of components at each stage. Dissecting the underlying regulatory network, we identify the transcription factor Myb-M as the earliest determinant of male fate, in an organism that lacks genetic sex determination. Conditional expression of this factor overrides the developmental program and induces widespread maleness, while conditional deletion ablates male development. Both have a profound impact on the infection. A large set of stage-specific genes now provides the opportunity to understand, engineer and disrupt parasite sex and life cycle progression to advance the development of vaccines and treatments.


Figures

Extended Data Figure 1.
Extended Data Figure 1.. Generation of transgenic parasite strains.
Integration maps show the homology repair, the native locus, and the modified locus, with the CRISPR/Cas9 induced break for each transfection marked by an arrowhead. Diagnostic PCR products are represented as inverted arrows on the integration maps and are shown on the corresponding gel, demonstrating successful insertion of the homology repair. Transgenic strains include a, tdNeon RPL22 HA, b, cgd7_5500 (GGC1) HA, c, cgd6_2250 (Myb-M) HA, d, cgd6_2250 (Myb-M) knockouts (no parasites recovered), e, cgd6_2250 (Myb-M) overexpression in thymidine kinase locus, f, cgd6_2250 (Myb-M) overexpression in cgd6_2670 (AP2-M) locus, g, cgd6_2250Δ(Myb-MΔ) overexpression in thymidine kinase locus, and h, cgd6_2250 (Myb-M) LoxP HA. All guide RNAs and primers noted are listed in Supplementary Table 13.
Extended Data Figure 2.
Extended Data Figure 2.. Enrichment of C. parvum infected cells for scRNA-seq and quality control.
a, b, Cell populations from a, culture or b, the ileum of an IFN-γ−/− mouse were sorted to enrich for viable cells infected with fluorescent green C. parvum. Cells sorted from the mouse ileum were also enriched for intestinal epithelial cells based on EPCAM positivity. Sorting gates are outlined in black. c-e, Violin plots show the distribution of c, genes detected, d, UMIs, and e, percentage of transcripts mapping to rRNA genes across samples after filtering. Filtering cutoffs included a minimum of 100 detected genes and less than 60 percent of transcripts mapping to rRNA. The maximum cutoffs were set per sample according to the pre-processed distribution of detected genes and UMIs. For the in vivo sample, the maximum number of detected genes was 1800 and the maximum number of UMIs was 7500. For timepoints 24, 36, and 42 hours, the maximum number of detected genes was 1200 and the maximum number of UMIs was 4000. For timepoints 46 and 54 hours, the maximum number of detected genes was 500 and 400 and the maximum number of UMIs was 1000.
Extended Data Figure 3.
Extended Data Figure 3.. Temporal gene expression across the asexual cycle.
a, b, Scaled expression of organellar genes across pseudotime. Individual genes are shown in grey, the mean in black, and the 95 percent confidence interval in red (a). The means from each organelle (black in a) are plotted in color (b). c, A heatmap shows the scaled expression of the organellar genes across asexual clusters. The color for each gene group corresponds to that used in (b). These data represent the parasite transcriptomes captured at 24 and 36 hours (see Supplementary Table 2 for gene lists).
Extended Data Figure 4.
Extended Data Figure 4.. Expression of cluster markers across the C. parvum life cycle.
A heatmap shows the scaled expression of 2880 genes that were identified as markers for one or more clusters defining the C. parvum transcriptome (see Supplementary Table 5 for gene lists).
Extended Data Figure 5.
Extended Data Figure 5.. The transcriptome of the full C. parvum life cycle including lncRNAs.
a, The UMAP shows 8962 individual C. parvum transcriptomes and is colored for clustering across asexual (green), male (blue), and female (pink) parasites. b, Each UMAP shows the top lncRNA gene for each cluster with its normalized expression in blue.
Extended Data Figure 6.
Extended Data Figure 6.. Identification of meiosis-specific genes.
Previously published meiosis and DNA repair genes were examined for their female-specific expression, as expression during other stages would indicate that they are not specific for meiosis. Eight genes were identified as female-specific from the previous list and were designated as meiosis genes. Further examination of female-specific genes (Supplementary Table 9) revealed three additional meiosis genes not included in the previously published list. UMAPs show their normalized expression levels in blue.
Extended Data Figure 7.
Extended Data Figure 7.. Male gametes lack gliding and invasion machinery but exclusively express genes of the GGC exported protein family.
a-c, Signature scores were obtained for glideosome(a), rhoptry (b), and microneme (c) genes and were painted onto the UMAP in green. Note that following successful fertilization and meiosis, in vivo females form sporozoites which are indistinguishable from merozoites with respect to their motility machinery. Late in vivo females therefore exhibit expression of glideosome genes. d, UMAPs show the normalized expression levels (in blue) of four paralogous GGC proteins. e, GGC1 (cgd7_5500) was epitope tagged and visualized in immunofluorescence assays after 54 hours of growth in culture. Tagged GGC1 was stained with an antibody to HA, shown in green, while the male nucleus was stained with DAPI in blue. Males were stained with alpha tubulin, shown in red, and females were stained with DMC1, also shown in red, in two separate assays. GGC1 localizes to the periphery of the 8N male gamont, surrounding the nuclei, and then localizes to the apical end of mature male gametes. It is not expressed in females (scale bar = 2 μm).
Extended Data Figure 8.
Extended Data Figure 8.. Expression of AP2 transcription factors across the C. parvum life cycle.
A heatmap shows the normalized expression of 16 AP2 transcription factors across the C. parvum transcriptome. AP2s are largely stage- and sex-specific. Male and female expressed AP2s are shown in bold.
Extended Data Figure 9.
Extended Data Figure 9.. Myb-M is the earliest male transcription factor and the locus is refractory to disruption.
a, UMAPs show the normalized expression levels (in blue) of male- and female-specific transcription factors. Myb-M is expressed the earliest of all factors with female AP2s expressed particularly late in female developmental progression. b, c, Myb-M was targeted for deletion at the predicted N-terminal DNA binding domains (b) or after for C-terminal truncation (832 base pairs into the coding sequence, c) by CRISPR/Cas9 mediated marker insertions. Myb-M-HA was used as a control in parallel. Sporozoites transfected with a Cas9+gRNA plasmid and homology repair template (see Extended Data Fig. 1 for design) were given to mice via oral gavage. Oocyst shedding was monitored by fecal luminescence measurements. Data is represented as the mean of three technical replicates and error bars represent the standard deviation of the mean. Note that while epitope tagged mutants are readily recovered, no viable transgenics were isolated using the deletion and truncation constructs, suggesting that the gene is likely essential.
Extended Data Figure 10.
Extended Data Figure 10.. Ectopic expression of Myb-M drives parasites to a male fate.
a, Diagram showing conditional Myb-M overexpression AP2-M reporter strain. b, c, Infected cultures were treated with vehicle or Shield-1 at 12 hours, fixed at 18 hours, and AP2-M was detected with an antibody to Myc and quantified in 8N parasites (c). Error bars represent standard deviations of three biological replicates (**P = 0.0018, unpaired t-test with Welch’s correction). d, Infected cultures were treated with vehicle or Shield-1 at 24 hours, fixed at 28 hours, and AP2-M was quantified as in c (**P = 0.0044, unpaired t-test with Welch’s correction). e, Schematic comparing the conditional Myb-M-HA and Myb-MΔ-HA overexpression constructs. The conserved DNA-binding domains predicted by AlphaFold are marked in green, with the amino acid sequence annotated above. 315 nucleotides were deleted from conditional Myb-MΔ-HA, and the resulting open reading frame is shown indicating the amino acid sequence of the deletion. f, Inducible Myb-M-HA and Myb-MΔ-HA parasites were treated with Shield-1 and scored for HA staining. g, h, HCT-8 cultures infected with the inducible Myb-M-HA strain were treated with vehicle or Shield-1 at either 12 hours (g) or 36 hours (h). RNA was harvested at 18 hours (g) or 48 hours (h) and representative constitutive (grey), asexual (green), male (blue), or female (pink) transcripts were measured by qPCR. The log2 fold change is relative to the 18S rRNA control and vehicle-treated samples. Error bars represent the error propagation of two independent biological repeats.
Figure 1.
Figure 1.. The transcriptional program of the asexual cycle.
a, Engineered green fluorescent C. parvum parasite (Cp) shown within its intestinal host cell (HC). b, Infected host cells were isolated by cell sorting based on parasite fluorescence, sorting gate is shown as green box. c, Outline showing the collection, enrichment, and encapsulation of cells infected with C. parvum. d-f, UMAP plots of 2989 C. parvum single-cell transcriptomes representing nine distinct clusters (d), the direction of transcriptional change (e), and pseudotime (f). The start and end of the asexual cycle are noted. g, Schematic representation highlighting the asexual merogony cycle and the merozoite, which contains four distinct secretory organelles discharged during invasion. h-j, Scaled expression of genes across pseudotime: DNA replication (h), 60S ribosome (i), and dense granules (j). Individual genes are shown in grey, the mean in black, and the 95 percent confidence interval in red. k-m, The mean scaled gene expression of organellar proteins plotted across pseudotime on an individually normalized min/max scale. Plots represent components for synthesis and growth (k), assembly (l), and secretion (m).
Figure 2.
Figure 2.. The transcriptome of the full C. parvum life cycle.
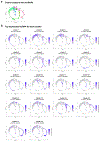
a, b, UMAP plots of single-cell transcriptomes of C. parvum obtained from an infected mouse (a) or from infected HCT-8 cultures sampled at the indicated time (b). c, d, Volcano plots show differentially expressed genes when comparing bulk RNA samples of asexual and male parasites from culture (c) or female parasites from mice and male parasites from culture (d), respectively (n = 4 biological replicates per group). Each point represents a single C. parvum gene. The horizontal dashed lines show an FDR of 0.05 (longer dashes) or 0.01 (shorter dashes) while the vertical dashed lines indicate log2 fold change of −1 and 1. e, UMAP plots representing the entire C. parvum life cycle show male and female gene signatures. Bulk comparisons across asexual, male, and female samples generated 221 and 130 genes significantly upregulated in males or females, respectively (log2 fold change of 2 or greater, p-value < 0.01). These were used to generate sex-specific gene signatures, which were painted onto the UMAP for male (blue) and female (pink). The UMAP shows 9098 individual C. parvum transcriptomes and represents the total analysis of samples depicted in (a) and (b). f, UMAP colored for clustering across asexual (green), male (blue), and female (pink) parasites.
Figure 3.
Figure 3.. Female and male gametes use sex-specific gene sets.
a, Schematic representation of female development in C. parvum from invasion by a sex-committed merozoite to fertilization. Wall forming bodies are shown as smaller white or grey vesicles. b, c, UMAP plots of the C. parvum female trajectory, encompassing 2136 single-cell transcriptomes. Development progresses through 6 transcriptionally distinct phases (b, clusters 13-18) with individual parasite transcriptomes ordered by pseudotime (c). d-g, Scaled expression of genes across pseudotime encoding components of the oocyst wall (d), dense granules (e), and crystalloid body (f), established by spatial proteomic analysis, as well as genes for secretory and membrane proteins containing candidates for fertilization receptors (g). Each line represents a single gene, with members of the COWP family highlighted in pink and proteins of the first and second wave of oocyst components colored in dark gray and black (d). The expression of candidate female surface receptors also falls into two waves (g). h, Schematic representation of male development. Intracellular male gamonts undergo four nuclear divisions before assembling 16 gametes for release and fertilization of a female gamete. i, j, UMAP plots of the C. parvum male trajectory, encompassing 731 single-cell transcriptomes in 3 stage specific clusters (i, clusters 10-12) and ordered by pseudotime (j). k, Diagram of the male gamete. A compact nucleus is surrounded by microtubules emanating from a basal body-like structure. The complex apical end contains the presumptive fertilization machinery, the components of which remain largely unknown. l, Scaled expression of male-specific secretory and membrane proteins across pseudotime, which fall into two transcriptional waves. Genes from the GGC exported protein family are labelled in blue and HAP2 is labelled in black. m, One of the four GGC proteins (encoded by cgd7_5500) was epitope tagged and visualized by immunofluorescence assay at the apical end of the male gamete. HA is shown in green, and DAPI labels the nucleus in blue. n, Scaled expression of key male-exclusive signaling genes across pseudotime: adenylate cyclase (AC), 3’5’-cyclic nucleotide phosphodiesterase (PDE), and two 14-3-3 proteins. All genes shown are found in Supplementary Tables 9 and 10.
Figure 4.
Figure 4.. The transcription factor Myb-M commits parasites to a male fate.
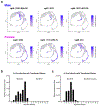
a, UMAP showing the normalized expression of Myb-M (in blue) at the start of the male trajectory. b, Myb-M was epitope tagged and visualized using an antibody to HA (red) by immunofluorescence after 42 hours in culture. Parasites were counterstained with Vicia villosa lectin (VVL, green). DAPI was used to visualize the nuclei (scale bar = 2 μm). c, d, HCT-8 cultures were infected with Myb-M-HA transgenic parasites and fixed at 24, 42, and 48 hours. The total number of parasites were counted via VVL staining and were assessed for Myb-M-HA (c). The number of nuclei were counted in Myb-M-HA positive parasites (d). e, HCT-8 cultures infected with Myb-M-HA transgenic parasites were fixed at 42 and 48 hours. Parasites were stained with antibodies to HA and the female protein DMC1 (highlighted in pink). (c-e) Error bars represent standard deviations of three biological replicates. Total number of parasites analyzed are shown in parentheses. f, HCT-8 cultures were infected with an inducible Myb-M overexpression strain and treated with vehicle or Shield-1 at 4 hours and fixed at 12 hours. Note the presence of male parasites only in cultures treated with Shield-1. g, Inducible Myb-M-HA parasites as well as Myb-M-domain mutant (Myb-MΔ-HA) were treated with Shield-1 and scored for mature male parasites. h, Volcano plots showing the transcriptional response of WT and inducible Myb-M-HA to Shield-1 treatment. The horizontal dashed lines show an FDR of 0.05 (longer dashes) or 0.01 (shorter dashes) while the vertical dashed lines indicate log2 fold change of 1. Asexual and male transcripts are highlighted in Supplementary Table 12 and in green and blue, respectively. i, Gene signatures derived from significantly changed genes in h mapped onto the single cell atlas. j, HCT-8 cultures infected with the Myb-M overexpression strain or a control strain were treated with vehicle or Shield-1 at 24 hours and growth was measured by luciferase assay at 48 hours. k, A parasite strain was constructed to carry a floxed Myb-M gene and a rapamycin (Rapa) inducible cre-recombinase. Rapamycin induces excision (note some leaky excision prior to treatment). l, Rapamycin treated or untreated parasites were scored for fraction of Myb-M-HA positive, 16N mature male, or DMC1-positive female parasites. m, Luciferase growth assay of Myb-M mutant with and without rapamycin. n, Groups of 3 IFNγ−/− mice were infected with Myb-M mutant parasites and treated with vehicle or rapamycin. Feces was collected daily and measured for oocyst luciferase activity. One of two replicates shown (total of 12 mice). For all other plots error bars represent standard deviation of the indicated number of biological replicates, and number of total cells scored is shown in brackets. Significance was evaluated by unpaired t or Welch’s t test.

References

    1. Kotloff KL et al. Burden and aetiology of diarrhoeal disease in infants and young children in developing countries (the Global Enteric Multicenter Study, GEMS): a prospective, case-control study. Lancet 382, 209–222 (2013). 10.1016/S0140-6736(13)60844-2 - DOI - PubMed
    1. Khalil IA et al. Morbidity, mortality, and long-term consequences associated with diarrhoea from Cryptosporidium infection in children younger than 5 years: a metaanalyses study. Lancet Glob Health 6, e758–e768 (2018). 10.1016/S2214-109X(18)30283-3 - DOI - PMC - PubMed
    1. Checkley W. et al. A review of the global burden, novel diagnostics, therapeutics, and vaccine targets for cryptosporidium. Lancet Infect Dis 15, 85–94 (2015). 10.1016/S1473-3099(14)70772-8 - DOI - PMC - PubMed
    1. English ED, Guerin A, Tandel J & Striepen B Live imaging of the Cryptosporidium parvum life cycle reveals direct development of male and female gametes from type I meronts. PLoS Biol 20, e3001604 (2022). 10.1371/journal.pbio.3001604 - DOI - PMC - PubMed
    1. Striepen B. Parasitic infections: Time to tackle cryptosporidiosis. Nature 503, 189–191 (2013). - PubMed

Substances