. 2024 Jun;630(8015):214-221.
doi: 10.1038/s41586-024-07476-z. Epub 2024 May 29.

An alternative cell cycle coordinates multiciliated cell differentiation

Affiliations

An alternative cell cycle coordinates multiciliated cell differentiation

Semil P Choksi et al. Nature. 2024 Jun.

Abstract

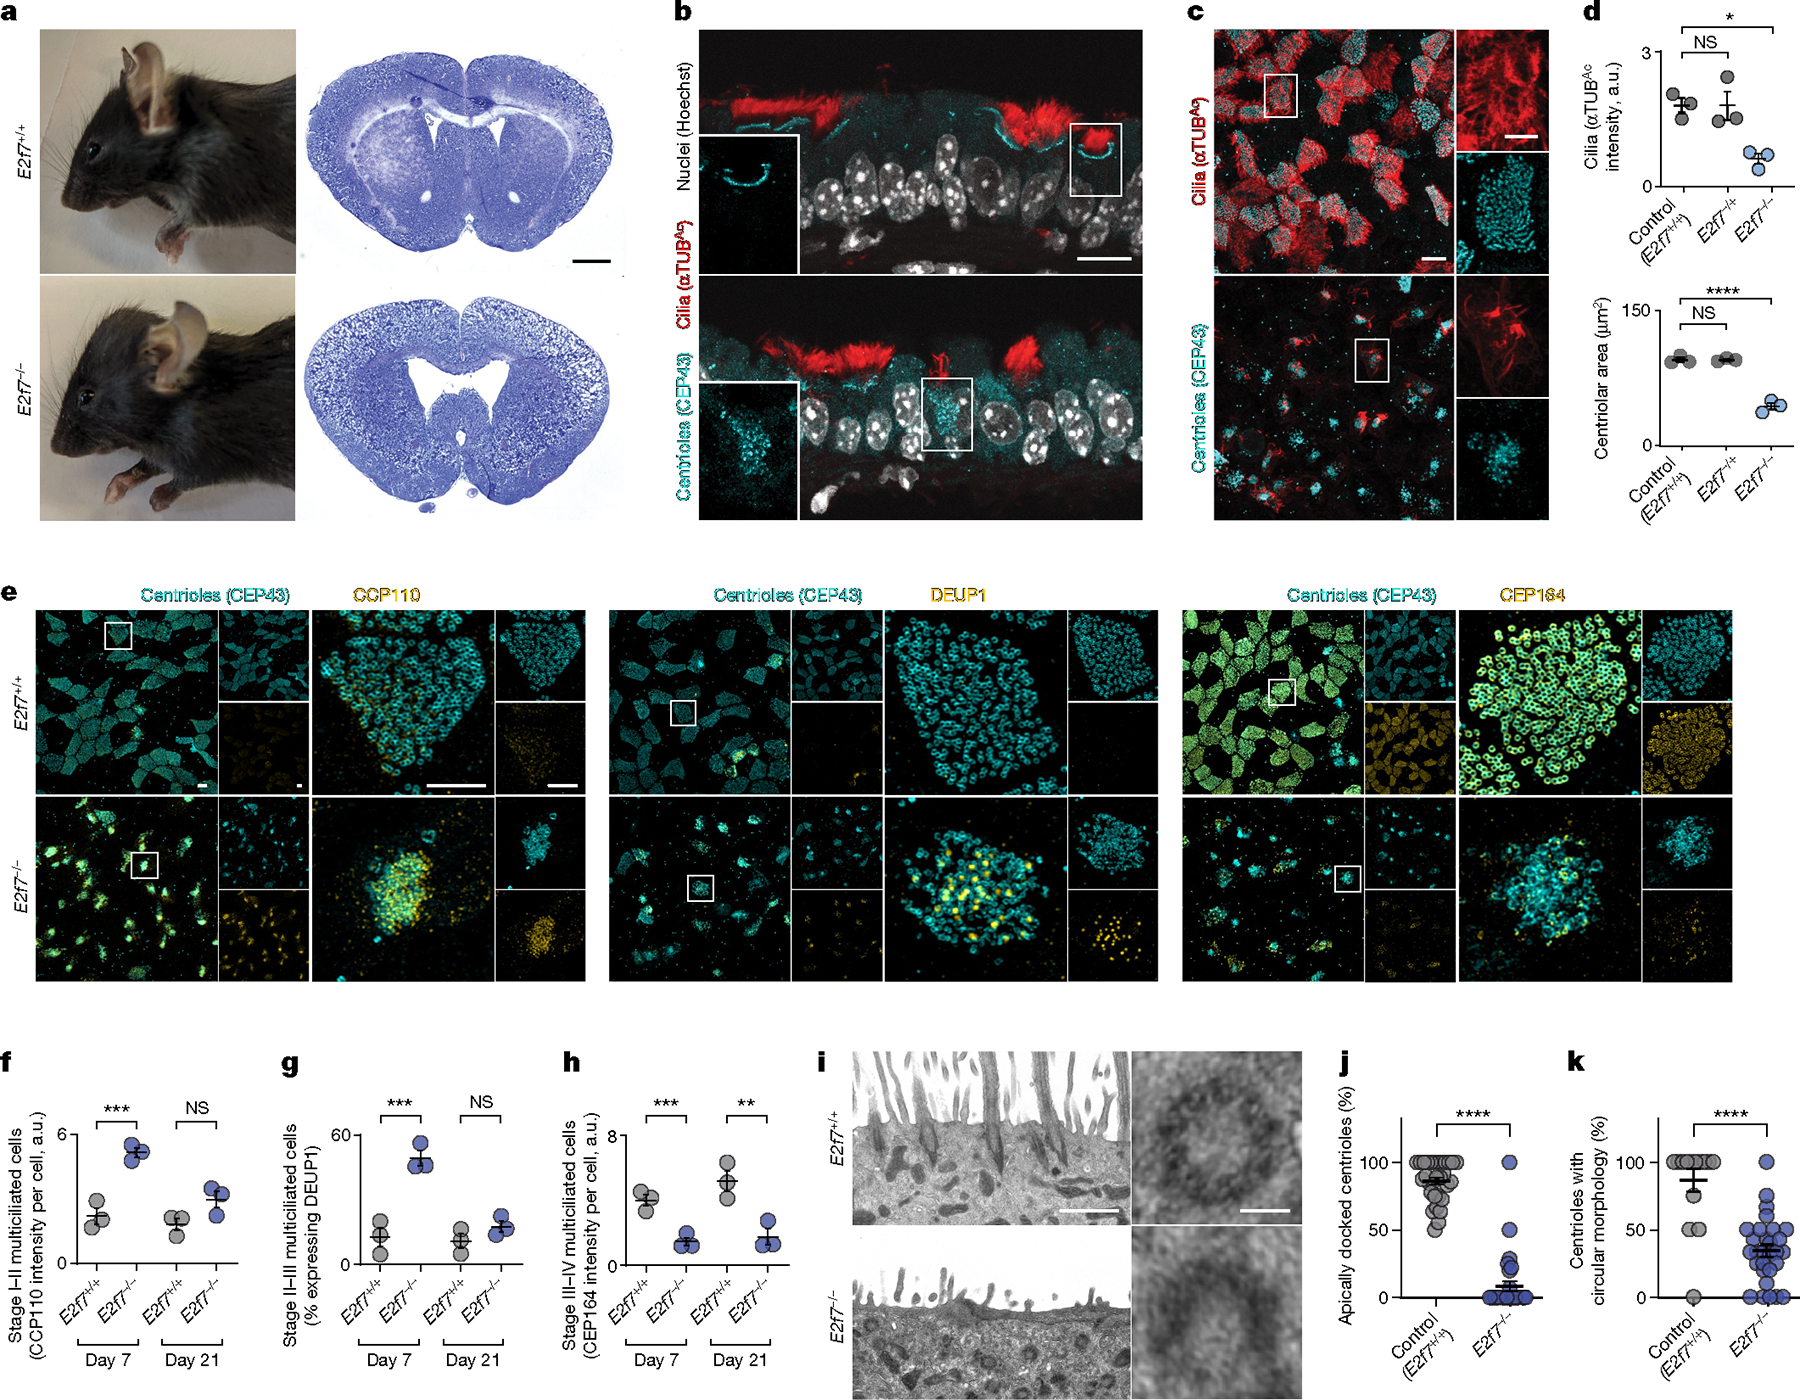
The canonical mitotic cell cycle coordinates DNA replication, centriole duplication and cytokinesis to generate two cells from one1. Some cells, such as mammalian trophoblast giant cells, use cell cycle variants like the endocycle to bypass mitosis2. Differentiating multiciliated cells, found in the mammalian airway, brain ventricles and reproductive tract, are post-mitotic but generate hundreds of centrioles, each of which matures into a basal body and nucleates a motile cilium3,4. Several cell cycle regulators have previously been implicated in specific steps of multiciliated cell differentiation5,6. Here we show that differentiating multiciliated cells integrate cell cycle regulators into a new alternative cell cycle, which we refer to as the multiciliation cycle. The multiciliation cycle redeploys many canonical cell cycle regulators, including cyclin-dependent kinases (CDKs) and their cognate cyclins. For example, cyclin D1, CDK4 and CDK6, which are regulators of mitotic G1-to-S progression, are required to initiate multiciliated cell differentiation. The multiciliation cycle amplifies some aspects of the canonical cell cycle, such as centriole synthesis, and blocks others, such as DNA replication. E2F7, a transcriptional regulator of canonical S-to-G2 progression, is expressed at high levels during the multiciliation cycle. In the multiciliation cycle, E2F7 directly dampens the expression of genes encoding DNA replication machinery and terminates the S phase-like gene expression program. Loss of E2F7 causes aberrant acquisition of DNA synthesis in multiciliated cells and dysregulation of multiciliation cycle progression, which disrupts centriole maturation and ciliogenesis. We conclude that multiciliated cells use an alternative cell cycle that orchestrates differentiation instead of controlling proliferation.


Conflict of interest statement

Competing interests J.F.R. cofounded startup companies funded by BridgeBio and 459AM.

Figures

Extended Data Fig. 1 |
Extended Data Fig. 1 |. Multiciliated cells go through sequential stages of differentiation.
a, Representative immunofluorescence images of wild-type mTECs cultured at air-liquid interface for three days and stained for centrioles (CEP43, cyan) and CCP110 (yellow). Cells at stages I-IV of multiciliated differentiation are depicted. n = 3 biological replicates. Scale bar, 5 μm. b, Representative immunofluorescence images of wild-type mTECs cultured at airliquid interface for three days and stained for centrioles (CEP43, cyan) and deuterosomes (DEUP1, yellow). n = 3 biological replicates. c, Representative immunofluorescence images of wild-type mTECs cultured at airliquid interface for three days and stained for centrioles (CEP43, cyan) and distal appendages (CEP164, yellow). n = 3 biological replicates. d, A schematic of the stages of multiciliated cell differentiation. Precursors induce the expression of early multiciliated cell transcription factors, such as MYB. Stage I involves the induction of proteins required for centriole biogenesis, such as CEP43 and CCP110. Stage II involves the generation of deuterosomes (marked by DEUP1, depicted here as yellow circles) and the synthesis of centrioles (depicted as blue dots). Stage III involves centriole disengagement, migration, acquisition of distal appendages (marked by CEP164) and docking at the apical membrane. Stage IV involves ciliogenesis. Cilia are in red. e, Proteins that are expressed during each stage of multiciliated cell differentiation used in this study are listed, with expression in precursors and during multiciliated cell differentiation schematized by color.
Extended Data Fig. 2 |
Extended Data Fig. 2 |. A time course of mTEC differentiation captured by scRNA-seq reveals expression of cell cycle regulators.
a, Integrated scRNA-seq dataset of mTECs on day 1, 3, 9, and 36 at air-liquid interface culture. Clusters are distinguished by color. b, Individual day 1, 3, 9, and 36 datasets that contribute to the integrated dataset. c, Expression of select marker genes for basal stem cells (Krt5), secretory cells (Scgb3a1), deuterosome-producing differentiating multiciliated cells (Deup1) and mature multiciliated cells (Dnah5) overlaid on the UMAP of the integrated dataset. Color indicates expression level. d, Pseudotime values for proliferating basal stem cells. e, Pseudotime values for differentiating multiciliated cells. f, Heatmap of average expression of select cell cycle-related genes in both basal stem (above) and multiciliated (below) cells across S and G2/M-binned phases of the cell cycle. Color indicates expression (z-score).
Extended Data Fig. 3 |
Extended Data Fig. 3 |. Differentiating multiciliated cells express cell cycle regulators and ciliogenesis genes.
a, Heatmap of cell cycle and ciliogenesis genes arranged across multiciliated cell differentiation pseudotime. Color of individual boxes in heatmap indicates expression (z-score). S (blue) and G2/M (green) phase scores represent normalized expression of genes associated with each stage of the cell cycle. Select genes associated with cell cycle and multiciliation functional categories are listed. Cluster identity of cells is schematized by color below. b, Average minimum and maximum normalized expression across multiciliated cell differentiation pseudotime of select genes encoding CDK proteins, cyclins, composite scores of S and G2/M phase-related genes, multiciliated cell transcription factors, proteins involved in centriole synthesis and maturation, or proteins involved in ciliogenesis.
Extended Data Fig. 4 |
Extended Data Fig. 4 |. mTECs cease proliferating during differentiation.
a, Representative immunofluorescence images of wild-type mTECs cultured at air-liquid interface for five days and stained for EdU (cyan), FOXJ1 (red) and nuclei (Hoechst, grey). EdU or DMSO was added during days one to five of culture at air-liquid interface. n = 3 biological replicates. Scale bar, 10 μm. b, Percentage of multiciliated cells (expressing FOXJ1) that exhibit EdU incorporation. Bar graph quantitates EdU incorporation in 186 multiciliated cells assessed from 3 biological replicates. c, Immunofluorescence images of differentiating wild-type mTECs. mTECs were stained for Histone 3 phosphorylated at serine 10 (H3S10P, cyan), TP63 (yellow) and nuclei (Hoechst, grey) two days before transition to air-liquid interface (Day -2), one day before (Day -1), the day of transition (Day 0), one day after transition to air-liquid interface (Day 1) or two days after (Day 2). H3S10P is a marker of cells in mitosis. TP63, also known as p63, is a marker of airway stem cells. Lower panels depict individual channels. Scale bar, 10 μm. d, Percentage of H3S10P-expressing cells in differentiating mTECs at the indicated times. Horizontal lines indicate means ± s.e.m. of 3 biological replicates, ****P = 0.000002 and NS, not significant (one-way ANOVA with Sidak’s correction). e, Percentage of TP63-expressing airway stem cells that also express H3S10P in differentiating mTECs at the indicated times. Horizontal lines indicate means ± s.e.m. of 3 biological replicates, ***P = 0.0009 and NS, not significant (one-way ANOVA with Sidak’s correction).
Extended Data Fig. 5 |
Extended Data Fig. 5 |. Assessment of roles of CDK4/6 and cyclin D1 in mTEC proliferation and differentiation.
a, Immunofluorescence images of mTECs treated with DMSO, palbociclib or ribociclib during days 0–5 or days 2–5 at air-liquid interface and stained for centrioles (CEP43, cyan), cilia (αTubAc, red) and nuclei (grey). Scale bar, 10 μm. b, Percentage of multiciliated cells in mTECs treated with DMSO, palbociclib or ribociclib for given timepoints. Horizontal lines indicate means ± s.e.m. of 3 biological replicates, ***P = 0.0004, ****P = 0.0002, *P = 0.0059, **P = 0.0018 (one-way ANOVA with Sidak’s correction). c, Nuclear density of mTECs treated with DMSO, palbociclib or ribociclib for given timepoints. Horizontal lines indicate means ± s.e.m. of 3 biological replicates, NS, not significant (one-way ANOVA with Dunnet’s correction). d, UMAP of integrated scRNA-seq data of DMSO- and ribociclib-treated mTECs. Clusters are distinguished by color. e, Individual scRNA-seq datasets of DMSO- or ribociclib-treated mTECs. Clusters are distinguished by color. f, Individual scRNA-seq datasets of DMSO- or ribociclib-treated mTECs colored by cell cycle phase scores determined by tricycle analysis. g, Integrated scRNA-seq dataset with pseudotime values of cells of the basal stem, intermediate and multiciliated cell clusters. Pseudotime infers a differentiation trajectory (black arrow). Integrated scRNA-seq dataset with blue indicating cells expressing markers of intermediate and multiciliated cells (e.g., Gmnc and Foxj1) selected for subclustering and pseudotime analysis. h, Pseudotime values of cells of the intermediate and multiciliated cell clusters. Pseudotime infers a differentiation trajectory (black arrow). i, Immunofluorescence images of mTECs transduced with lentivirus expressing NLS-GFP (control) or cyclin D1-GFP and stained for centrioles (CEP43, cyan) and markers of multiciliated cell differentiation: CCP110, deuterosomes (DEUP1) and distal appendages (CEP164). Individual channels are shown to the right. Scale bars, 10 μm. j, Percentage of multiciliated cells expressing CCP110, DEUP1 or CEP164 in mTECs expressing NLS-GFP or cyclin D1-GFP. Horizontal lines indicate means ± s.e.m. of 3 biological replicates, NS, not significant (unpaired two-tailed t-test).
Extended Data Fig. 6 |
Extended Data Fig. 6 |. Comparing transcriptional signatures of the canonical cell cycle and multiciliation cycle identifies E2f7.
a, Proliferating stem (orange) and multiciliated (blue) cells in S or G2/M phase scored for the expression of S or G2/M phase genes. Scores are normalized Mann-Whitney U-statistic of gene set expression. ****P = 0.000002, ***P = 0.00001 (unpaired two-tailed t-tests). b, Heatmap of cell cycle-related genes differentially expressed between proliferating stem and multiciliated cells during each cell cycle phase. Color indicates expression (z-score). c, Average expression of select genes preferentially expressed during the multiciliation cycle across cycle phases of proliferating stem and multiciliated cells. d, Expression of E2f7 projected onto the UMAP of the integrated mTEC dataset, proliferating stem and multiciliated cell subset. Color indicates expression level. e, E2f7 mutation generation using an sgRNA (red arrow) homologous to mouse exon 4. The E2f7em1Schok allele is predicted to generate a frameshift after codon 165 and referred to as E2f7. Scale bar, 1 kb. f, Genotypes of offspring of intercrossed E2f7/+ mice reveals no significant difference between observed and expected ratios (1 E2f7+/+:2 E2f7/+:1 E2f7/, chi-squared test). n = 126 mice from 16 litters. g, Allele-specific (E2f7+ or E2f7) quantitative PCR on cDNA from E2f7+/+ or E2f7−/− mTECs. Bars indicate means ± s.e.m. of 3 (E2f7+) or 4 (E2f7) biological replicates. Points at value 0 indicate undetectable expression. *P = 0.0259 (E2f7+) or *P = 0.0246 (E2f7) (paired two-tailed t-test). h, Immunofluorescence images of E2f7+/+ and E2f7−/− mTECs stained for E2F7 (yellow), centrioles (CEP43, cyan) and nuclei (grey). Right: magnifications of boxed cells. Scale bars, 5 μm. i, E2F7 nuclear intensity in multiciliated cells in E2f7+/+ and E2f7−/− mTECs. Horizontal lines indicate means ± s.e.m. of 3 biological replicates, **P = 0.0013 (unpaired two-tailed t-test). j, Representative images of adult trachea from E2f7+/+ and E2f7−/− mice immunostained for E2F7 (yellow), MYB (red), centrioles (CEP43, cyan) and nuclei (grey). Right: magnifications of boxed cells. n = 3 biological replicates. Scale bars, 10 μm.
Extended Data Fig. 7 |
Extended Data Fig. 7 |. E2F7 regulates S phase-like gene expression during multiciliated cell differentiation.
a, Individual replicate scRNA-seq datasets of E2f7+/+ and E2f7/ mTECs after culture at air-liquid interface for seven days. Clusters are distinguished by color. b, Integrated scRNA-seq dataset of E2f7+/+ and E2f7/ mTECs with cells highlighted from which basal stem- (orange) and multiciliated- (blue) subclustered scRNA-seq datasets were derived (Fig. 3). c, Clusters of E2f7+/+ and E2f7/ mTEC-derived basal stem cells. Colors distinguish clusters. d, Proportion of basal stem cell clusters in E2f7+/+ and E2f7/ mTECs. Colors distinguish clusters, NS, not significant (two-tailed Moderated t-test with Benjamini-Hochberg correction). e, Pseudotime values across multiciliated cell differentiation. f, Clusters of E2f7+/+ and E2f7/ mTEC-derived multiciliated cells. Colors distinguish clusters, labeled A-E. Arrows indicate the inferred pseudotime differentiation trajectory. g, Proportion of multiciliated cell clusters in E2f7+/+ and E2f7/ mTECs. Colors distinguish clusters A-E, NS, not significant (two-tailed Moderated t-test with Benjamini-Hochberg correction). h, Box plots depicting S phase gene signature scores of E2f7+/+ and E2f7/ basal stem and multiciliated cell clusters. Bars are colored by cluster. Boxes show interquartile range, horizontal bars indicate medians and whiskers show the minimum and maximum values of 2 biological replicates, with outliers plotted individually, *P = 0.0014, **P = 0.0013 (multiple unpaired t-tests with Holm-Sidak correction). i, Box plots depicting G2/M phase gene signature scores of E2f7+/+ and E2f7/ basal stem and multiciliated cell clusters. Bars are colored by cluster. Boxes show interquartile range, horizontal bars indicate medians and whiskers show the minimum and maximum values of 2 biological replicates, with outliers plotted individually, NS, not significant (multiple unpaired t-tests with Holm-Sidak correction).
Extended Data Fig. 8 |
Extended Data Fig. 8 |. E2F7 directly represses genes encoding DNA replication proteins.
a, Heatmap of DNA replication-, S phase- and cytoskeleton-associated genes differentially expressed between E2f7+/+ and E2f7/ multiciliated cells derived from mTEC scRNA-seq data. Boxes represent bins of expression arranged across multiciliated cell differentiation pseudotime. Color indicates expression (z-score). S (blue) and G2/M (green) phase scores represent normalized expression of genes associated with each cell cycle phase. Genes near E2F7-GFP CUT&RUN peaks are outlined in blue. b, mTECs transduced with E2F7-GFP or a control (NLS-GFP) lentivirus were analyzed using CUT&RUN. CUT&RUN peaks for a subset of genes encoding DNA replication machinery that are differentially expressed between E2f7+/+ and E2f7/ multiciliated cells are shown. y-axes represent reads per genomic content. Scale bars, 1 kb. c, Distribution of E2F7-GFP peaks relative to gene positions. d, Venn diagram of the overlap of the 334 genes differentially expressed between E2f7+/+ and E2f7/ multiciliated cells (blue) and 89 E2F7 direct target genes previously identified in proliferating cells by Westendorp et al. (grey). e, Venn diagram of the overlap of the 43 genes near E2F7 CUT&RUN peaks in mTECs (blue) and 89 E2F7 direct target genes previously identified in proliferating cells by Westendorp et al. (grey).
Extended Data Fig. 9 |
Extended Data Fig. 9 |. E2F7 is required for multiciliated cell differentiation.
a, Hydrocephalus quantification of 34 progeny from 6 litters of E2f7/+ or E2f7/ mice crossed with E2f7/+ mice. Fractions are the number of mice of each genotype with hydrocephalus over the total number of mice of that genotype assessed. b, Ratio of ventricle area to whole brain area in sections from adult E2f7+/+ and E2f7−/− mice. Horizontal lines indicate means ± s.e.m. of three different mice, *P = 0.0139 (unpaired two-tailed t-test). c, Brain ventricles of adult E2f7+/+ and E2f7−/− mice immunostained for centrioles (CEP43, cyan) and cilia (αTubAc, red). Right panels show individual channels. Scale bars, 10 μm. d, Quantitation of acetylated tubulin (αTubAc) intensity in multiciliated cells of E2f7+/+ and E2f7−/− brain ventricles. Each dot represents the mean αTubAc intensity of > 100 multiciliated ependymal cells from a mouse brain, with n = 7 E2f7+/+ mice and n = 8 E2f7/ mice. Horizontal lines indicate means ± s.e.m., *P = 0.0381 (unpaired two-tailed t-test). e, Sections of oviducts (left) or brain ventricles (right) of adult E2f7+/+ and E2f7−/− mice immunostained for centrioles (CEP43, cyan), cilia (αTubAc, red) and nuclei (Hoechst, gray). Lower panels show individual channels. White arrows indicate E2f7−/− cells with accumulated cytoplasmic centrioles. Scale bar, 10 μm. f, Percentages of cells with > 5 centrioles that have multiple cilia in adult mouse tracheas and oviducts. Horizontal lines indicate means ± s.e.m. of 3 mice, ***P = 0.0005 and *P = 0.0142 (ordinary one-way ANOVA with Sidak’s correction). g, Percentages of multiciliated cells with centrioles undocked to the apical membrane in adult mouse tracheas, oviducts and brain ventricles. Horizontal lines indicate means ± s.e.m. of 3 mice, ***P = 0.0004 and ****P = 0.00005 (ordinary one-way ANOVA with Sidak’s correction).
Extended Data Fig. 10 |
Extended Data Fig. 10 |. E2f8 is dispensable for multiciliation.
a, Expression of E2f8 projected onto the UMAPs of basal stem and multiciliated cells from the mTEC timecourse scRNA-seq dataset. Color indicates expression level. b, Average expression of E2f8 across cycle phases of basal stem and multiciliated cells. c, scRNA-seq expression of E2f8 in E2f7 +/+ and E2f7/ across differentiation pseudotime. Grey bars indicate 95% confidence intervals. Colors indicate cluster identity. d, Strategy for generating E2f8 knockout mTECs. Red arrows indicate positions of sgRNAs homologous to sequences in exon 7 of E2f8. Scale bar, 1 kb. e, Quantitative RT-PCR for wild-type E2f7 (E2f7+) and E2f8 (E2f8+) transcripts from control (E2f7+/+ ControlsgRNA), E2f8 mutant (E2f7+/+ E2f8sgRNA), E2f7−/− (E2f7−/− ControlsgRNA) or E2f7 and E2f8 double mutant (E2f7−/− E2f8sgRNA) mTECs. Bars indicate means ± s.e.m. of 3 biological replicates. Points at value 0 indicate undetectable expression. *P = 0.0284, **P = 0.0043, ***P = 0.0003, ****P = 0.000008 (one-way ANOVA with Sidak’s correction). f, Immunofluorescence images of control, E2f8 mutant, E2f7 mutant, or E2f7 and E2f8 double mutant mTECs cultured for 7 days at air-liquid interface, stained for centrioles (CEP43, cyan) and cilia (αTubAc, red). Right: individual channels. Scale bars, 10 μm. g, αTubAc intensity in control, E2f8 mutant, E2f7 mutant, and E2f7 and E2f8 double mutant mTECs cultured for 7 days at air-liquid interface. Horizontal lines indicate means ± s.e.m. of 3 biological replicates, *P = 0.0130 (one-way ANOVA with Sidak’s correction). h, Centriolar area in control, E2f8 mutant, E2f7 mutant, and E2f7 and E2f8 double mutant mTECs cultured for 7 days at air-liquid interface. Horizontal lines indicate means ± s.e.m. of 3 biological replicates *P = 0.0121 (one-way ANOVA with Sidak’s correction). i, Percentage of control, E2f8 mutant, E2f7 mutant, and E2f7 and E2f8 double mutant multiciliated cells containing deuterosomes (DEUP1) in mTECs cultured for 7 days at air-liquid interface. Horizontal lines indicate means ± s.e.m. of 3 biological replicates *P = 0.0295 (one-way ANOVA with Sidak’s correction).
Fig. 1 |
Fig. 1 |. Differentiating post-mitotic multiciliated cells transit through a cell-cycle-like program.
a, Cell cycle phase of basal stem cells. Insets show uniform manifold approximation and projection (UMAP) plots of the combined scRNA-seq data of differentiating mTECs, whereby orange indicates Krt5-expressing and Trp63-expressing basal stem cells selected for pseudotime analysis. Top, subclustered basal stem cells coloured by cluster identity. Bottom, cell cycle phase predicted by tricycle. Pseudotime infers a trajectory (arrow) corresponding to cell cycle phases. b, Identification of cycle phase of multiciliated cells. Blue in inset depicts Gmnc-expressing and Foxj1-expressing multiciliated cells selected for pseudotime analysis. Top, subclustered multiciliated cells coloured by cluster identity. Bottom, tricycle analysis reveals differentiating multiciliated cell expression reflective of G1/G0 (blue), S (pink) and G2/M phases (yellow-green). Pseudotime infers a trajectory (arrowhead) corresponding to progression from a G1/G0-like phase, through an S-like phase and a G2/M-like phase to a second G1/G0-like phase. c, Expression profiles of Ccnd1, Ccne1 and Ccnb1 across cycle phases for basal stem cells and multiciliated cells. d, Representative immunofluorescence images of differentiating mTECs stained for centrioles (CEP43), an early multiciliated cell transcription factor (MYB) and cell cycle regulators cyclin D1 (left), CDK1 (centre) and cyclin B1 (right). n = 3 biological replicates. e, Left, immunofluorescence images of PIP–FUCCI mTECs stained for centrioles (CEP43) and cilia (acetylated tubulin (αTUBAc)). Bottom panels depict mCherry–GMNN(1–110) (magenta) and CDT(1–17)–mVenus (green) native fluorescence. Stage based on centriole and cilia status. Right, quantification of nuclear mCherry–GMNN(1–110) fluorescence and nuclear CDT(1–17)–mVenus fluorescence, minimum and maximum normalized and plotted against the stage of multiciliated cell differentiation. Points are means of three biological replicates, with bars indicating ± s.e.m. f, Multiciliated cell differentiation, divided into stages and corresponding phases of the multiciliation cycle. Scale bars, 5 μm (d,e).
Fig. 2 |
Fig. 2 |. Cyclin D1–CDK4/6 initiates multiciliated cell differentiation.
a, Minimum and maximum normalized scRNA-seq expression across multiciliated cell differentiation pseudotime. Grey bars indicate 95% confidence intervals. Coloured x-axis indicates cluster identity. b, mTECs treated with DMSO, palbociclib or ribociclib and stained for centrioles (CEP43), cilia (αTUBAc) and nuclei. c, mTECs treated with DMSO or ribociclib and stained for MYB, FOXJ1 and nuclei. d, Percentage of multiciliated cells after DMSO, palbociclib or ribociclib treatment. Horizontal lines indicate means ± s.e.m. of 3 biological replicates, **P = 0.0118, *P = 0.0183 (one-way analysis of variance (ANOVA) with Dunnet’s correction). e, Percentage of MYB-expressing or FOXJ1-expressing cells after DMSO, palbociclib or ribociclib treatment. Horizontal lines indicate means ± s.e.m. of 3 biological replicates, ***P = 0.000002, ****P = 0.0000007 (one-way ANOVA with Dunnet’s correction). f, scRNA-seq UMAP of mTEC intermediate and differentiating multiciliated cells after DMSO or ribociclib treatment. Arrow indicates differentiation trajectory. g, Change in cell cluster proportion after ribociclib treatment. Bars indicate means ± s.e.m. of 3 biological replicates, *false discovery rate (FDR) < 0.02 (two-tailed Bayes quasi-likelihood F-test with Benjamini–Hochberg correction). h, Genes differentially expressed by ribociclib-treated intermediate cells compared with DMSO-treated cells. Red, fold-change > 1.5 and P < 0.0005 (two-tailed Wald test with Benjamini-Hochberg correction). i, scRNA-seq expression across multiciliated cell differentiation pseudotime (DMSO or ribociclib). Grey bars indicate 95% confidence intervals. Colours indicate cluster identity. j, scRNA-seq UMAP of tricycle-based cycle phase after DMSO or ribociclib treatment. k, Change in cycle phase proportion after ribociclib treatment. Bars indicate means ± s.e.m. of 3 biological replicates, ***log2(fold-change) < −0.5 and FDR < 0.0008 (two-tailed moderated t-test with Benjamini–Hochberg correction). l, mTECs expressing NLS–GFP or cyclin D1–GFP stained for centrioles (CEP43) and cilia (αTUBAc). Bottom panels show GFP and nuclei staining. m, Proportion of multiciliated cells after cyclin D1–GFP expression. Horizontal lines indicate means ± s.e.m. of 3 biological replicates, *P = 0.0102 (unpaired two-tailed t-test). n, Cyclin D1–CDK4/6 promotes the transition of precursor cells from the G1/G0-like phase to S-like phase of the multiciliation cycle. Scale bars, 10 μm (b,c,l).
Fig. 3 |
Fig. 3 |. E2F7 blocks DNA replication and promotes progression through the multiciliation cycle.
a, Average read counts across cycle phase of stem (orange) and multiciliated (blue) cells from the wild-type scRNA-seq dataset (Fig. 1). b, Representative image of adult mouse trachea immunostained for E2F7, centrioles (CEP43) and nuclei. n = 3 mice. c, mTECs immunostained for E2F7, centrioles (CEP43) and nuclei. Cells representative of each stage from three biological replicates are shown. d, Composite expression of multiciliated cell transcription factors, centriolar and ciliary genes in E2f7+/+ and E2f7−/− multiciliated cells. Scores are the normalized Mann–Whitney U-statistic of gene set expression. NS, not significant (multiple unpaired two-tailed t-tests with Holm–Sidak correction). e, Genes differentially expressed between E2f7−/− and E2f7+/+ differentiating multiciliated cells. Blue, fold-change > 1.5 and P < 0.00001 (two-tailed Wald test with Benjamini–Hochberg correction). f, scRNA-seq expression in E2f7+/+ and E2f7−/− multiciliated cells across pseudotime. Grey bars indicate 95% confidence intervals. g, E2F7–GFP or NLS–GFP CUT&RUN in mTECs, presented as reads per genomic content (RPGC). h, E2f7+/+ and E2f7−/− mTECs stained for EdU and FOXJ1. White arrows indicate E2f7−/− cells that express FOXJ1 and are EdU-positive. i, Percentage of E2f7+/+ and E2f7−/− mTECs expressing FOXJ1 that are EdU-positive. Horizontal lines indicate means ± s.e.m. of 3 biological replicates, **P = 0.001 (unpaired two-tailed t-test). j, S phase (left) and G2/M phase (right) gene signature scores derived from normalized sum rank of gene sets projected onto UMAPs of E2f7+/+ and E2f7−/− multiciliated cells. Colours indicate expression score of S or G2/M gene sets. Arrow indicates differentiation trajectory. Red and black arrowheads indicate the end of the S and G2/M phases, respectively, as defined by the half-maximal phase score. k, E2f7+/+ and E2f7−/− multiciliated cell minimum and maximum normalized S phase and G2/M phase gene signature scores across pseudotime. Grey bars indicate 95% confidence intervals Scale bars, 10 μm (b,h), 5 μm (c) or 1 kb (g).
Fig. 4 |
Fig. 4 |. E2F7 coordinates centriole synthesis during multiciliated cell differentiation.
a, Images of E2f7+/+ and E2f7−/− littermate mice, with coronal brain sections stained with haematoxylin and eosin. Scale bar, 1mm. b, Representative images of trachea immunostained for centrioles (CEP43), cilia (αTUBAc) and nuclei. Insets show magnification of centrioles in boxed cells. n = 3 mice per genotype. Scale bar, 10 μm. c, Left, mTECs immunostained for centrioles (CEP43) and cilia (αTUBAc). Scale bar, 10 μm. Right, magnifications of boxed cells. Scale bar, 5 μm. d, Quantification of ciliary intensity (αTUBAc) and centriolar area in mTECs. Horizontal lines indicate means ± s.e.m. of 3 biological replicates, *P = 0.0148, ****P = 0.000017 (one-way ANOVA with Dunnet’s correction). e, Left, mTECs immunostained for centrioles (CEP43) and CCP110 (left), deuterosomes (DEUP1, centre) and distal appendages (CEP164, right) after 7 days of differentiation. Right, magnifications of boxed cells, with individual channels in small panels. Scale bars, 5 μm. f, Intensities of CCP110 immunofluorescence per multiciliated cell after 7 or 21 days. Horizontal lines indicate means ± s.e.m. of 3 biological replicates, ***P = 0.0004, NS indicates P = 0.0689 (one-way ANOVA with Sidak’s correction). g, Percentage of multiciliated cells possessing DEUP1-containing deuterosomes after 7 or 21 days. Horizontal lines indicate means ± s.e.m. of 3 biological replicates, ***P = 0.0002, NS indicates P = 0.3808 (one-way ANOVA with Sidak’s correction). h, Intensities of CEP164 immunofluorescence per multiciliated cell after 7 or 21 days. Horizontal lines indicate means ± s.e.m. of 3 biological replicates, ***P = 0.0088, **P = 0.0015 (one-way ANOVA with Sidak’s correction). i, Left, transmission electron micrographs (TEMs) of multiciliated cells. Scale bar, 1 μm. Right, undocked centrioles. Scale bar, 100 nm. j, Percentage of apically docked centrioles in TEMs of multiciliated cells. Horizontal lines indicate means ± s.e.m. of 30 E2f7+/+ cells (234 centrioles) or 30 E2f7−/− cells (212 centrioles), ****P < 0.00000001 (unpaired two-tailed t-test). k, Percentage of undocked centrioles that are circular in TEMs of multiciliated cells. Horizontal lines indicate means ± s.e.m. of 18 E2f7+/+ cells (37 undocked centrioles) or 29 E2f7−/− cells (199 undocked centrioles), ****P = 0.00000001 (unpaired two-tailed t-test).
Fig. 5 |
Fig. 5 |. The multiciliation cycle is a cell cycle variant that coordinates differentiation.
A model of how the multiciliation cycle coordinates multiciliated cell differentiation. Multiciliated cell precursors initiate differentiation in a G1/G0-like phase. Precursors progress into an S-like phase encompassing stage I and early stage II. Cyclin D1–CDK4/6 and CDK2 regulate entry into the S-like phase (this work and ref. 6). E2F7 suppresses DNA synthesis during the S-like phase and promotes the S-like to G2/M-like transition. During the G2/M-like phase, cyclin B1–CDK1 promotes the growth of newly forming centrioles and APC/C controls centriole number and progression to stage III of multiciliated cell differentiation, when centrioles dock to the membrane. From the G2/M-like phase, differentiating multiciliated cells transition into the G1/G0-like phase corresponding to stage IV, ciliogenesis. CDK2 promotes this final stage of multiciliated cell differentiation.

References

    1. Morgan DO The Cell Cycle: Principles of Control (New Science Press, 2007).
    1. Orr-Weaver TL When bigger is better: the role of polyploidy in organogenesis. Trends Genet. 31, 307–315 (2015). - PMC - PubMed
    1. Choksi SP, Lauter G, Swoboda P & Roy S Switching on cilia: transcriptional networks regulating ciliogenesis. Development 141, 1427–1441 (2014). - PubMed
    1. Spassky N & Meunier A The development and functions of multiciliated epithelia. Nat. Rev. Mol. Cell Biol. 18, 423–436 (2017). - PubMed
    1. Al Jord A et al. Calibrated mitotic oscillator drives motile ciliogenesis. Science 358, 803–806 (2017). - PubMed