Comparative Study
. 2024 Jun;630(8016):401-411.
doi: 10.1038/s41586-024-07473-2. Epub 2024 May 29.

The complete sequence and comparative analysis of ape sex chromosomes

Kateryna D Makova #  1 Brandon D Pickett #  2 Robert S Harris #  3 Gabrielle A Hartley #  4 Monika Cechova #  5 Karol Pal #  3 Sergey Nurk  2 DongAhn Yoo  6 Qiuhui Li  7 Prajna Hebbar  5 Barbara C McGrath  3 Francesca Antonacci  8 Margaux Aubel  9 Arjun Biddanda  7 Matthew Borchers  10 Erich Bornberg-Bauer  9   11 Gerard G Bouffard  2 Shelise Y Brooks  2 Lucia Carbone  12   13 Laura Carrel  14 Andrew Carroll  15 Pi-Chuan Chang  15 Chen-Shan Chin  16 Daniel E Cook  15 Sarah J C Craig  3 Luciana de Gennaro  8 Mark Diekhans  5 Amalia Dutra  2 Gage H Garcia  6 Patrick G S Grady  4 Richard E Green  5 Diana Haddad  17 Pille Hallast  18 William T Harvey  6 Glenn Hickey  5 David A Hillis  19 Savannah J Hoyt  4 Hyeonsoo Jeong  6 Kaivan Kamali  3 Sergei L Kosakovsky Pond  20 Troy M LaPolice  3 Charles Lee  18 Alexandra P Lewis  6 Yong-Hwee E Loh  19 Patrick Masterson  17 Kelly M McGarvey  17 Rajiv C McCoy  7 Paul Medvedev  3 Karen H Miga  5 Katherine M Munson  6 Evgenia Pak  2 Benedict Paten  5 Brendan J Pinto  21 Tamara Potapova  10 Arang Rhie  2 Joana L Rocha  22 Fedor Ryabov  23 Oliver A Ryder  24 Samuel Sacco  5 Kishwar Shafin  15 Valery A Shepelev  25 Viviane Slon  26 Steven J Solar  2 Jessica M Storer  4 Peter H Sudmant  22 Sweetalana  3 Alex Sweeten  2   7 Michael G Tassia  7 Françoise Thibaud-Nissen  17 Mario Ventura  8 Melissa A Wilson  21 Alice C Young  2 Huiqing Zeng  3 Xinru Zhang  3 Zachary A Szpiech  3 Christian D Huber  3 Jennifer L Gerton  10 Soojin V Yi  19 Michael C Schatz  7 Ivan A Alexandrov  26 Sergey Koren  2 Rachel J O'Neill  4 Evan E Eichler  27   28 Adam M Phillippy  29
Affiliations
Comparative Study

The complete sequence and comparative analysis of ape sex chromosomes

Kateryna D Makova et al. Nature. 2024 Jun.

Abstract

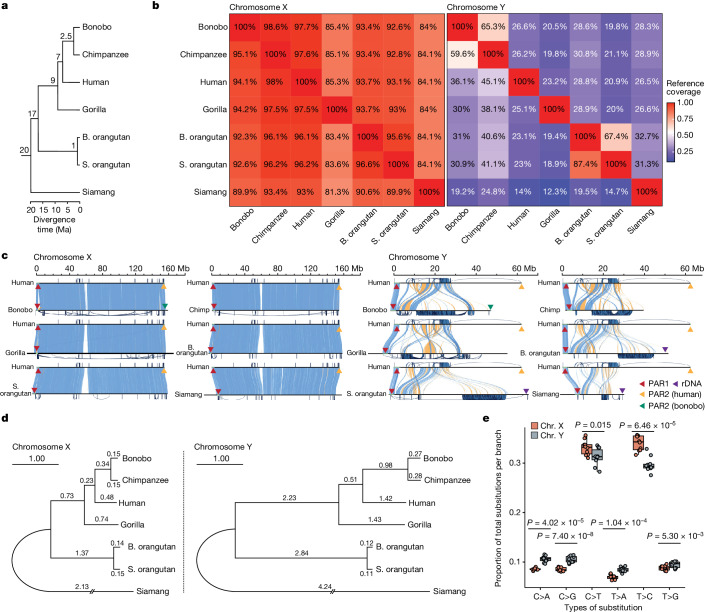
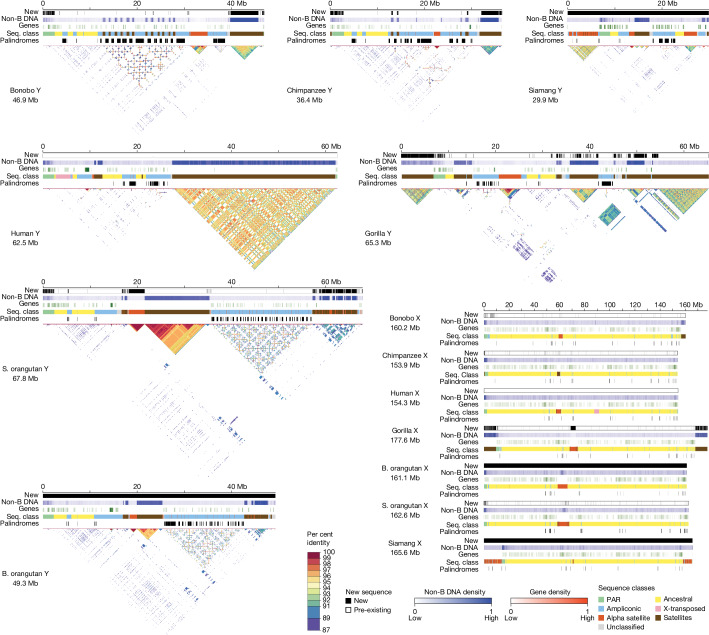
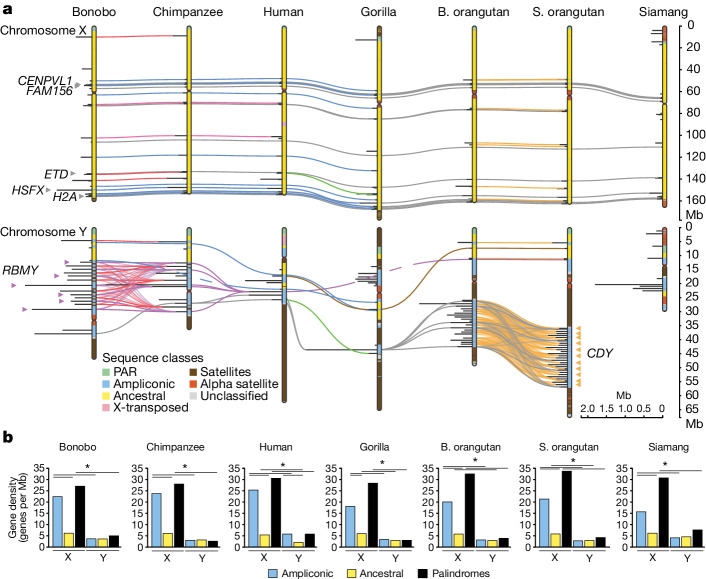
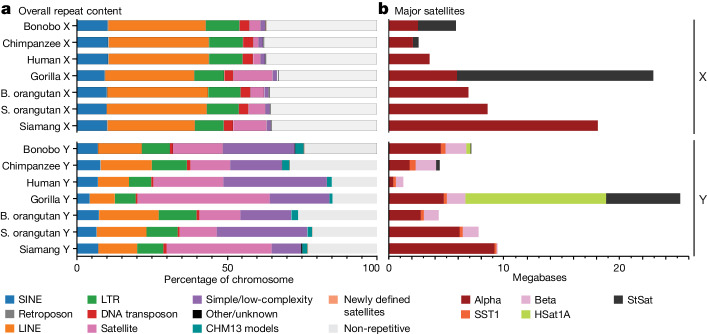
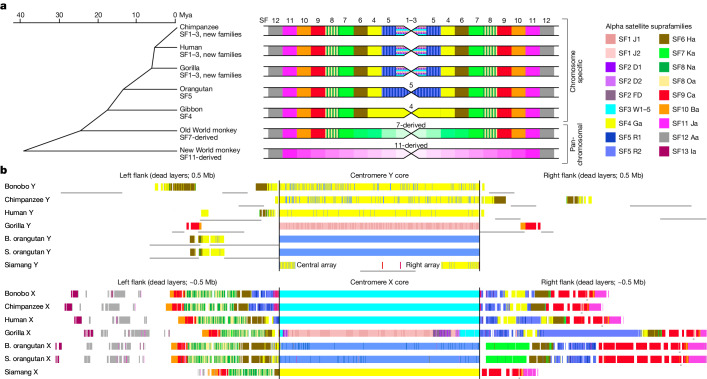
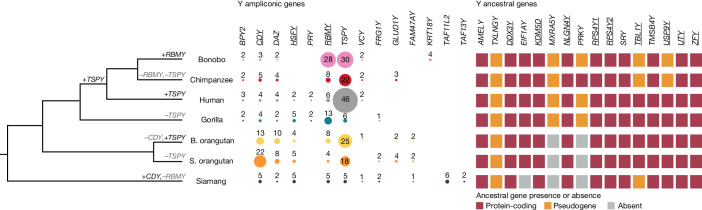
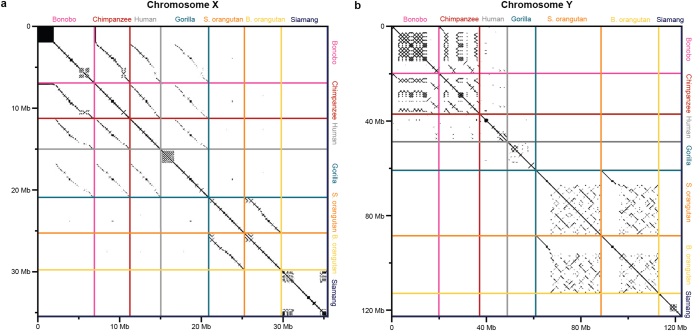
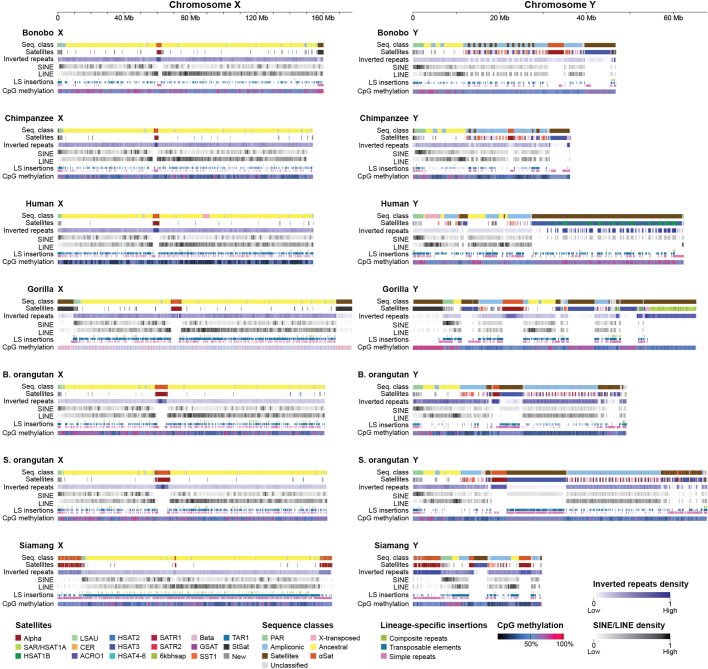
Apes possess two sex chromosomes-the male-specific Y chromosome and the X chromosome, which is present in both males and females. The Y chromosome is crucial for male reproduction, with deletions being linked to infertility1. The X chromosome is vital for reproduction and cognition2. Variation in mating patterns and brain function among apes suggests corresponding differences in their sex chromosomes. However, owing to their repetitive nature and incomplete reference assemblies, ape sex chromosomes have been challenging to study. Here, using the methodology developed for the telomere-to-telomere (T2T) human genome, we produced gapless assemblies of the X and Y chromosomes for five great apes (bonobo (Pan paniscus), chimpanzee (Pan troglodytes), western lowland gorilla (Gorilla gorilla gorilla), Bornean orangutan (Pongo pygmaeus) and Sumatran orangutan (Pongo abelii)) and a lesser ape (the siamang gibbon (Symphalangus syndactylus)), and untangled the intricacies of their evolution. Compared with the X chromosomes, the ape Y chromosomes vary greatly in size and have low alignability and high levels of structural rearrangements-owing to the accumulation of lineage-specific ampliconic regions, palindromes, transposable elements and satellites. Many Y chromosome genes expand in multi-copy families and some evolve under purifying selection. Thus, the Y chromosome exhibits dynamic evolution, whereas the X chromosome is more stable. Mapping short-read sequencing data to these assemblies revealed diversity and selection patterns on sex chromosomes of more than 100 individual great apes. These reference assemblies are expected to inform human evolution and conservation genetics of non-human apes, all of which are endangered species.


Conflict of interest statement

E.E.E. is a member of the scientific advisory board of Variant Bio. R.J.O. is a member of the scientific advisory board of Colossal Biosciences. C.L. is a member of the scientific advisory boards of Nabsys and Genome Insight. The other authors declare no competing interests.

Figures

Fig. 1
Fig. 1. Chromosome alignability and divergence.
a, The phylogenetic tree of the species in the study (see Supplementary Table 1 for references of divergence times). b, Pairwise alignment coverage of X and Y chromosomes (percentage of reference, as shown on the x axis, covered by the query, as shown on the y axis). c, Alignment of ape sex chromosomes against the human T2T assembly,. Blue and yellow bands indicate direct or inverted alignments, respectively. PARs and ribosomal DNA arrays (rDNA) are indicated by triangles (not to scale). Intrachromosomal segmental duplications are drawn outside the axes. The scale bars are aligned to the human chromosome. rDNA, ribosomal DNA. d, Phylogenetic trees of nucleotide sequences on the X and Y chromosomes. Branch lengths (substitutions per 100 sites) were estimated from multi-species alignment blocks including all seven species. e, A comparison of the proportions of six single-base nucleotide substitution types among total nucleotide substitutions per branch between X and Y (excluding PARs). The distribution of the proportion of each substitution type across 10 phylogenetic branches is shown as a dot plot (all data points are plotted) over the box plot. Box plots show the median as the centre line and the first and third quartiles as bounds; the whiskers extend to the closer of the minimum and maximum value or 1.5 times the interquartile range. The significance of differences in means of substitution proportions between X and Y chromosomes for each substitution type was evaluated with a two-sided t-test on the data from all ten branches (Bonferroni correction for multiple testing was applied).
Fig. 2
Fig. 2. Sequences gained, non-B-DNA, genes, sequence classes, palindromes and intrachromosomal similarity in the assemblies.
Tracks for newly generated sequence (black) relative to previous assemblies, non-B-DNA density, gene density (up to 11 genes per 100-kb window), sequence classes (seq. class) and palindromes (black). The X and Y chromosomes are portrayed on different scales. No previous references existed for the Bornean orangutan or siamang, thus the solid black bars for the new sequence tracks. No new sequence was added to the existing T2T human reference in this study and thus the new sequence tracks are empty (white). The gene density tracks are normalized across all species and chromosomes; the non-B-DNA density tracks are calibrated independently for each chromosome; in both cases, darker shades indicate higher density. Self-similarity dot plots using a modified version of Stained Glass are shown for the Y chromosomes; satellite arrays are visible as blocks of colour, segmental duplications appear as horizontal lines, and inverted or palindrome repeats are shown as vertical lines.
Fig. 3
Fig. 3. Conservation of palindromes and gene density in different sequences classes.
a, Palindromes are shown as horizontal lines perpendicular to the chromosomes (painted with sequence classes); palindromes shared among species are connected by coloured lines (different colours are used for unique species combinations, may be dashed when horizontally passing through species without sharing, opacity reduced in regions with dense palindrome sharing). Several gene families that expanded in lineage-specific palindromes on the Y (CDY and RBMY) and that are present in palindromes shared among species on the X chromosome (CENPVL1, FAM156, ETD, HSFX and H2A) are indicated. See Supplementary Tables 36, 37, 38 and 41 for the original data. b, Gene density for different sex chromosome sequence classes. The significance of differences in gene densities was computed using goodness of fit (chi-squared) test with Bonferroni correction for multiple tests. Asterisks indicate significant differences in gene density (P < 0.05). See Supplementary Table 38 for the original data and P values. An interactive version of this plot can be found at https://observablehq.com/d/6e3e88a3e017ec21.
Fig. 4
Fig. 4. Repeats on ape sex chromosomes.
a, Repeat annotations across each ape sex chromosome are depicted as a percentage of total nucleotides. Previously uncharacterized human repeats derived from the CHM13 genome analyses are shown in teal. Newly defined satellites (Methods) are depicted in light orange. b, The amount of DNA on each sex chromosome comprising canonical satellites, with each satellite represented by a different colour. LINE, long interspersed nuclear element; LTR, long terminal repeat; SINE, short interspersed nuclear element.
Fig. 5
Fig. 5. Centromeres on ape sex chromosomes.
a, Left, active alpha satellite suprafamilies (SFs) on the primate phylogenetic tree. Active centromeres in each chromosome have different higher-order repeats in chromosome-specific organization and similar repeats in pan-chromosomal organization. Right, centromeres for each branch (not to scale) with alpha satellite suprachromosomal family composition of the active core indicated in the middle and of the dead flanking layers on the sides. Each branch has one or more alpha satellite suprachromosomal family fewer than in African apes but may also have layers not shared with human (indicated by hues of the same colour). The African ape centromere cores are shown as horizontal bars of SF1–SF3 as each chromosome usually has one alpha satellite suprafamily, which differs with each chromosome. b, The UCSC Genome Browser tracks of alpha satellite suprafamily composition of centromere cores and flanks for cenY and cenX (not to scale). CenX is surrounded by stable vestigial layers (that is, the remnants of ancestral centromeres), whereas cenY has a ‘naked’ centromere devoid of such layers. Thin grey lines under the tracks show overlaps with segmental duplications. In gorilla cenX, SF3 was replaced by SF2 and then by SF1 (see details in Supplementary Note 7).
Fig. 6
Fig. 6. Gene evolution on the Y chromosome.
Significant gains and losses in ampliconic gene copy number (Supplementary Note 10) are shown on the phylogenetic tree. Copy numbers of ampliconic genes are indicated with numbers and by circle size; no circle indicates absence of annotated protein-coding copies. Presence, pseudogenization or absence (that is, deletion) of ancestral (X-degenerate) genes are shown by squares of different colours. Genes showing signatures of purifying selection (Methods) are underlined. XKRY was found to be a pseudogene in all species studied and is therefore not shown. The protein-coding status of PRY was confirmed for human, and we found evidence of expression of a similar transcript in gorilla (Supplementary Table 36b). The RBMY gene family harboured two distinct gene variants, each present in multiple copies in Pongo (Supplementary Fig. 19).
Extended Data Fig. 1
Extended Data Fig. 1. Conservation of ampliconic regions across species.
A between-species comparison of ampliconic regions on the (a) X chromosomes and (b) Y chromosomes between species with similarities highlighted using a dot plot analysis. Ampliconic regions were extracted and concatenated independently for each species and visualized with gepard using a window size of 100.
Extended Data Fig. 2
Extended Data Fig. 2. Repeats and satellites on the X and Y chromosomes.
Repeats and satellites shown with sequence class annotations and CpG methylation for chromosomes X and Y. The scales are different between chromosomes X and Y. The tracks for each species are: (1) sequence class annotation, (2) satellites, (3) inverted repeats, (4) SINEs, (5) LINEs, (6) lineage-specific (LS) insertions of composite repeats (green), transposable elements (blue), and satellites, simple repeats, and low-complexity repeats (pink), and (7) CpG methylation. The inverted repeat, SINE, and LINE tracks are plotted in blocks with darker colors representing a higher density (density values are calibrated independently for each chromosome/species). CpG methylation is also displayed on a gradient between dark blue (low methylation) and magenta (high methylation) based on the percentage of supporting aligned ONT reads. The remaining tracks (sequence class, satellites, and LS insertions) are displayed as presence/absence (color/no color). The class and satellite tracks are discrete, whereas the LS insertions are plotted as mini tracks to avoid overplotting where >1 label applies.
Extended Data Fig. 3
Extended Data Fig. 3. Methylation patterns.
(a) DNA methylation levels in 100-kb bins in Pseudoautosomal region 1 (PAR1; teal), non-PAR chromosome X (orange), and non-PAR chromosome Y (periwinkle). (b) Differences in DNA methylation levels between different repeat categories as well as protein-coding genes (after excluding repetitive sequences). (c) Differences in methylation levels between ampliconic and ancestral regions in the X and the Y chromosomes (in 100 kb bins). All box plots (a-c) show the median and first and third quartiles. Those in b-c also have whiskers extending to the closer of the minimum/maximum value or 1.5 times the interquartile range, and outliers (beyond the whiskers) are plotted as individual points. p-values were determined using two-sided Wilcoxon rank-sum tests (* p < 0.05; ** p < 10−3; *** p < 10−6) and are shown in Table S28. No correction for multiple testing was applied. Sample sizes (i.e., number of 100 kb bins (a,c) or number of repeats, genes, etc. (b)) are shown in Table S28.
Extended Data Fig. 4
Extended Data Fig. 4. Alpha satellite higher order repeat (HOR) haplotypes are species-specific in Pongo and Pan (except for the few distal HOR copies).
(a) Consensus HOR haplotype (HORhap) phylogenetic trees, (b) HOR trees, and (c) HORhap UCSC Genome Browser annotation tracks for active alpha satellite arrays of chromosomes X and Y in two Pan and two Pongo species (see Methods in Note S7) are shown. Each colored branch in a HOR tree represents a HORhap. All branches in HOR trees are species-specific, except for the GREY cluster in Pan cenX tree, where mixing of chimpanzee (square markers) and bonobo (triangle markers) HORs were observed (Note S7). Each branch was extracted to obtain HORhap consensus sequence and HMM further used in HMMER-based HORhap classification tool to produce HORhap annotations. The larger branches with shorter twigs correspond to the younger large active HORhap arrays; the smaller branches with longer twigs correspond to the older and smaller side arrays. The thinnest and longest branches make up the oldest and smallest peripheral arrays which often cannot be seen in the track panels. The Pongo X tree has a ‘star-like’ shape and does not have obvious HORhaps; HORs colored by species indicate almost no mixing between species and species-specific consensus sequences show three consistent differences (Fig. S15D). Thus, we concluded that the species did not share the same HORhaps, but no significant divides could be seen in the tree due to the short HOR length (a 4-mer), as detailed in Note S7. The age of the HORhaps is also confirmed by consensus trees where the oldest GREY twigs branch out closer to the root and are nearly equidistant to the active HORhap branches of respective species. Hence they likely resemble the HORs that existed in the common ancestor of both species. Thus, all but the oldest HORhaps are species-specific and indicate considerable evolution that occurred after the species diverged.
Extended Data Fig. 5
Extended Data Fig. 5. Estimation of rDNA copy number and activity on chromosome Y arrays.
(a) Gallery view of Y chromosomes from species in this study. Chromosomes were FISH-labeled with rDNA- (BAC RP11-450E20, green) and SRY-containing (BAC RP11-400O10, red) BAC probes and counter-stained with DAPI. Siamang and both orangutans’ Y chromosomes have rDNA signal on the distal ends of the q-arms. (b) Siamang and Sumatran orangutan chrY rDNA copy number was quantified from the fraction of the total fluorescent intensity of rDNA signals on all chromosomes (from chromosome spreads as in panel a) and the Illumina sequencing estimate of the total copy number of rDNA repeats in the genome (339 copies in siamang, 814 in Sumatran orangutan). The mean and standard deviations from 20 chromosome spreads are shown near each box plot. The box plots show the median as the center line and the first and third quartiles as the bounds of the box; the whiskers extend to the minimum/maximum value, and all values are plotted as dots in front of the box plot.The rounded average of rDNA arrays on chrY were 16 copies for siamang and 3 copies for Sumatran orangutan. (c) A representative image of siamang chrY labeled by immuno-FISH with rDNA probe (green) and the antibody against rDNA transcription factor UBF (magenta). The chrY rDNA array is positive for the UBF signal. (d) Quantification of siamang chrY rDNA and UBF expressed as the fraction of the total fluorescent intensity of all rDNA-containing chromosomes in a chromosome spread. The box plots are plotted as in b from 20 chromosome spreads. ChrY rDNA arrays contain on average ~10% of the total chromosomal UBF signal. Siamang (e) and Sumatran (f) and Bornean (g) orangutan read-level plots showing ONT methylation patterns at the chrY rDNA locus and surrounding regions. The coverage track shows the depth of sequencing coverage across the rDNA array, and the methylation track displays the methylation status of individual cytosines. Hypomethylation of the 45 S units is evidence of active transcription in siamang and S. orangutan, but not B. orangutan. Only reads >100 kb that are anchored in unique sequence outside the rDNA array and (except for Bornean orangutan) span at least two 45 S units are shown.
Extended Data Fig. 6
Extended Data Fig. 6. Positions of ampliconic gene families on the Y chromosome.
Locations of protein-coding ampliconic genes, grouped by family, are shown with sequence class annotations and palindrome locations on each Y chromosome. The tracks for each species are: (1) sequence class annotation, (2) palindromes, and (3-9) ampliconic gene families: BPY2, CDY, DAZ, HSFY, PRY, RBMY, TSPY, and VCY. The sequence class track has a discrete class annotation for every base. All other tracks are displayed as presence/absence (color/no color) with the ampliconic gene family tracks containing a horizontal midline to help the eye with the sparse display. All Y chromosomes are plotted on the same scale.
Extended Data Fig. 7
Extended Data Fig. 7. Phylogenetic analysis of the TSPY gene family.
Phylogenetic analysis (see Methods) of the protein-coding copies of the TSPY gene family in great apes, using siamang as an outgroup, uncovered mostly lineage-specific clustering suggesting homogenization among copies. Gene copies (numbered for each species) were extracted from the manually curated set (Table S45) and included 5’ and 3’ UTRs, CDS exons, and introns. These sequences were aligned and used to infer a maximum likelihood phylogeny (see Methods for details) with 10,000 ultrafast bootstrap replicates. Nodes with <95% bootstrap support were collapsed. ‘R’ indicated a reverse orientation as compared with the assembly sequences.
Extended Data Fig. 8
Extended Data Fig. 8. T2T assemblies facilitate short-read mapping and enable the analysis of genetic diversity in great apes.
(a) The percentage of short reads mapped to T2T vs. previous sex chromosome assemblies (using the previous reference assembly of Sumatran orangutan for Bornean orangutan data). Reads were sourced from multiple individuals per species, and the number of individuals per species and the total number of reads per species (sum of reads per individual) are listed in Table S42. The box plots show the median as the center line and the first and third quartiles as the bounds of the box; the whiskers extend to the closer of the minimum/maximum value or 1.5 times the interquartile range. Outliers (beyond the whiskers) are plotted as individual points. (b) Allele frequencies (y-axis) of variants called from reads mapped to T2T vs. previous assemblies. (c) Coverage and variant density (in log2 values of densities per 10 kb) distribution across previous (shown in the reverse orientation) and T2T assemblies for western chimpanzee. Peak variant densities were observed at 5.9 for previous chrY and at 7.6 for T2T chrY. (d) Distributions of variant allele frequencies on JADBMG010000033.1 (positions 2 to 618,314, upper), a contig from a previous chrY assembly, and T2T chrY (positions 43,632,350 to 44,250,835, bottom), for western lowland gorilla, visualized using IGV. (e) Nucleotide diversity (pi) in pseudoautosomal regions (PARs), ancestral regions of chromosome X, and ancestral regions of chromosome Y. ‘Chimp’ stands for chimpanzee. Variants for the calculation of pi were called for multiple individuals per subspecies, and the number of individuals per subspecies and the total number of variants per region (sum of variants per individual) are listed in Table S42. The box plots were plotted as in a.

Update of

  • The Complete Sequence and Comparative Analysis of Ape Sex Chromosomes.
    Makova KD, Pickett BD, Harris RS, Hartley GA, Cechova M, Pal K, Nurk S, Yoo D, Li Q, Hebbar P, McGrath BC, Antonacci F, Aubel M, Biddanda A, Borchers M, Bomberg E, Bouffard GG, Brooks SY, Carbone L, Carrel L, Carroll A, Chang PC, Chin CS, Cook DE, Craig SJC, de Gennaro L, Diekhans M, Dutra A, Garcia GH, Grady PGS, Green RE, Haddad D, Hallast P, Harvey WT, Hickey G, Hillis DA, Hoyt SJ, Jeong H, Kamali K, Kosakovsky Pond SL, LaPolice TM, Lee C, Lewis AP, Loh YE, Masterson P, McCoy RC, Medvedev P, Miga KH, Munson KM, Pak E, Paten B, Pinto BJ, Potapova T, Rhie A, Rocha JL, Ryabov F, Ryder OA, Sacco S, Shafin K, Shepelev VA, Slon V, Solar SJ, Storer JM, Sudmant PH, Sweetalana, Sweeten A, Tassia MG, Thibaud-Nissen F, Ventura M, Wilson MA, Young AC, Zeng H, Zhang X, Szpiech ZA, Huber CD, Gerton JL, Yi SV, Schatz MC, Alexandrov IA, Koren S, O'Neill RJ, Eichler E, Phillippy AM. Makova KD, et al. bioRxiv [Preprint]. 2023 Dec 1:2023.11.30.569198. doi: 10.1101/2023.11.30.569198. bioRxiv. 2023. Update in: Nature. 2024 Jun;630(8016):401-411. doi: 10.1038/s41586-024-07473-2. PMID: 38077089 Free PMC article. Updated. Preprint.

References

    1. Fan, Y. & Silber, S. J. in GeneReviews (eds Adam, M. P. et al.) (Univ. of Washington, Seattle, 2002).
    1. Graves, J. A. M. Sex chromosome specialization and degeneration in mammals. Cell124, 901–914 (2006). 10.1016/j.cell.2006.02.024 - DOI - PubMed
    1. Veyrunes, F. et al. Bird-like sex chromosomes of platypus imply recent origin of mammal sex chromosomes. Genome Res.18, 965–973 (2008). 10.1101/gr.7101908 - DOI - PMC - PubMed
    1. Bellott, D. W. et al. Mammalian Y chromosomes retain widely expressed dosage-sensitive regulators. Nature508, 494–499 (2014). 10.1038/nature13206 - DOI - PMC - PubMed
    1. Betrán, E., Demuth, J. P. & Williford, A. Why chromosome palindromes?. Int. J. Evol. Biol.2012, 207958 (2012). 10.1155/2012/207958 - DOI - PMC - PubMed

Publication types