. 2024 Jun;630(8015):189-197.
doi: 10.1038/s41586-024-07477-y. Epub 2024 May 29.

Molecular basis for differential Igk versus Igh V(D)J joining mechanisms

Affiliations

Molecular basis for differential Igk versus Igh V(D)J joining mechanisms

Yiwen Zhang et al. Nature. 2024 Jun.

Abstract

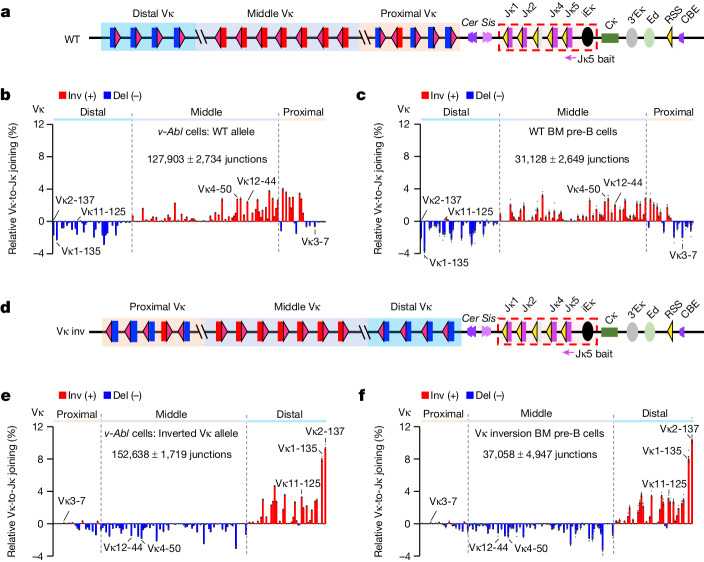
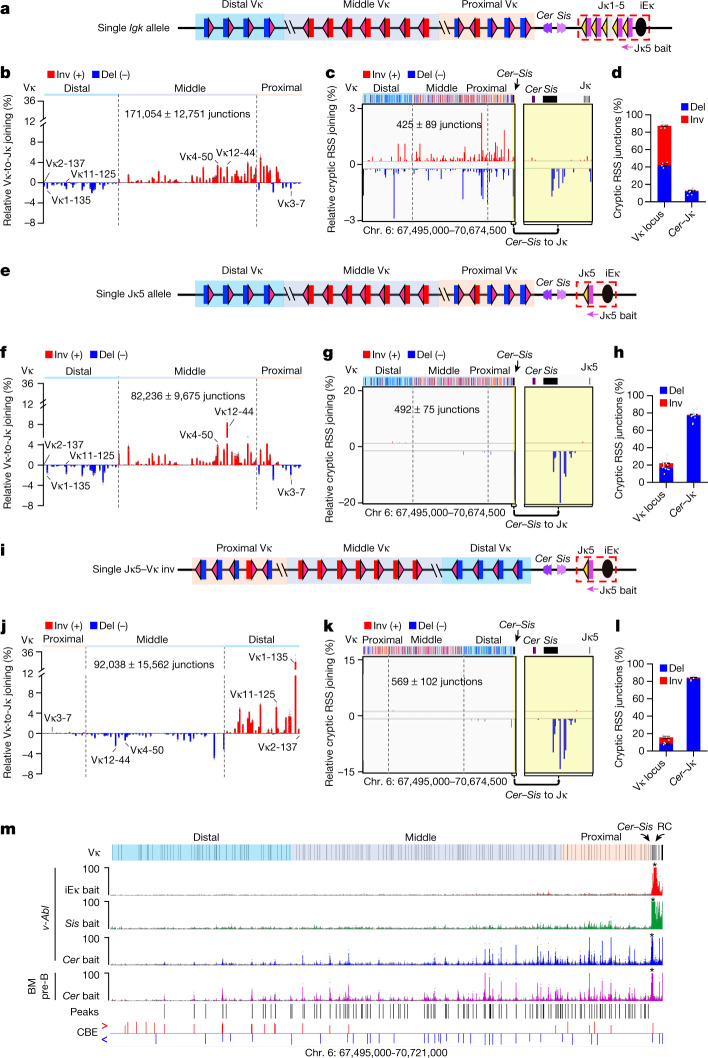
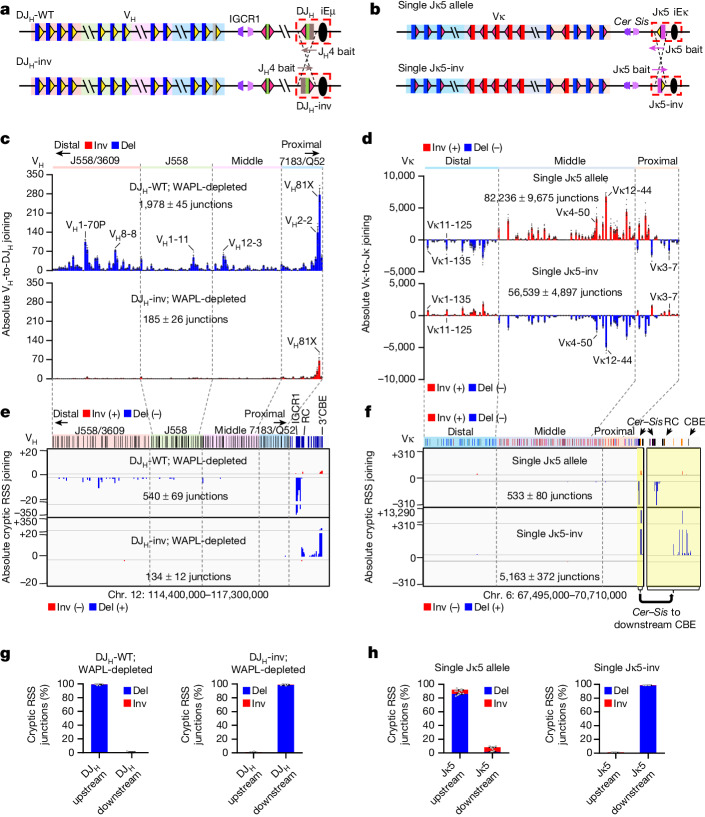
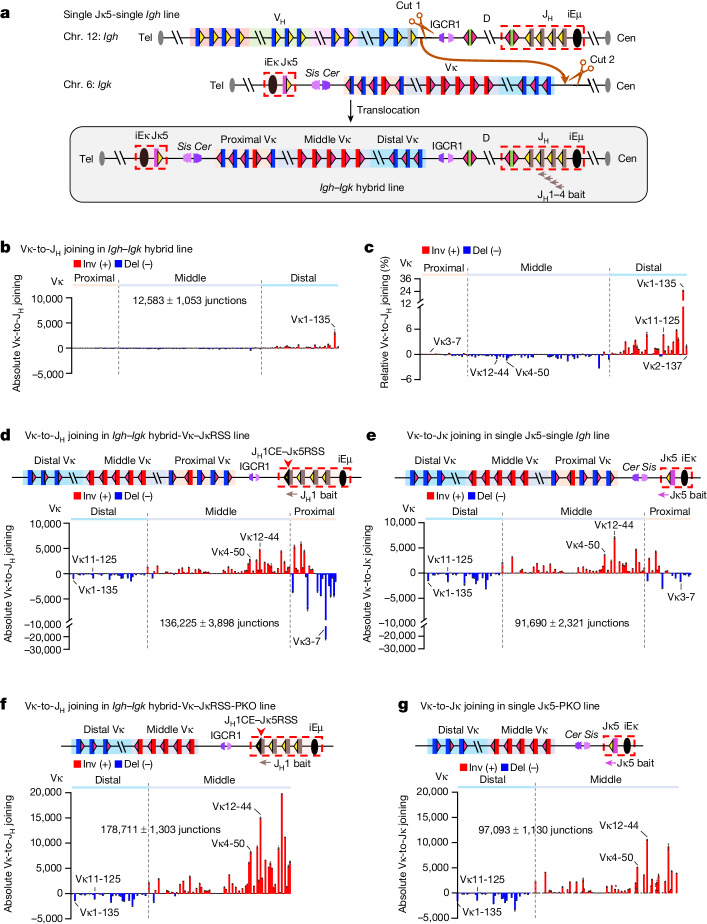
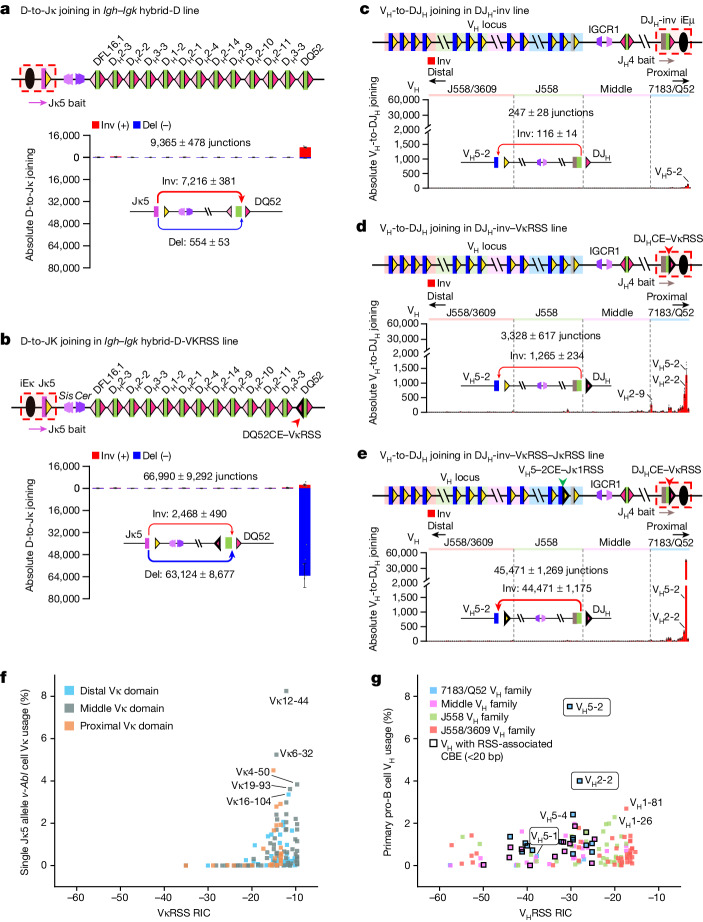
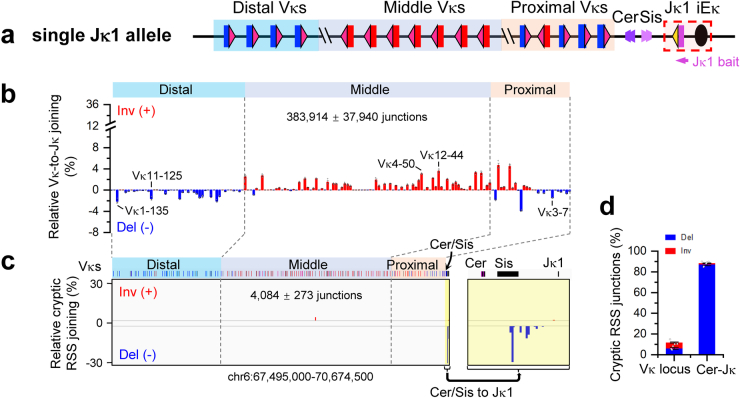
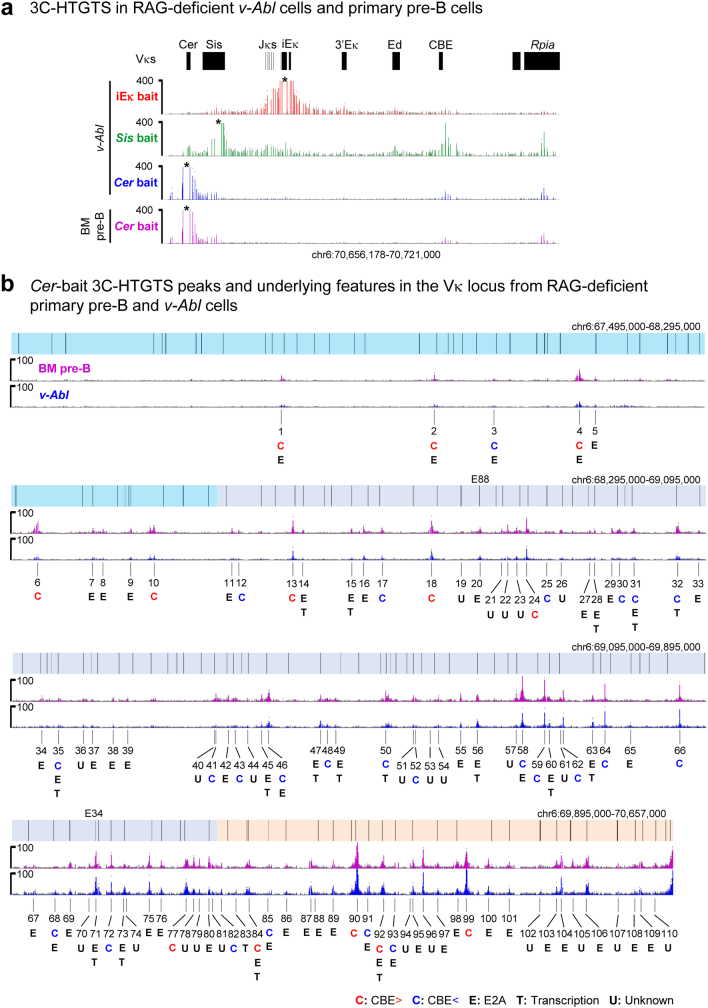
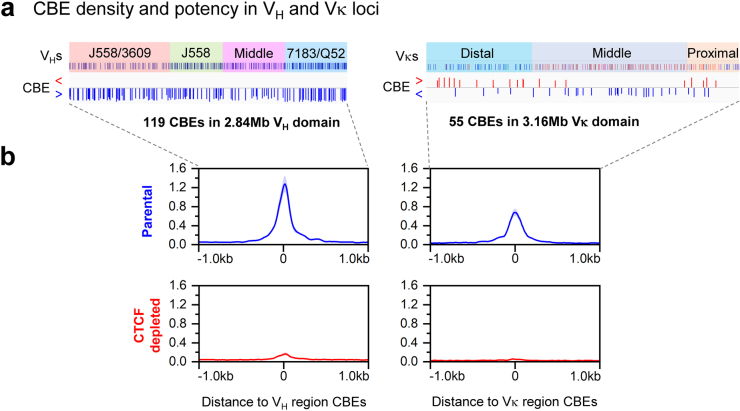
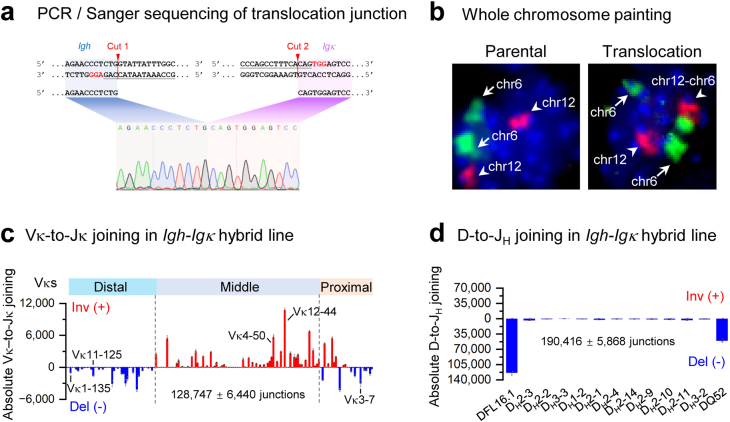
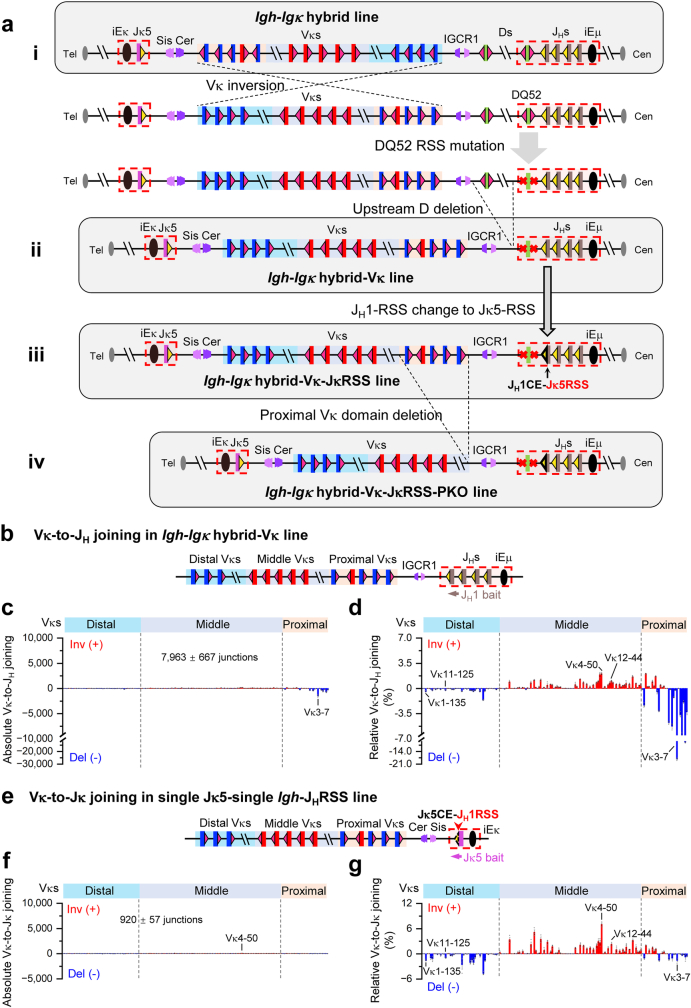
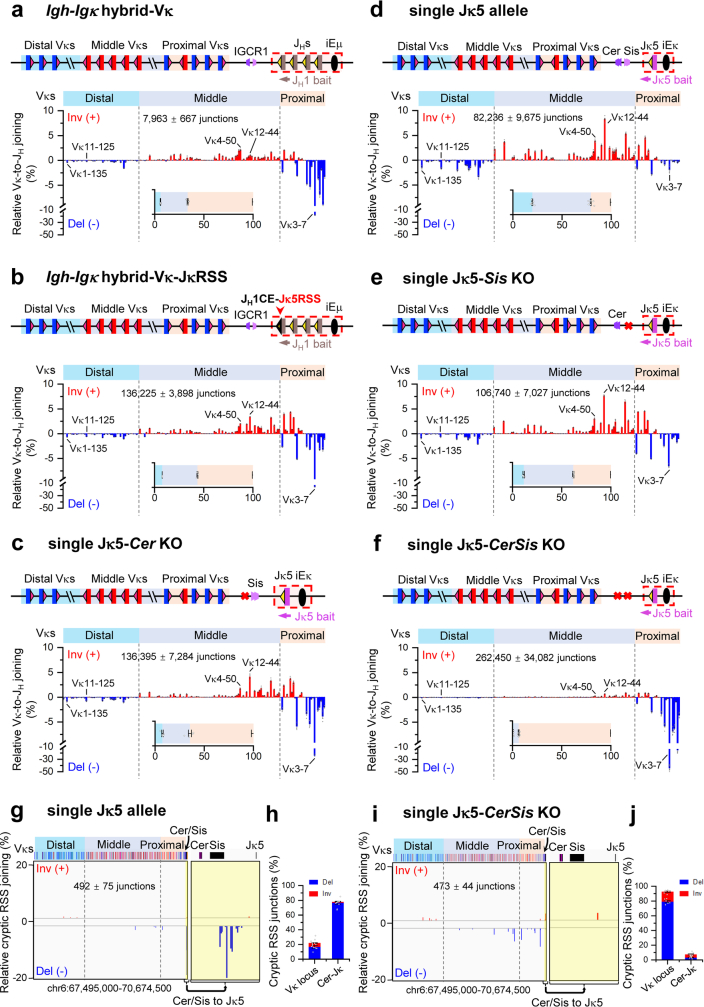
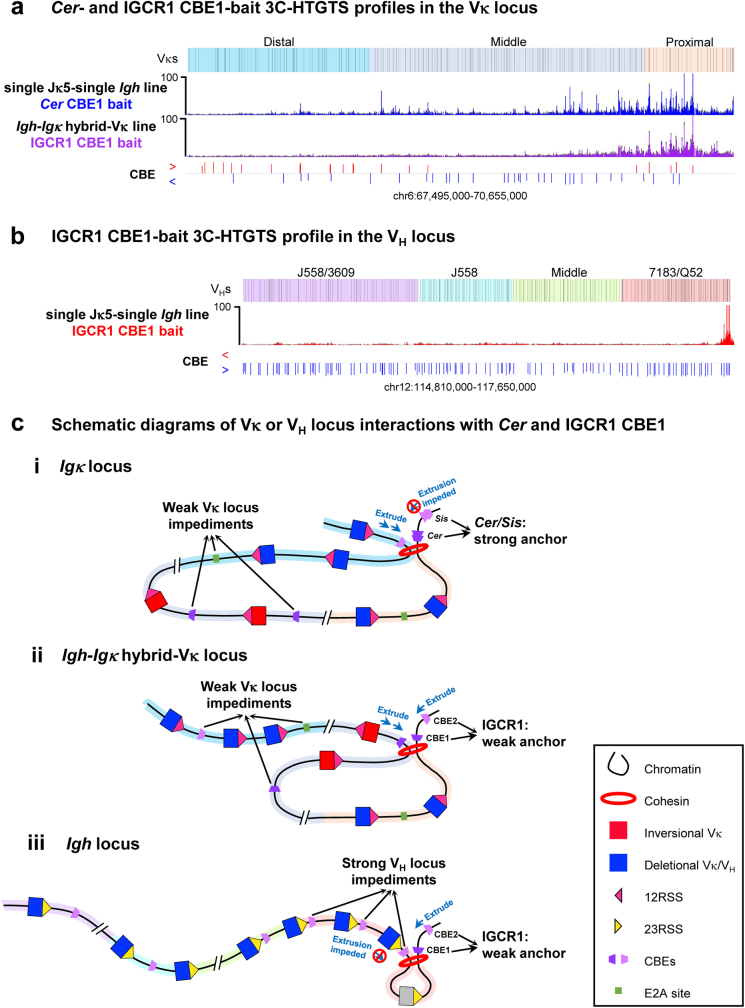
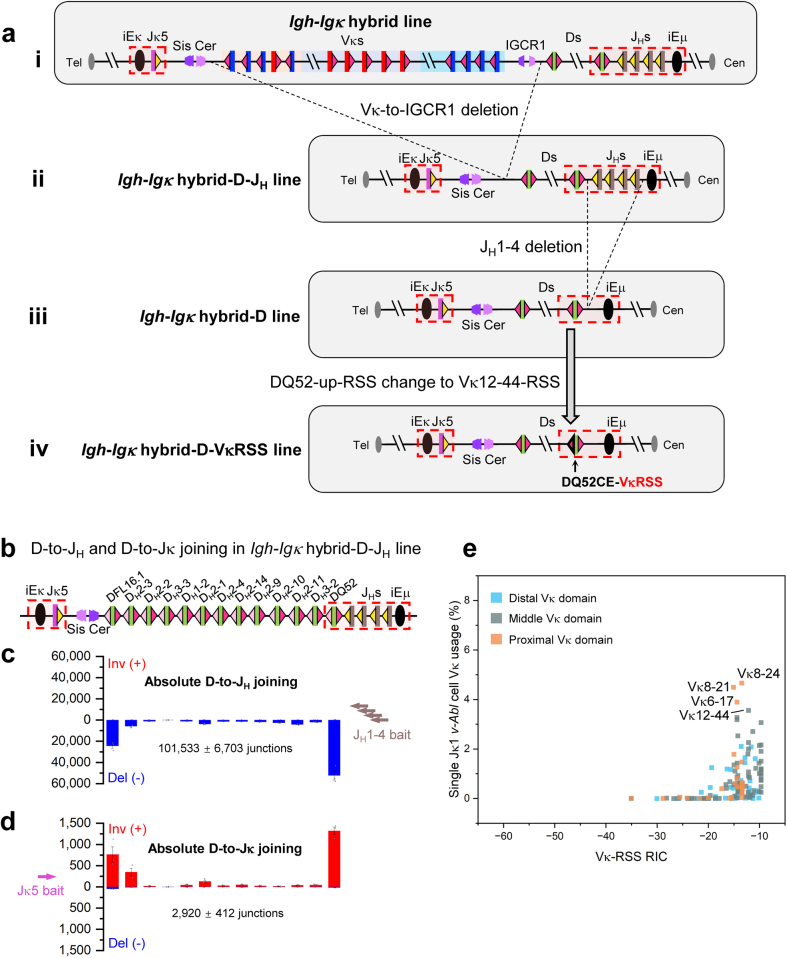
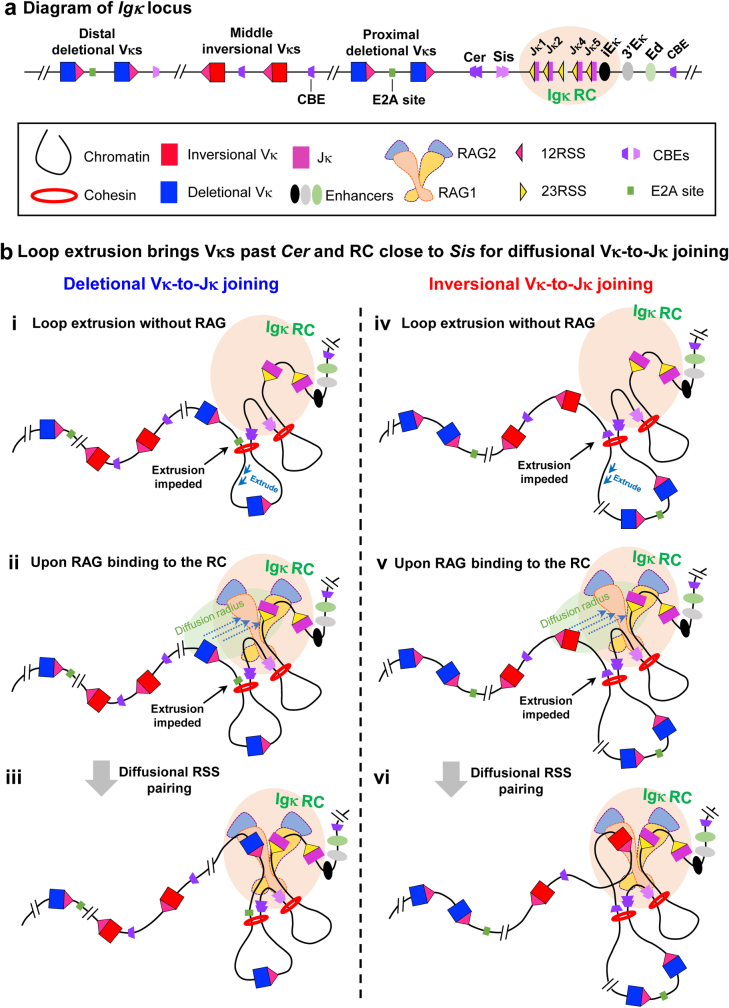
In developing B cells, V(D)J recombination assembles exons encoding IgH and Igκ variable regions from hundreds of gene segments clustered across Igh and Igk loci. V, D and J gene segments are flanked by conserved recombination signal sequences (RSSs) that target RAG endonuclease1. RAG orchestrates Igh V(D)J recombination upon capturing a JH-RSS within the JH-RSS-based recombination centre1-3 (RC). JH-RSS orientation programmes RAG to scan upstream D- and VH-containing chromatin that is presented in a linear manner by cohesin-mediated loop extrusion4-7. During Igh scanning, RAG robustly utilizes only D-RSSs or VH-RSSs in convergent (deletional) orientation with JH-RSSs4-7. However, for Vκ-to-Jκ joining, RAG utilizes Vκ-RSSs from deletional- and inversional-oriented clusters8, inconsistent with linear scanning2. Here we characterize the Vκ-to-Jκ joining mechanism. Igk undergoes robust primary and secondary rearrangements9,10, which confounds scanning assays. We therefore engineered cells to undergo only primary Vκ-to-Jκ rearrangements and found that RAG scanning from the primary Jκ-RC terminates just 8 kb upstream within the CTCF-site-based Sis element11. Whereas Sis and the Jκ-RC barely interacted with the Vκ locus, the CTCF-site-based Cer element12 4 kb upstream of Sis interacted with various loop extrusion impediments across the locus. Similar to VH locus inversion7, DJH inversion abrogated VH-to-DJH joining; yet Vκ locus or Jκ inversion allowed robust Vκ-to-Jκ joining. Together, these experiments implicated loop extrusion in bringing Vκ segments near Cer for short-range diffusion-mediated capture by RC-based RAG. To identify key mechanistic elements for diffusional V(D)J recombination in Igk versus Igh, we assayed Vκ-to-JH and D-to-Jκ rearrangements in hybrid Igh-Igk loci generated by targeted chromosomal translocations, and pinpointed remarkably strong Vκ and Jκ RSSs. Indeed, RSS replacements in hybrid or normal Igk and Igh loci confirmed the ability of Igk-RSSs to promote robust diffusional joining compared with Igh-RSSs. We propose that Igk evolved strong RSSs to mediate diffusional Vκ-to-Jκ joining, whereas Igh evolved weaker RSSs requisite for modulating VH joining by RAG-scanning impediments.


Conflict of interest statement

The authors declare no competing interests.

Figures

Fig. 1
Fig. 1. Vκ locus inversion maintains utilization of deletional and inversional Vκ segments in bone marrow pre-B cells and in v-Abl cells.
a, Illustration of mouse Igk (not to scale). Relative location of proximal (orange shadow) and distal (blue shadow) mainly deletional-oriented Vκ segments and middle (grey shadow) mainly inversional-oriented Vκ segments. Cer and Sis lie downstream of the proximal Vκ; Cer upstream-oriented (purple trapezoids) and Sis downstream-oriented (pink trapezoids) CBEs are indicated. Four functional Jκ segments downstream of Sis, with the Igk intronic enhancer (iEκ), form the RC (dashed red rectangle). Further downstream, the Cκ, Igk enhancers, RSS and upstream-oriented CBE are indicated. Vκ segments are flanked by 12RSSs (red triangles) and Jκ segments by 23RSSs (yellow triangles). Vκ locus CBEs are shown in Fig. 2. WT, wild type. b,c, Relative utilization of individual Vκ segments on wild-type alleles in v-Abl cells (b) and bone marrow (BM) pre-B cells (c) baiting from Jκ5 (indicated in a). Inv, inversional joins; Del, deletional joins. Locations of selected Vκ segments are indicated—these features are retained in subsequent figures. Vκ usage patterns in b,c are highly similar (two-sided Pearson’s r = 0.88, P = 2.2 × 10−53). d, Illustration of inverted Vκ locus. e,f, Relative utilization of individual Vκ segments on inverted Vκ alleles in v-Abl cells (e) and bone marrow pre-B cells (f) assayed with Jκ5 bait. Vκ usage data in the inverted locus is shown in the inverted orientation. Vκ usage patterns in e,f are highly similar (two-sided Pearson’s r = 0.97, P = 5.5 × 10−97). Junction numbers are shown in each panel and in subsequent figures for comparison of absolute levels. Vκ utilization data are presented as mean ± s.e.m. from 4 (b,e) or 7 (c,f) biological repeats. Source Data
Fig. 2
Fig. 2. RAG scanning for primary Igk rearrangement is terminated within Sis while Cer interacts across the Vκ locus.
a, Diagram of the single Igk allele v-Abl line. b, Relative utilization of individual Vκ segments in the single Igk allele line with Jκ5 bait. c, Percentage of pooled RAG off-target junctions in Igk locus from the single Igk allele line. The region between Cer and Jκ, highlighted in yellow, is enlarged on the right. d, Percentage of inversional and deletional cryptic RSS junctions within indicated Vκ locus (chromosome (chr.) 6:67,495,000–70,657,000) and Cer–Jκ regions (chr. 6:70,657,000–70,674,500) from the single Igk allele line. e, Diagram of the single Jκ5 allele v-Abl line. fh, Vκ usage (f) and RAG off-target profiles (g,h) in the single Jκ5 allele line presented as in bd. i, Diagram of the single Jκ5-Vκ inv v-Abl line. jl, Vκ usage (j) and RAG off-target profiles (k,l) in the single Jκ5-Vκ inv line presented as in bd. Vκ1-135 is over-utilized (j), probably owing to its associated transcription. In Fig. 1e,f, Vκ2-137 is equally used, probably owing to its replacement of primary Vκ1-135 inversional rearrangements via deletional secondary rearrangements. Vκ usage data and RAG off-target junctions in the inverted locus are shown in inverted orientation (j,k). m, Chromosome conformation capture (3C)-HTGTS profiles in the Igk locus from RAG-deficient v-Abl cells baiting from iEκ (red), Sis CBE2 (green) and Cer CBE1 (blue) and from RAG-deficient primary pre-B cells baiting from Cer CBE1 (pink). Asterisks indicate the location of baits. Locations of Cer-baited interaction peaks in the Vκ locus significantly above background are indicated with black lines, CBEs in the Igk locus are indicated with red (rightward) and blue (leftward) lines. Details on peak calling are provided in  Methods. Vκ utilization and cryptic RSS data are presented as mean ± s.e.m. from 4 (b,d), 7 (f,h) or 3 (j,l) biological repeats; 3C-HTGTS data are presented as mean value from 2 biological repeats. Source Data
Fig. 3
Fig. 3. Inverting RC RSS orientation reverses RAG scanning direction and abrogates IgH, but not Igκ, V(D)J recombination.
a, Diagram of pre-rearranged DQ52JH4 in DJH-WT (top) and DJH-inv (bottom) WAPL-degron v-Abl lines. b, Diagram of Jκ5 in normal (top) and inverted (bottom) orientation from the single Jκ5 and single Jκ5-inv v-Abl lines. c, Absolute level of individual VH usage from DJH-WT (top) and DJH-inv (bottom) lines with WAPL depletion. d, Absolute level of individual Vκ usage from the single Jκ5 allele (top) and single Jκ5-inv (bottom) lines. e, Absolute level of pooled RAG off-target junctions from three repeats in the Igh locus from DJH-WT (top) and DJH-inv (bottom) lines with WAPL depletion. f, Absolute level of pooled RAG off-target junctions from three repeats in the Igk locus from the single Jκ5 (top) and single Jκ5-inv (bottom) lines. RAG off-target junction profiles downstream of the Igk locus from Cer to the downstream CBE are enlarged on the right. The single Jκ5 allele data (d,f, top) are the same as those shown in Fig. 2f,g; but are plotted here as absolute levels rather than percentages for better alignment and comparison with results from the single Jκ5-inv line. g, Percentage of inversional (red) and deletional (blue) cryptic RSS junctions within indicated DJH upstream (chr. 12:114,666,726–117,300,000) and downstream (chr. 12:114,400,000–114,666,725) region from the DJH-WT (left) and DJH-inv (right) lines with WAPL depletion. h, Percentage of inversional (red) and deletional (blue) cryptic RSS junctions within indicated Jκ5 upstream (chr. 6:67,495,000–70,674,000) and downstream (chr. 6: 70,674,001–70,710,000) region from the single Jκ5 allele (left) and single Jκ5-inv (right) lines. Data are presented as mean ± s.e.m. from 3 (c,g), 7 (d, top, h, left) or 4 (d, bottom, h, right) biological repeats. Source Data
Fig. 4
Fig. 4. RSS replacements in Igh–Igk hybrid loci demonstrate superior strength of Igk-RSSs versus Igh-RSSs.
a, Strategy for generating a targeted chromosomal translocation between chr. 12 and chr. 6 in the single Jκ5-single Igh v-Abl line. Cut 1 and Cut 2 show the locations of two single guide RNAs (sgRNAs) used for targeting. b,c, Absolute level (b) and relative percentage (c) of individual Vκ-to-JH joins in the Igh–Igk hybrid line with JH1-4 bait. The patterns of Vκ usage in c and Fig. 2j are highly similar (two-sided Pearson’s r = 0.98, P = 9.6 × 10−110). d, Absolute level of individual Vκ-to-JH joins in the Igh–Igk hybrid-Vκ-JκRSS line in which JH1-23RSS was replaced with a Jκ5-23RSS, assayed with JH1 bait. The patterns of Vκ usage in d and Extended Data Fig. 5d are highly similar (two-sided Pearson’s r = 0.89, P = 1.6 × 10−56), but total rearrangement level in d is 17-fold higher than that in Extended Data Fig. 5c (P = 0.0007; unpaired, two-sided Welch’s t-test). Note that Vκ3-7 is highly over-utilized, perhaps promoted by its closely associated E2A site (Supplementary Data 1). e, Absolute level of individual Vκ-to-Jκ joins in the single Jκ5-single Igh line with Jκ5 bait. f, Absolute level of individual Vκ-to-JH joins in the Igh–Igk hybrid-Vκ-JκRSS-PKO line in which proximal Vκ domain was deleted, assayed with JH1 bait. g, Absolute level of individual Vκ-to-Jκ joins in the single Jκ5-PKO line with Jκ5 bait. The patterns of Vκ usage in f,g are highly similar (two-sided Pearson’s r = 0.90, P = 1.2 × 10−49). Vκ utilization data are presented as mean ± s.e.m. from 3 biological repeats. Source Data
Fig. 5
Fig. 5. Igk-RSSs enhance diffusional D-to-Jκ joining in the Igh–Igk hybrid locus and activate inversional VH-to-DJH joining in the Igh locus.
a,b, Absolute level of individual D-to-Jκ joins in the Igh–Igk hybrid-D line (a) and the Igh–Igk hybrid-D-VκRSS line in which the DQ52 upstream 12RSS was replaced with a Vκ12-44 12RSS (b), assayed with Jκ5 bait. Deletional DQ52-to-Jκ5 joining in b is 114-fold higher than that in a (P = 0.0008). ce, Absolute level of individual inversional VH-to-DJH joins in the DJH-inv line (c), the DJH-inv-VκRSS line, in which DQ52 upstream 12RSS was replaced with a Vκ11-125 12RSS (d) and the DJH-inv-VκRSS-JκRSS line, in which VH5-2 23RSS was replaced with a Jκ1-23RSS (e), assayed with JH4 bait. Total rearrangement level in d is 13-fold higher than that in c (P = 0.0153). Inversional VH5-2 usage level in e is 35-fold higher than that in d (P = 0.0005) and 383-fold higher than that in c (P = 0.0007). In ae, red arrows show inversional joins and blue arrows show deletional joins. Corresponding junction numbers are shown. Arrow thickness represents relative amounts of junctions. f, Comparison of relative Vκ usage in the single Jκ5 allele v-Abl cells with Vκ-RSS RIC scores calculated using the Recombination Signal Sequences Site (http://www.itb.cnr.it/rss). Vκ segments are colour-coded according to the three Vκ domains with names indicated for highly used Vκ segments. g, Comparison of relative VH usage in primary pro-B cells with VH-RSS RIC scores. VH segments are colour-coded according to the four VH domains, and square black outlines indicate VH segments with CBEs within 20 bp of their RSSs. The circled VH5-1, VH5-2 and VH2-2 have been shown to depend on associated CBEs for robust utilization. D and VH utilization data are presented as mean ± s.e.m. from 4 (a,d), 6 (b) and 3 (c,e) biological repeats. P values were calculated with unpaired, two-sided Welch’s t-test. Source Data
Extended Data Fig. 1
Extended Data Fig. 1. RAG scanning for primary Vκ-to-Jκ1 rearrangement is terminated within Sis. Related to Fig. 2.
a, Diagram of single Jκ1 allele v-Abl line. b, Relative utilization percentage of individual Vκs in single Jκ1 allele line with Jκ1 bait. c, Percentage of pooled RAG off-target junctions in Igκ locus from single Jκ1 allele line. Right panel: zoom-in to the region between Cer and Jκ, highlighted in yellow. d, Percentage of inversional (red) and deletional (blue) cryptic RSS junctions within indicated Vκ locus (chr6:67,495,000-70,657,000) and Cer-Jκ regions (chr6:70,657,000- 70,674,500) from single Jκ1 allele line. Vκ utilization and cryptic RSS data are presented as mean ± s.e.m. from 3 biological repeats. Overall figure presentation is as described in Fig. 2. Note that the total on-target and off-target Jκ1 junctions recovered are, respectively, 5-fold and 8-fold greater than those recovered with a Jκ5 bait, consistent with the greater strength of the Jκ1-RSS. Source Data
Extended Data Fig. 2
Extended Data Fig. 2. Cer interacts with various loop extrusion impediments across the Vκ locus but not substantially with sequences downstream of Sis. Related to Fig. 2.
a, 3C-HTGTS profiles in the Igκ downstream region from Cer to the downstream Rpia gene from RAG-deficient v-Abl cells, baiting from iEκ (red), Sis CBE2 (green) and Cer CBE1 (blue) and from RAG-deficient primary pre-B cells baiting from Cer CBE1 (pink). Black asterisks indicate the location of baits. b, 3C-HTGTS interaction profiles across the Vκ locus when baiting from Cer CBE1 in RAG-deficient primary pre-B (pink) and v-Abl (blue) cells. Cer interaction peaks and their underlying features in the Vκ locus are shown. A total of 110 peaks were called to be significantly above background in either primary pre-B cells or v-Abl cells. Peaks are indicated with black lines and numbered according to their locations from distal to proximal. For each peak, underlying features within ± 1 kb are indicated, including rightward CBE (“C” in red), leftward CBE (“C” in blue), E2A-binding sequence (“E”) and transcription (“T”). Peaks without any obvious underlying features are labeled as unknown (“U”). CBE annotation and transcription were determined based on published CTCF ChIP-seq and GRO-seq data in RAG-deficient v-Abl cells. E2A binding was determined based on published E2A ChIP-seq data in RAG-deficient primary pro-B cells. See Methods for more details. 3C-HTGTS data are presented as mean value from 2 biological repeats.
Extended Data Fig. 3
Extended Data Fig. 3. VH locus CBEs are more dense and more potent than Vκ locus CBEs. Related to Fig. 2.
a, Locations of CBEs in the VH locus (left) and Vκ locus (right). There are 119 annotated CBEs in the 2.84 Mb VH locus and 55 annotated CBEs in the 3.16 Mb Vκ locus. The two loci are shown on the same genomic scale to reflect the difference in CBE density. In the Vκ locus, rightward CBEs are shown in red, leftward CBEs are in blue. In the VH locus, leftward CBEs are shown in red, rightward CBEs are in blue. b, Average enrichment of CTCF ChIP-seq signal within ± 1 kb region across all annotated CBEs in the VH locus (left) and Vκ locus (right) in RAG-deficient parental v-Abl cells (blue) or CTCF-depleted v-Abl cells (red). Data are presented as average signal counts (solid blue or red line) ± s.e.m. (blue or red shade) from 3 biological repeats. The CTCF ChIP-seq data shown were extracted from data deposited in the context of a prior study of RAG-deficient parental and CTCF-depleted v-Abl cells. Source Data
Extended Data Fig. 4
Extended Data Fig. 4. Igh-Igκ hybrid line generated by targeted chromosomal translocation maintains normal D-to-JH and Vκ-to-Jκ rearrangements. Related to Fig. 4.
a, Confirmation of translocation junction in Igh-Igκ hybrid v-Abl line (shown in Fig. 4a) by PCR/Sanger sequencing. The sgRNA sequences are underlined, sgRNA cut sites are indicated by red arrows, and the Cas9 PAM sequences are labeled in red. b, Whole chromosome painting results with probes tiling chromosome 6 (green) and chromosome 12 (red) in single Jκ5-single Igh v-Abl cells (“Parental”, left) and Igh-Igκ hybrid v-Abl cells (“Translocation”, right). After translocation, a chr12-chr6 fusion chromosome is detected with half of chr6 appended onto chr12. The reciprocal translocation also placed the small telomeric portion (~7 Mb) of chr12 onto chr6, which is below the detectable size of painting experiments. c, Absolute level of individual Vκ-to-Jκ joins in Igh-Igκ hybrid line with Jκ5 bait. d, Absolute level of individual D-to-JH joining in Igh-Igκ hybrid line with JH1-4 bait. Vκ and D usage data are presented as mean ± s.e.m. from 3 biological repeats. Source Data
Extended Data Fig. 5
Extended Data Fig. 5. Genetic modifications in the Igh-Igκ hybrid line and single Jκ5 allele line. Related to Fig. 4.
a, Diagram of the strategy for various genetic modifications in the Igh-Igκ hybrid v-Abl line. In brief: (i) Diagram of the Igh-Igκ hybrid line. (ii) Diagram of the Igh-Igκ hybrid-Vκ line which was generated from the Igh-Igκ hybrid line by inverting the whole Vκ locus, mutating both RSSs of DQ52, and deleting all upstream Ds, as illustrated in the diagrams just above. (iii) Diagram of the Igh-Igκ hybrid-Vκ-JκRSS line which was generated from the Igh-Igκ hybrid-Vκ line by replacing the JH1-23RSS with a Jκ5-23RSS. (iv) Diagram of the Igh-Igκ hybrid-Vκ-JκRSS-PKO line which was generated from the Igh-Igκ hybrid-Vκ-JκRSS line by deleting the proximal Vκ domain. See Methods for more details. b, Diagram of Igh-Igκ hybrid-Vκ line, as shown in a(ii). c, Absolute level, and d, relative percentage of individual Vκ-to-JH joins in Igh-Igκ hybrid-Vκ line with JH1 bait. The patterns of distal and middle Vκ usage in the Igh-Igκ hybrid-Vκ line (d) and the single Jκ5-single Igh line (Fig. 4e) are similar (Two-sided Pearson’s r = 0.70, P = 2.2e-21). e, Illustration of single Jκ5-single Igh-JHRSS line, in which Jκ5-23RSS was replaced with JH1-23RSS. f, Absolute level, and g, relative percentage of individual Vκ-to-Jκ joins in single Jκ5-single Igh-JHRSS line with Jκ5 bait. Total rearrangement level in f is 100-fold lower than that in Fig. 4e (P = 0.0006; unpaired, two-sided Welch t-test). Vκ usage data are presented as mean ± s.e.m. from 3 biological repeats. Source Data
Extended Data Fig. 6
Extended Data Fig. 6. IGCR1 is a weaker anchor than Cer-Sis in preventing over-utilization of proximal deletional Vκs. Related to Fig. 4.
a-f, Relative utilization percentage of individual Vκs in Igh-Igκ hybrid-Vκ line (a), Igh-Igκ hybrid-Vκ-JκRSS line (b), single Jκ5-Cer KO line (c), single Jκ5 allele line (d), single Jκ5-Sis KO line (e), single Jκ5-CerSis KO line (f) analyzed with indicated baits. Bar graph in the inset of each panel shows the percentage of distal (blue), middle (gray) and proximal (orange) Vκ domain usage from the corresponding line. g, Percentage of pooled RAG off-target junctions in Igκ locus from single Jκ5 allele line. Right panel: zoom-in to the region between Cer and Jκ, highlighted in yellow. h, Percentage of inversional (red) and deletional (blue) cryptic RSS junctions from single Jκ5 allele line within indicated regions as in Fig. 2d. i-j, RAG off-target profiles in single Jκ5-CerSis KO line presented as in g-h. A group of aberrant pseudo-normal coding-end junctions to sequences near the Igκ downstream CBE were excluded. The patterns of Vκ usage in a, b and c are highly similar (a and c, Two-sided Pearson’s r = 0.91, P = 1.5e-63; b and c, Two-sided Pearson’s r = 0.97, P = 1.0e-99). The data shown in a and d are the same as that shown in Extended Data Fig. 5d and Fig. 2f, the data shown in g and h are the same as that shown in Fig. 2g and h, respectively, plotted here for better alignment and comparison with other results. Vκ utilization and cryptic RSS data are presented as mean ± s.e.m. from 3 (a,b,e), 4 (c), 7 (d,h) or 6 (f,j) biological repeats. Source Data
Extended Data Fig. 7
Extended Data Fig. 7. Interactions of IGCR1 or Cer-Sis with VH or Vκ locus in v-Abl cells. Related to Fig. 4 and Extended Data Fig. 3.
a, Upper panel: 3C-HTGTS profiles in the Vκ locus from single Jκ5-single Igh v-Abl line baiting from Cer CBE1. Lower panel: 3C-HTGTS profiles in the Vκ locus from Igh-Igκ hybrid-Vκ v-Abl line baiting from IGCR1 CBE1. b, 3C-HTGTS profiles in the VH locus from single Jκ5-single Igh line baiting from IGCR1 CBE1. CBE sites are shown in a and b with orientations labeled as in Extended Data Fig. 3a. 3C-HTGTS data are presented as mean ± s.e.m. from 3 biological repeats (a) or as mean value from 2 biological repeats (b). c, Schematic loop domain illustrations of Igκ, Igh, and Igh-Igκ hybrid-Vκ loci based on 3C-HTGTS data shown in a and b. (i) In Igκ locus, the strong anchoring activity of Cer-Sis, coupled with relatively weak impediments in the Vκ locus, allows loop extrusion anchored at Cer to extend across the distal, middle and proximal Vκ domains, as shown in a, upper panel. (ii) In Igh-Igκ hybrid-Vκ locus, loop extrusion anchored at IGCR1 can extend a considerable distance into proximal and middle Vκ domains with weak Vκ locus impediments, but does not extend as far as that in (i), because IGCR1 is a less stable anchor than Cer-Sis and more likely to be disassembled before loop extrusion has a chance to proceed into the distal Vκ locus, as shown in a, lower panel. (iii) In Igh locus without WAPL down-regulation, strong VH locus impediments only allow loop extrusion to bring the most proximal VH region to IGCR1, while upstream interactions are completely blocked by the “wall” of proximal VH CBEs, as shown in b. Elements and proteins illustrated are indicated in the box. Source Data
Extended Data Fig. 8
Extended Data Fig. 8. Genetic modifications in the Igh-Igκ hybrid-D line, and correlation of Vκ usage with RIC score. Related to Fig. 5.
a, Diagram of the strategy for various genetic modifications in the Igh-Igκ hybrid-D v-Abl line. (i) Diagram of the Igh-Igκ hybrid line. (ii) Diagram of the Igh-Igκ hybrid-D-JH line which was generated from the Igh-Igκ hybrid line by deleting all Vκs and IGCR1. (iii) Diagram of the Igh-Igκ hybrid-D line which was generated from the Igh-Igκ hybrid-D-JH line by deleting JH1-4. (iv) Diagram of the Igh-Igκ hybrid-D-VκRSS line which was generated from the Igh-Igκ hybrid-D line by replacing the DQ52 upstream 12RSS with a Vκ12-44 12RSS. See Methods for details. b, Diagram of the Igh-Igκ hybrid-D-JH line as illustrated in a(ii). c, Absolute level of D-to-JH joins baiting from JH1-4 in the Igh-Igκ hybrid-D-JH line. d, Absolute level of D-to-Jκ joins baiting from Jκ5 in the Igh-Igκ hybrid-D-JH line. D utilization data are presented as mean ± s.e.m. from 3 biological repeats. e, Comparison of relative Vκ usage in single Jκ1 allele v-Abl cells with Vκ-RSS RIC scores. Vκs are color-coded according to the three Vκ domains with names indicated for highly used Vκs. Source Data
Extended Data Fig. 9
Extended Data Fig. 9. Working model for short-range diffusion-mediated primary Igκ V(D)J recombination.
a, Diagram of Igκ (not to scale). Elements and proteins illustrated are indicated in the box. b, Working model. (i) Loop extrusion of downstream chromatin through a cohesin ring impeded in the upstream direction at Sis juxtaposes the RC, a downstream impediment, to Sis. Simultaneously, loop extrusion of upstream chromatin through a cohesin ring impeded in the downstream direction at Cer brings the Vκ locus past Cer. (ii) During extrusion past Cer, relatively weak extrusion impediments, including CBEs and E2A sites (illustrated) across the Vκ locus dynamically impede extrusion at Cer, providing more opportunity for Vκ-RSSs to remain in short-range diffusion distance for interactions with RC-bound RAG. (iii) Binding of paired strong Vκ-RSSs to the RAG-1 active site across from strong Jκ-RSSs promote robust cleavage and/or joining. (iv-vi) Only a fraction of Vκ-RSSs brought into diffusion range pair with Jκ-RSSs, allowing extrusion to continue upstream where impediments slow down extrusion past Cer, providing opportunity for additional Vκ-RSSs to interact with RC-bound RAG. These panels diagram use of inversional-oriented Vκs, which can interact by the same short-range diffusion process outlined for deletional Vκs. The diagram is simplified to provide a general overview of the proposed mechanism, for which details await high resolution studies. Due to relatively weak Igκ impediments, this model is compatible with cohesin loading across the Vκ locus. Also, RAG is likely not continuously bound to the RC,, allowing extrusion to continue past Cer. These latter features could allow active RAG-bound RCs to initiate the process at different points across the Vκ locus to optimize diverse Vκ utiliation,. Human Igκ, which undergoes deletional and inversional joining, has Cer-Sis-like elements in the Vκ-Jκ interval,, and high Vκ-RSS RIC scores, consistent with employing a similar primary rearrangement mechanism to mouse Igκ.

Comment in

Similar articles

Cited by

References

    1. Schatz DG, Swanson PC. V(D)J recombination: mechanisms of initiation. Annu. Rev. Genet. 2011;45:167–202. doi: 10.1146/annurev-genet-110410-132552. - DOI - PubMed
    1. Zhang Y, Zhang X, Dai H-Q, Hu H, Alt FW. The role of chromatin loop extrusion in antibody diversification. Nat. Rev. Immunol. 2022;22:550–566. doi: 10.1038/s41577-022-00679-3. - DOI - PMC - PubMed
    1. Jain S, Ba Z, Zhang Y, Dai H-Q, Alt FW. CTCF-binding elements mediate accessibility of RAG substrates during chromatin scanning. Cell. 2018;174:102–116.e14. doi: 10.1016/j.cell.2018.04.035. - DOI - PMC - PubMed
    1. Hu J, et al. Chromosomal loop domains direct the recombination of antigen receptor genes. Cell. 2015;163:947–959. doi: 10.1016/j.cell.2015.10.016. - DOI - PMC - PubMed
    1. Zhang Y, et al. The fundamental role of chromatin loop extrusion in physiological V(D)J recombination. Nature. 2019;573:600–604. doi: 10.1038/s41586-019-1547-y. - DOI - PMC - PubMed