. 2024 Jun;630(8016):429-436.
doi: 10.1038/s41586-024-07502-0. Epub 2024 May 29.

A Gram-negative-selective antibiotic that spares the gut microbiome

Affiliations

A Gram-negative-selective antibiotic that spares the gut microbiome

Kristen A Muñoz et al. Nature. 2024 Jun.

Abstract

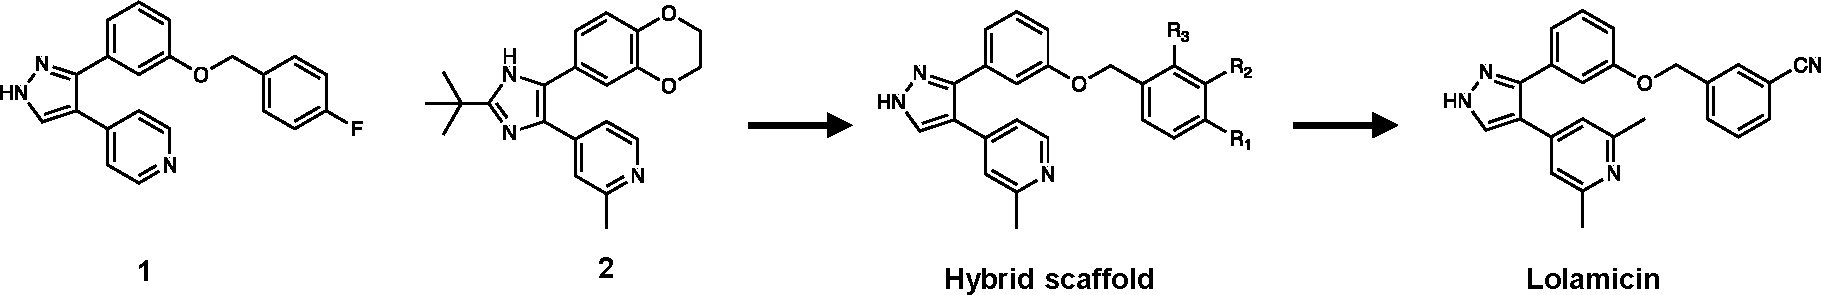
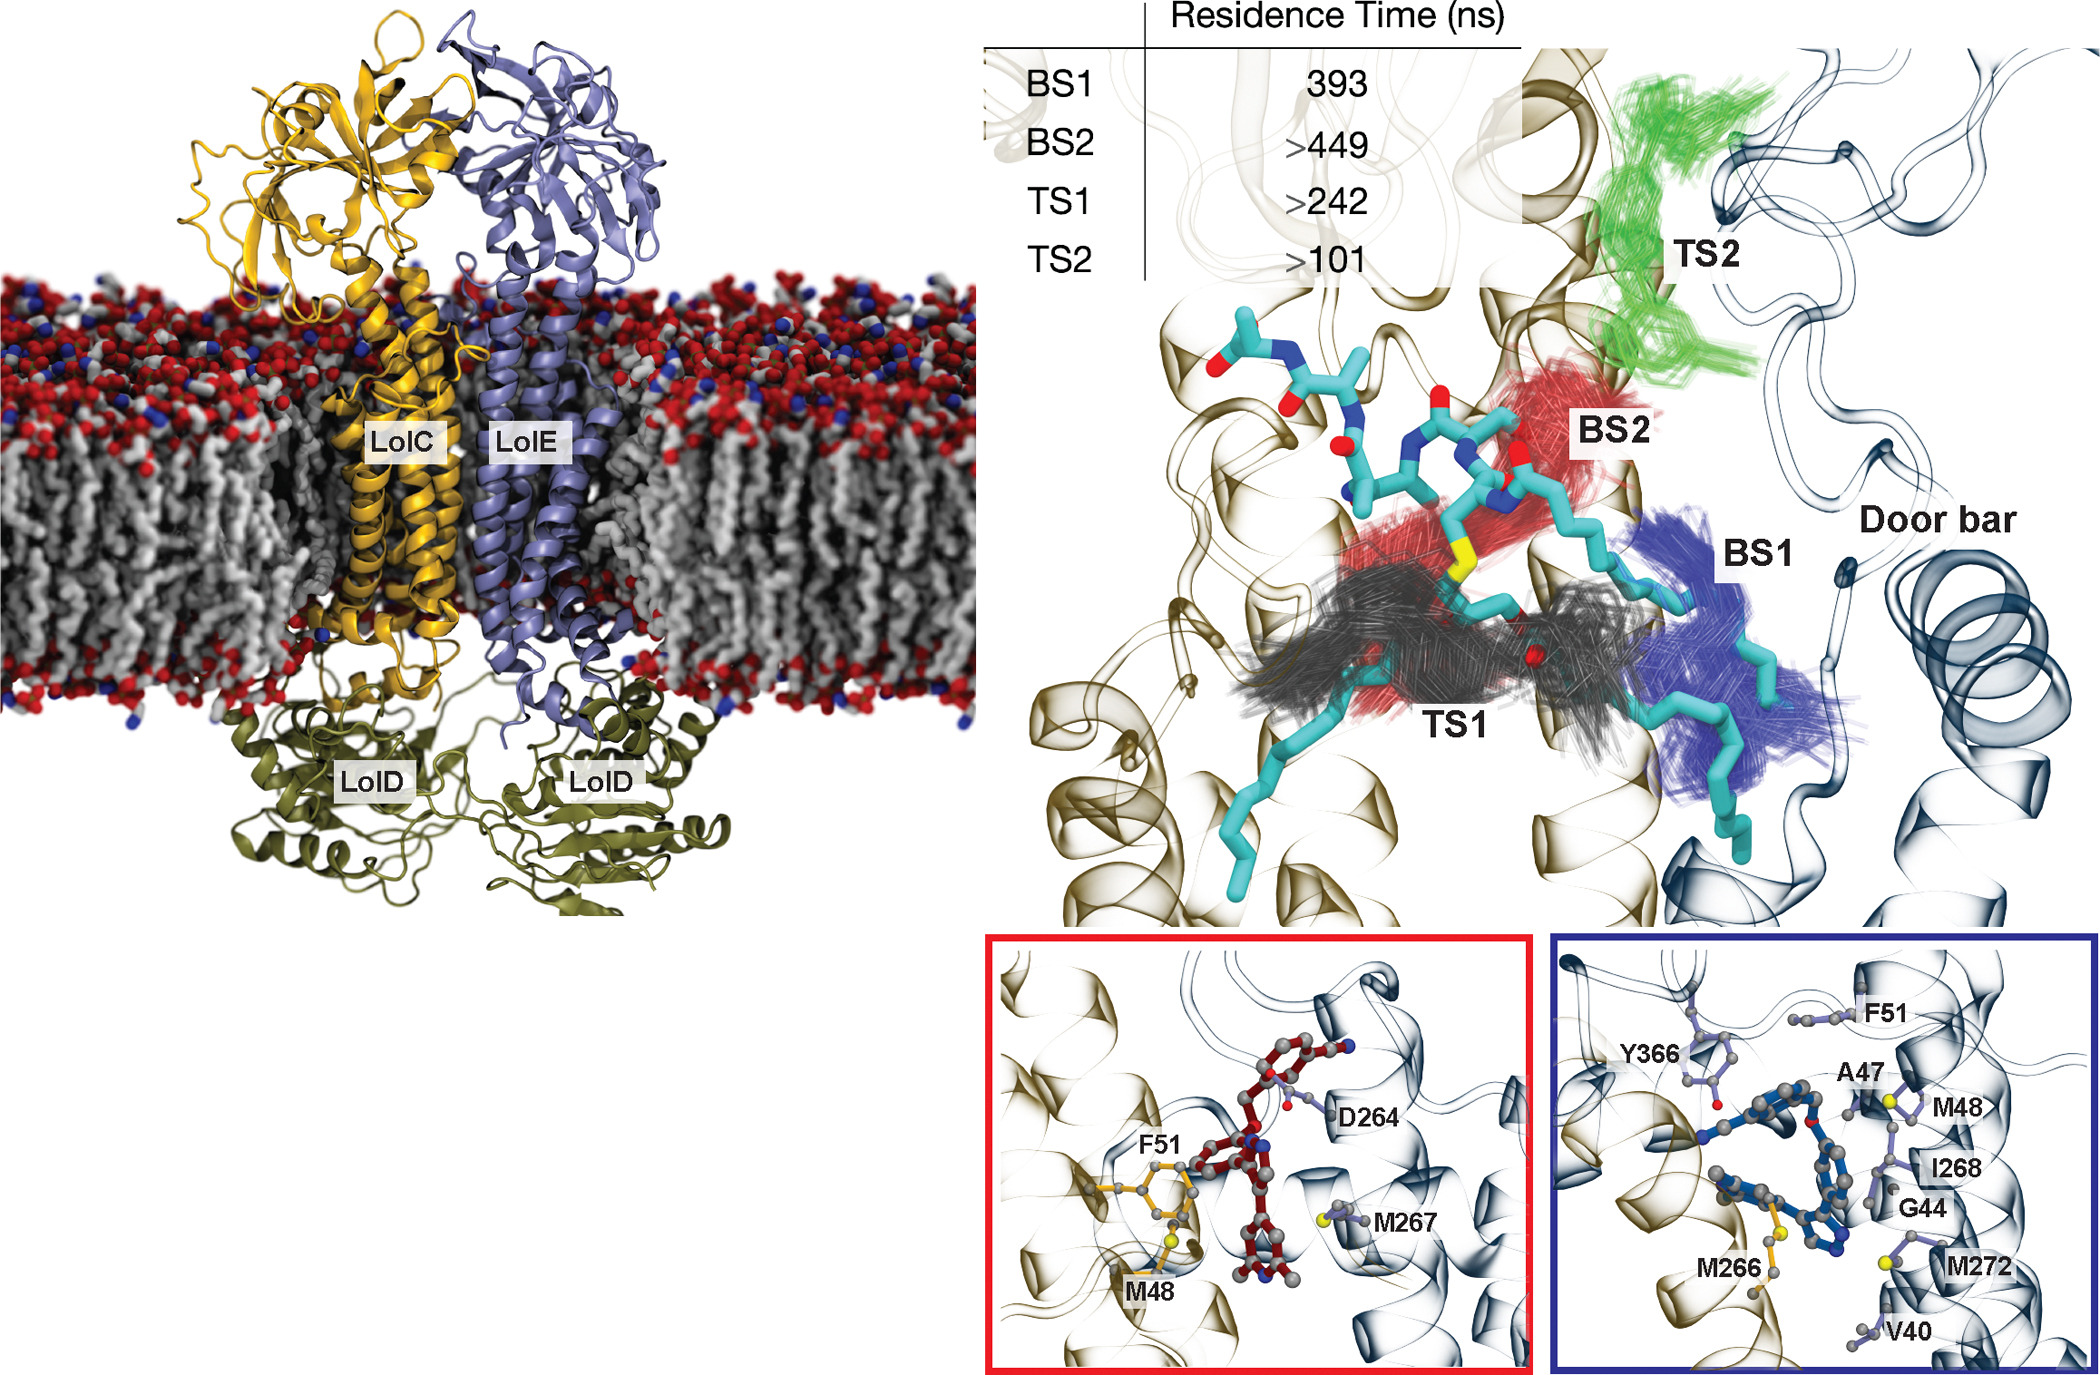
Infections caused by Gram-negative pathogens are increasingly prevalent and are typically treated with broad-spectrum antibiotics, resulting in disruption of the gut microbiome and susceptibility to secondary infections1-3. There is a critical need for antibiotics that are selective both for Gram-negative bacteria over Gram-positive bacteria, as well as for pathogenic bacteria over commensal bacteria. Here we report the design and discovery of lolamicin, a Gram-negative-specific antibiotic targeting the lipoprotein transport system. Lolamicin has activity against a panel of more than 130 multidrug-resistant clinical isolates, shows efficacy in multiple mouse models of acute pneumonia and septicaemia infection, and spares the gut microbiome in mice, preventing secondary infection with Clostridioides difficile. The selective killing of pathogenic Gram-negative bacteria by lolamicin is a consequence of low sequence homology for the target in pathogenic bacteria versus commensals; this doubly selective strategy can be a blueprint for the development of other microbiome-sparing antibiotics.


Conflict of interest statement

Competing interests: The University of Illinois has filed patents on compounds described herein on which KAM and PJH are inventors.

Figures

Extended Data Figure 1.
Extended Data Figure 1.. Previously identified LolCDE inhibitors.
(a) Antibiotic assessment of compounds 1 and 2 against a panel of gram-negative pathogens performed as part of this study. MICs were performed in Mueller Hinton broth per CLSI guidelines and are reported in μg/mL. All experiments were performed in biological triplicate. (b) eNTRy rule parameters (Rotatable bonds, Globularity, Functional Group) of compounds 1 and 2 calculated using eNTRyway., Accumulation determined via previously reported accumulation assay and reported in nmol per 1012 colony-forming units (CFUs). Dashed line indicates average accumulation of low accumulating control antibiotics novobiocin, fusidic acid, erythromycin, and rifampicin. Data shown represents the average of three independent experiments with standard deviation of the mean.
Extended Data Figure 2.
Extended Data Figure 2.. Growth competition of lolamicin resistant mutants generated in E. coli BW25113 as compared to wild-type (WT) E. coli BW25113.
Fitness of E. coli isolates that harbor the mutations in lolC (a) or lolE (b) conferring resistance to lolamicin at concentrations 32-fold above the MIC (64 μg/mL) were evaluated for growth in culture relative to the parental strain. Bacteria were cultured in cation-adjusted Mueller Hinton broth at a starting density of 5 × 10³ CFUs/mL and grown for 48 hours at 37°C. At time=0 hr, 24 hr, and 48 hr, cultures were serially diluted and plated on LB agar and LB agar containing 8 μg/mL lolamicin to quantify number of wild-type and lolamicin resistant mutants. Each competition between mutant and the parental strain was assessed in biological triplicate. Measurements were compared using a two-sample Welch’s t-test (one-tailed test, assuming unequal variance). NS, not significant (P ≥ 0.05); * (P < 0.05); ** (P ≤ 0.01). LolC-E195K t=24hr (P = 0.01), t=48hr (P = 0.03); LolC-E255D t=24hr (P = 0.87), t=48hr (P = 0.05); LolC-Q258P t=24hr (P = 0.20), t=48hr (P = 0.35); LolC-M262I t=24hr (P = 0.44), t=48hr (P = 0.18); LolC-N265k t=24hr (P = 0.79), t=48hr (P = 0.55); LolE-D264N t=24hr (P = 0.57), t=48hr (P = 0.24); LolE-L199P t=24hr (P = 0.22), t=48hr (P = 0.02); LolE-I206N t=24hr (P = 0.16), t=48hr (P = 0.42); LolE-F367S t=24hr (P = 0.14), t=48hr (P = 0.04). ǂLolE F367S displayed morphological changes and smaller colonies compared to wild-type E. coli BW25113.
Extended Data Figure 3.
Extended Data Figure 3.. Time-kill kinetics of lolamicin against gram-negative pathogens.
(a) The effect of lolamicin and ciprofloxacin on E. coli BW25113 growth. (b) The effect of lolamicin, tetracycline, and ciprofloxacin on K. pneumoniae ATCC 27736 growth. (c) The effect of lolamicin and ciprofloxacin on E. cloacae ATCC 29893 growth. All experiments were performed in biological triplicate and are represented as mean ± s. e. m.
Extended Data Figure 4.
Extended Data Figure 4.. Lolamicin induces cell swelling in wild-type E. coli and K. pneumoniae but not in lolamicin-resistant mutants.
Confocal microscopy of (a) E. coli BW25113; lolamicin-resistant mutants, (b) BW25113 LolC-N265K, (c) BW25113 LolE-D264N; (d) K. pneumoniae ATCC 27736; and lolamicin-resistant mutants, (e) LolC-Q258L and (f) LolE-V59L. Scale bar is 10 μm. Antibiotics were tested at the following concentrations (3X MIC or just below the solubility limit for lolamicin in resistant mutants): E. coli—DMSO 2%; lolamicin 8 μg/mL for E. coli BW25113, 64 μg/mL for resistant strains; globomycin 24 μg/mL; mecillinam 0.4 μg/mL; aztreonam 0.1 μg/mL. K. pneumoniae—DMSO 2%; lolamicin 3 μg/mL for K. pneumoniae ATCC 27736 or 64 μg/mL for resistant strains; globomycin 64 μg/mL; mecillinam 3 μg/mL; aztreonam 1.5 μg/mL. Cell size (n=25) in E. coli (g) and K. pneumoniae (h) and resistant mutants was quantified. Length and width were measured in ImageJ and cell area calculated using the area formula for an ellipse (A=π*ab where a= ½ length and b= ½ width). Measurements were compared using two-sample Welch’s t-test (one-tailed test, assuming unequal variance). NS, not significant (P > 0.05); *** (P < 0.0005). E. coli BW25113: lolamicin (P = 3.44 × 10⁻¹⁸), globomycin (P = 1.00 × 10⁻¹⁵); E. coli BW25113 LolC-N265K: lolamicin (P = 0.28), globomycin (P = 4.16 × 10⁻¹⁰); E. coli BW25113 LolE-D264N: lolamicin (P = 0.09), globomycin (P = 4.44 × 10⁻¹²). K. pneumoniae ATCC 27736: lolamicin (P = 3.59 × 10⁻¹⁷), globomycin (P = 3.22 × 10⁻¹⁶); K. pneumoniae ATCC 27736 LolC-Q258L: lolamicin (P = 0.22), globomycin (P = 1.26 × 10⁻⁸); K. pneumoniae ATCC 27736 LolE-V59L: lolamicin (P = 0.24), globomycin (P = 2.59 × 10⁻¹¹).
Extended Data Figure 5.
Extended Data Figure 5.. Conformational landscape of LolCDE.
(a) High-frequency residue/lolamicin contact probability. (b) Probability density of lolamicin’s center of mass locations projected onto two reaction coordinates: distances to BS1 and BS2 (blue). Overlaid color traces show compound 3 unbinding in five simulation replicates, highlighting consistent and immediate unbinding from BS1. (c) Reaction coordinates (RCs) used to project free energy landscape of transporter. Two orientation-based RCs, opening of the TMD periplasmic region (α) and opening of the TMD intracellular region (β), and two distance-based RCs, distance between the nucleotide binding domains (dNBD), and distance between periplasmic domains (dPD), were used for conformation projections. (d) Free energy landscape projected onto RCs. Red dots indicate position of starting Cryo-EM structure (7MDX). (e) Lolamicin-resistant mutations overlap with binding pocket for lipoprotein substrates of LolCDE. Predicted luminal tunnel displayed as gray surface. (f) Molecular rendering of LolC K195-LolE D264 salt bridge interaction. Initial (transparent purple) and final (opaque purple) conformations of LolC loop demonstrate change in binding pocket shape upon mutation. Donor-acceptor heavy atom distance of 2.69 Å is highlighted for final conformation. Density plot of salt-bridge distance between LolC E/K195-LolE D264 from WT and mutant simulations highlights salt bridge formation with E195K peak density. (g) Lolamicin bound in BS1. Conformational sampling of lolamicin rendered as a density with a single conformer (stick). Mutation sensitive LolE residues D264 and I268 (density and stick), and distant Q198 (stick) shown. (h) LolE-N265K mutation relative to lipid bilayer. Also highlighted is LolC-G357 for which the N/K265-door bar distance was measured. Wider distribution for mutant state demonstrates instability of nearby binding pocket. (i) Root-mean squared fluctuation (RMSF) values from replica simulations of LolE residues 357 to 377 calculated from multiple simulation replicas for WT and F367S mutants. F/S367 is marked with a dashed line. Increased RMSF for mutant is apparent.
Extended Data Figure 6.
Extended Data Figure 6.. Bacterial composition of mouse fecal microbiota obtained by full-length 16s rRNA sequencing at the Class level.
Taxonomic analysis showing bacterial population shifts over a 31-day period before (Day 0) and after (Day 7, Day 10, and Day 31) administration of antibiotic. CD-1 mice were treated with vehicle (20% DMSO, 30% water, 50% PEG400, n = 6 biologically independent animals) or compound (clindamycin, 100 mg/kg; amoxicillin, 100 mg/kg; or lolamicin, 200 mg/kg; n = 6 biologically independent animals for each compound) twice a day for three days via oral gavage.
Extended Data Figure 7.
Extended Data Figure 7.. Bacterial composition of mouse fecal microbiota obtained by full-length 16s rRNA sequencing at the Order level.
Taxonomic analysis showing bacterial population shifts over a 31-day period before (Day 0) and after (Day 7, Day 10, and Day 31) administration of antibiotic. CD-1 mice were treated with vehicle (20% DMSO, 30% water, 50% PEG400, n = 6 biologically independent animals) or compound (clindamycin, 100 mg/kg; amoxicillin, 100 mg/kg; or lolamicin, 200 mg/kg; n = 6 biologically independent animals for each compound) twice a day for three days via oral gavage.
Extended Data Figure 8.
Extended Data Figure 8.. PCoA ordination of Bray-Curtis dissimilarity values for samples before (day 0) and after (day 7, day 10) lolamicin, amoxicillin, and clindamycin administration.
Vehicle-treated samples are included as negative controls. Samples are grouped by day and color coded as shown in the key. Points represent individual samples for each grouping. CD-1 mice were treated with vehicle (20% DMSO, 30% water, 50% PEG400, n = 6 biologically independent animals) or compound (clindamycin, 100 mg/kg; amoxicillin, 100 mg/kg; or lolamicin, 200 mg/kg; n = 6 biologically independent animals for each compound) twice a day for three days via oral gavage.
Figure 1.
Figure 1.. Identification of lolamicin.
Previously reported pyridinepyrazole (1) and pyridineimidazole (2) LolCDE inhibitors led to a hybrid scaffold and ultimately lolamicin.
Figure 2.
Figure 2.. Antimicrobial assessment and resistance frequency studies of lolamicin.
Activity of compound 1 and lolamicin against multi-drug resistant clinical isolates of (a) E. coli (n = 47), (b) K. pneumoniae (n = 61), and (c) E. cloacae (n = 18). MICs were performed in Mueller Hinton Broth per CLSI guidelines in biological triplicate. See Supplementary Table 6 for a list of resistance genes in clinical isolate panels. A full listing of this MIC data is in Supplementary Tables 7–9. (d) Frequency of E. coli JW5503 ΔtolC resistance to compound 1 and lolamicin. Data are shown as means ± s.e.m., n = 3 biologically independent samples. (e) Frequency of E. coli BW25113, K. pneumoniae ATCC 27736, and E. cloacae ATCC 29893 resistances to lolamicin. Data are shown as means ± s.e.m., n = 3 biologically independent samples.
Figure 3.
Figure 3.. Major binding (BS1, BS2) and transient sites (TS1, TS2) of lolamicin in LolCDE.
Representative structure of LolCDE (7MDX) embedded in a realistic bacterial inner membrane. High-occupancy lolamicin binding modes obtained via RMSD-based clustering (conducted in VMD) of the simulation, overlaid with the Lpp lipoprotein (top, light blue stick representation) from the Cryo-EM LolCDE structure 7MDX. The door bar signifies transmembrane 3 extending into the periplasm and bending toward LolC, parallel to the inner membrane. Lolamicin poses from each cluster are colored blue, red, grey, and green, and the residence time in each binding site is tabulated in the inset. Zoom-in views of BS1 (right) and BS2 (left) with residues with >20% contact probability shown.
Figure 4.
Figure 4.. In vivo efficacy studies with lolamicin.
Acute pneumonia and septicemia infection models initiated with colistin-resistant E. coli AR-0349 (a, b, respectively; 2.7×10⁸ CFUs/mouse for pneumonia models, 4.2×10⁸ CFUs/mouse for septicemia models), colistin-resistant or carbapenem-resistant K. pneumoniae (c, d, respectively; 8.0×10⁷ CFUs/mouse for pneumonia models, 5.8×10⁷ CFUs/mouse for septicemia models), and colistin-resistant E. cloacae AR-0163 (e, f, respectively; 7.2×10⁸ CFUs/mouse for pneumonia models, 9.0×10⁸ CFUs/mouse for septicemia models). CD-1 mice were treated with vehicle (50% DMSO, 50%PEG400) or compound (1 or Lolamicin, 100 mg/kg IP; n=8 biologically independent animals for bacterial burden model, n=15 biologically independent animals for survival model) twice daily post-infection for 3 days. Acute pneumonia and septicemia infection models initiated with colistin-resistant E. coli AR0349 (g, h, respectively; 2.9×10⁸ CFUs/mouse for pneumonia models, 6.0×10⁸ CFUs/mouse for septicemia models). CD-1 mice were treated with vehicle (20% DMSO, 30% water, 50% PEG400) or lolamicin (200 mg/kg PO, n=8 biologically independent animals for bacterial burden model, n=15 biologically independent animals for survival model) twice daily post-infection for 3 days. In a, c, e, and g data are shown as means ± s.d. and statistical significance was determined by one-way ANOVA with Tukey’s multiple comparisons with vehicle as reference. In b, d, f, and h, statistical significance was determined by two-tailed log-rank (Mantel–Cox) test with Lolamicin as reference. NS=not significant (P>0.05), ***P<0.001, ****P<0.0001. In a) compound 1 (P=0.4392), Lolamicin (P<0.0001); in b) vehicle (P<0.0001), compound 1 (P<0.0001); in c) compound 1 (P=0.1407), Lolamicin (P<0.0001); in d) vehicle (P<0.0001), compound 1 (P<0.0001); in e) compound 1 (P=0.0003), Lolamicin (P<0.0001); in f) vehicle (P<0.0001), compound 1 (P=0.0007); in g) Lolamicin (P<0.0001); in h) vehicle (P<0.0001).
Figure 5.
Figure 5.. Lolamicin spares the gut microbiome and prevents C. difficile colonization.
(a) Taxonomic analysis showing bacterial population shifts at the Family level over a 31-day period before (Day 0) and after (Day 7, Day 10, Day 31) antibiotic administration. (b) Diversity analysis before (Day 0) and after (Day 7) antibiotic administration measured by Shannon Index. N=6 biologically independent animals examined over 2 independent experiments (Day 0 and Day 7). Statistical significance determined using an unpaired Wilcoxon Rank Sum test with Vehicle Day 0 as reference. **P <0.01. Vehicle Day 7 (P=0.24); Lolamicin Day 0 (P=0.06); Lolamicin Day 7 (P=0.24); Amoxicillin Day 0 (P=0.13); Amoxicillin Day 7 (P=0.08); Clindamycin Day 0 (P=0.06); Clindamycin Day 7 (P=0.002). Boxes span from the first to the third quartiles, center lines represent median values and whiskers show data lying within 1.5x the interquartile range of the lower and upper quartiles. Data points outside whiskers represent outliers. (c) Species richness measured by alpha rarefaction before (Day 0) and after (Day 7, Day 10, Day 31) antibiotic administration. (d) Daily CFU counts of C. difficile in fecal samples of mice treated with vehicle, lolamicin, amoxicillin, or clindamycin from the time of challenge (Day 0) with 1.2×10⁴ C. difficile strain 630 spores through five days post-infection. Bold lines represent median CFU counts of treatment groups and light lines indicate data for each individual mouse. Statistical significance was determined between Day 0 and Day 5 by one-way ANOVA with Tukey’s multiple comparisons. CD-1 mice (6 per cohort) were treated with vehicle (20% DMSO, 30% water, 50% PEG400) or compound (clindamycin, 100 mg/kg; amoxicillin, 100 mg/kg; or lolamicin, 200 mg/kg) twice a day for three days via oral gavage. NS=not significant (P>0.05), ****P<0.0001; Lolamicin Day 5 (P=0.6436); Amoxicillin Day 5 (P<0.0001); Clindamycin Day 5 (P<0.0001).

Comment in

References

Main Text References

    1. Maier L et al. Unravelling the collateral damage of antibiotics on gut bacteria. Nature 599, 120–124 (2021). - PMC - PubMed
    1. Lynch SV & Pedersen O The Human Intestinal Microbiome in Health and Disease. New Eng J Med 375, 2369–2379 (2016). - PubMed
    1. Schubert AM, Sinani H & Schloss PD Antibiotic-Induced Alterations of the Murine Gut Microbiota and Subsequent Effects on Colonization Resistance against Clostridium difficile. mBio 6, e00974 (2015). - PMC - PubMed
    1. Owens RC Jr., Donskey CJ, Gaynes RP, Loo VG & Muto CA Antimicrobial-associated risk factors for Clostridium difficile infection. Clin Infect Dis 46, S19–31 (2008). - PubMed
    1. Iizumi T, Battaglia T, Ruiz V & Perez Perez GI Gut Microbiome and Antibiotics. Arch Med Res 48, 727–734 (2017). - PubMed

Additional References:

    1. Pandit KR & Klauda JB Membrane models of E. coli containing cyclic moieties in the aliphatic lipid chain. Biochim Biophys Acta 1818, 1205–1210 (2012). - PubMed
    1. Jorgensen WL, Chandrasekhar J, Madura JD, Impey RW & Klein ML Comparison of simple potential functions for simulating liquid water. J Chem Phys 79, 926–935 (1983).
    1. Jo S, Kim T, Iyer VG & Im W CHARMM-GUI: a web-based graphical user interface for CHARMM. J Comput Chem 29, 1859–1865 (2008). - PubMed
    1. Licari G, Dehghani-Ghahnaviyeh S & Tajkhorshid E Membrane Mixer: A Toolkit for Efficient Shuffling of Lipids in Heterogeneous Biological Membranes. J Chem Inform Model 62, 986–996 (2022). - PMC - PubMed
    1. Humphrey W, Dalke A & Schulten K VMD: visual molecular dynamics. J Mol Graph 14, 33–38, 27–38 (1996). - PubMed

MeSH terms

LinkOut - more resources