. 2024 Jun;630(8016):392-400.
doi: 10.1038/s41586-024-07463-4. Epub 2024 May 29.

The sex of organ geometry

Affiliations

The sex of organ geometry

Laura Blackie et al. Nature. 2024 Jun.

Abstract

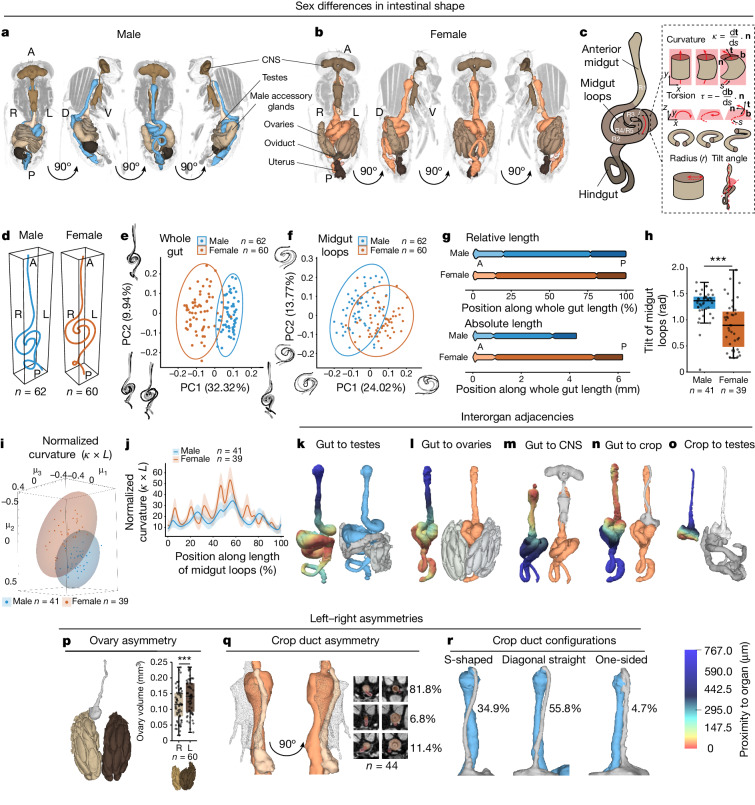
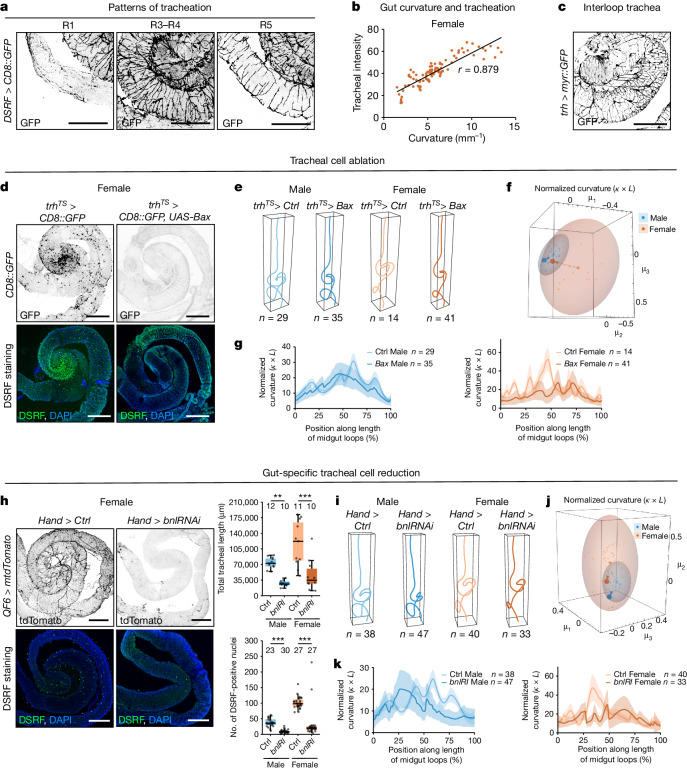
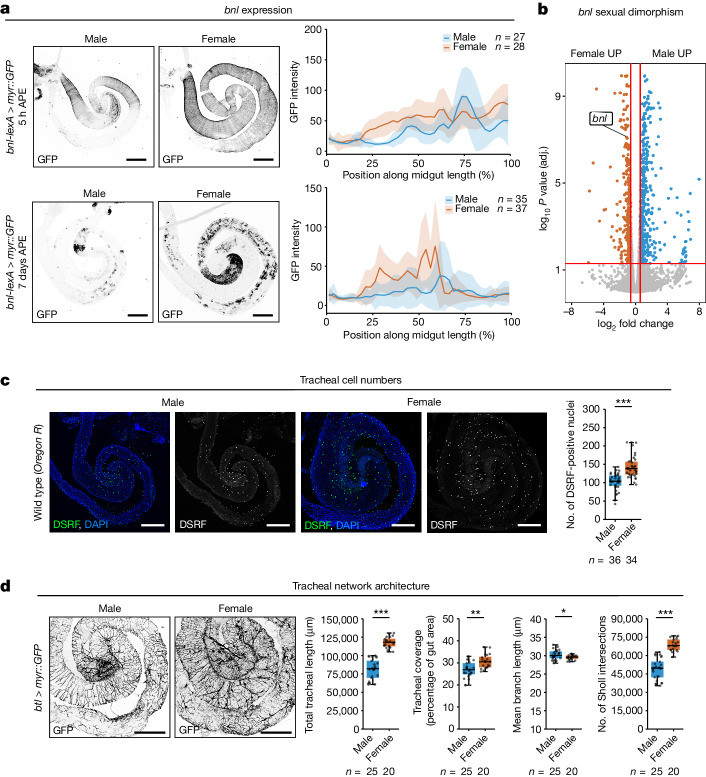
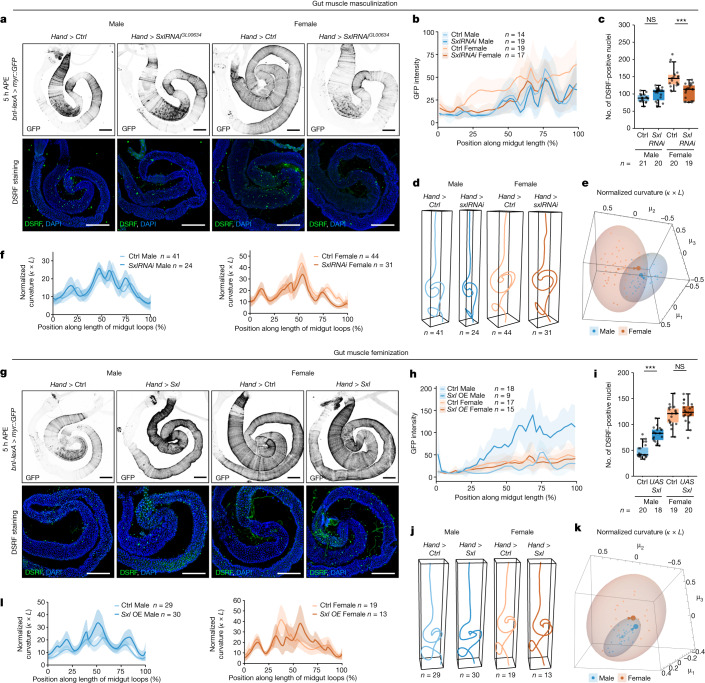
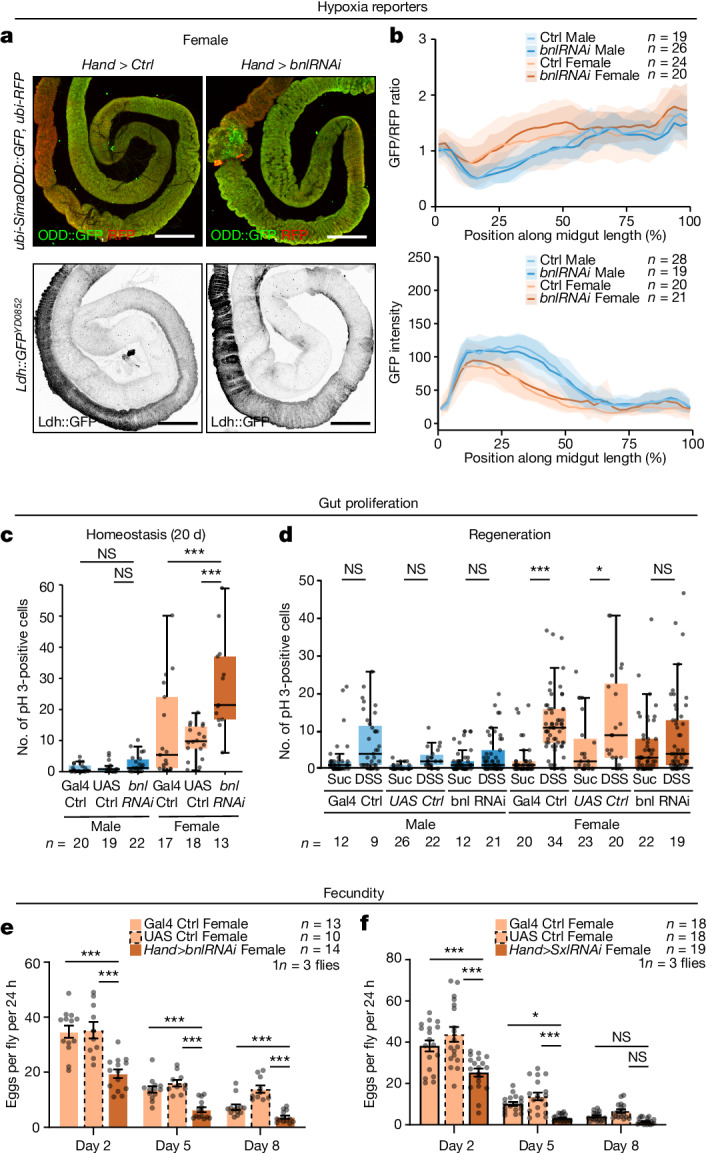
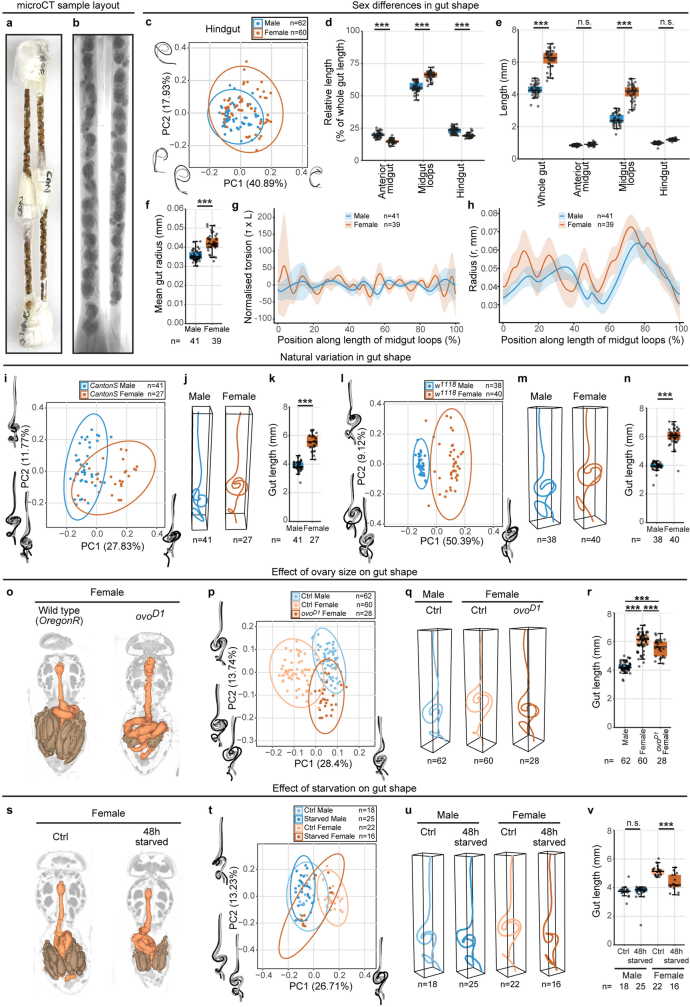
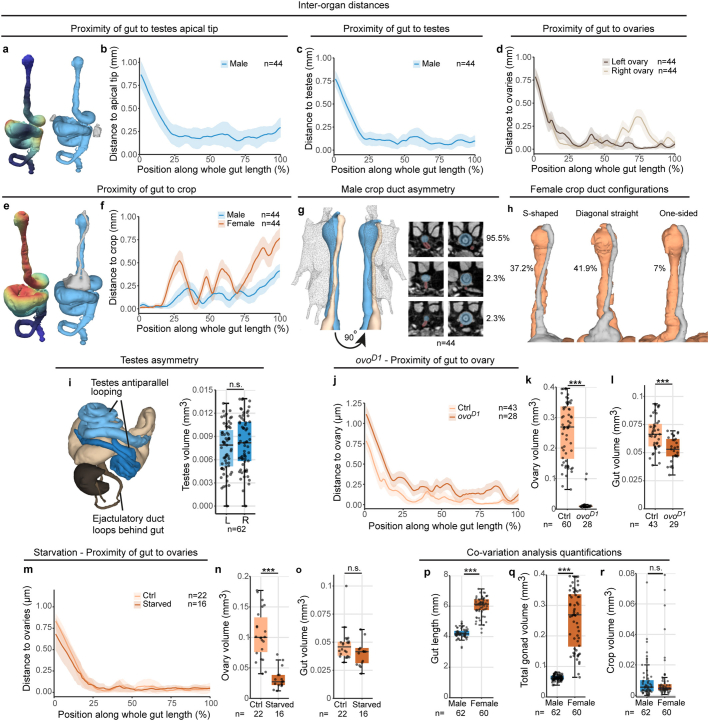
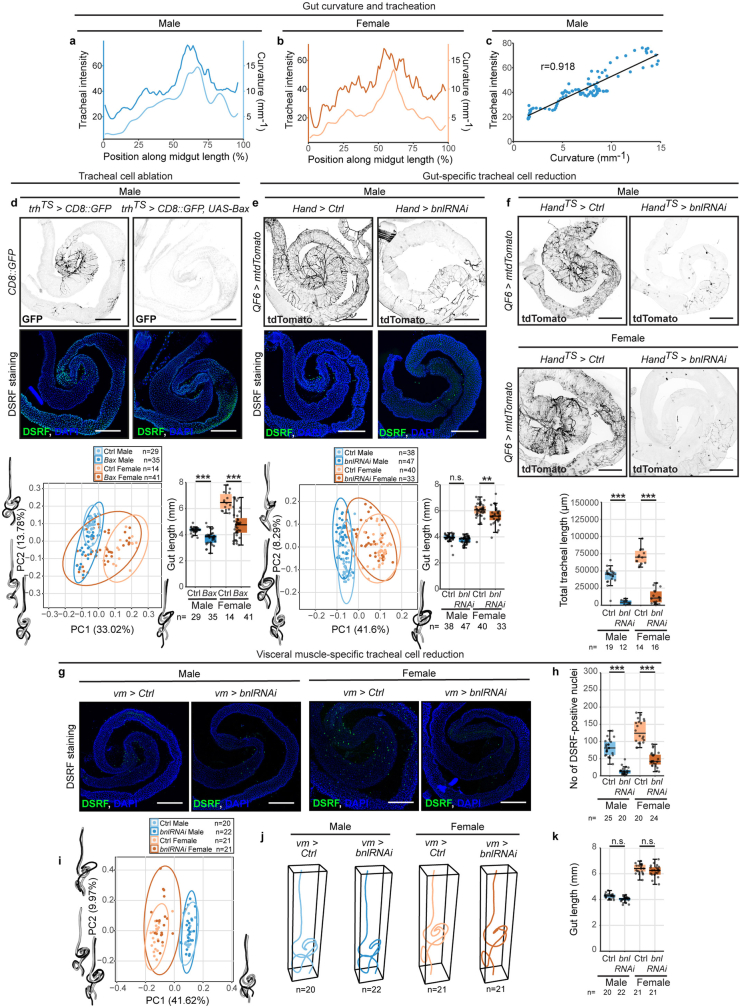
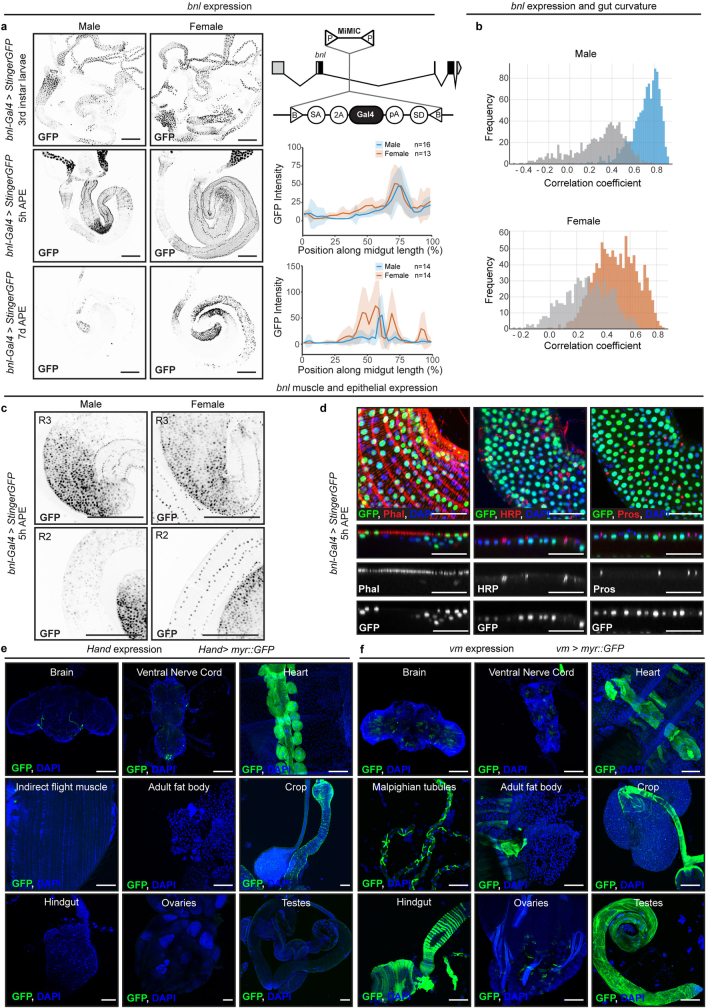
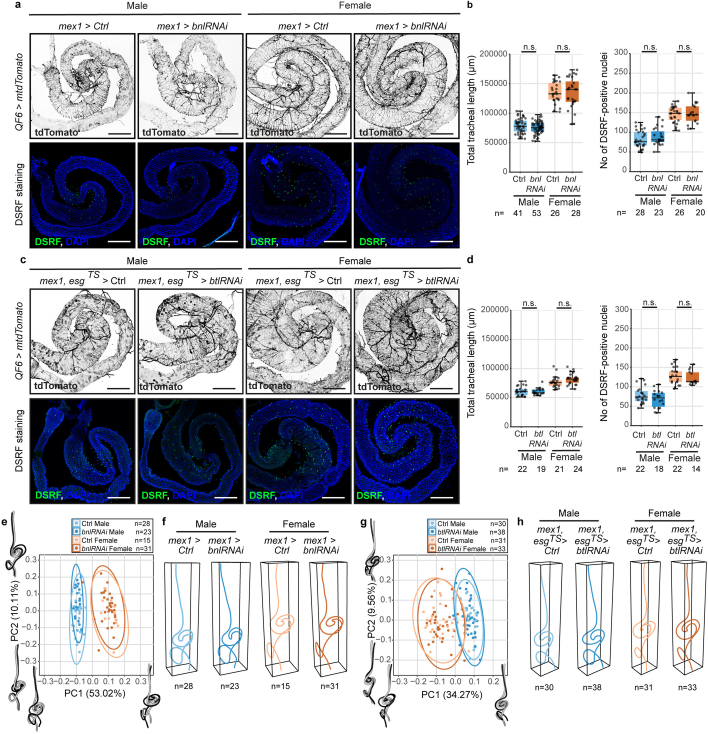
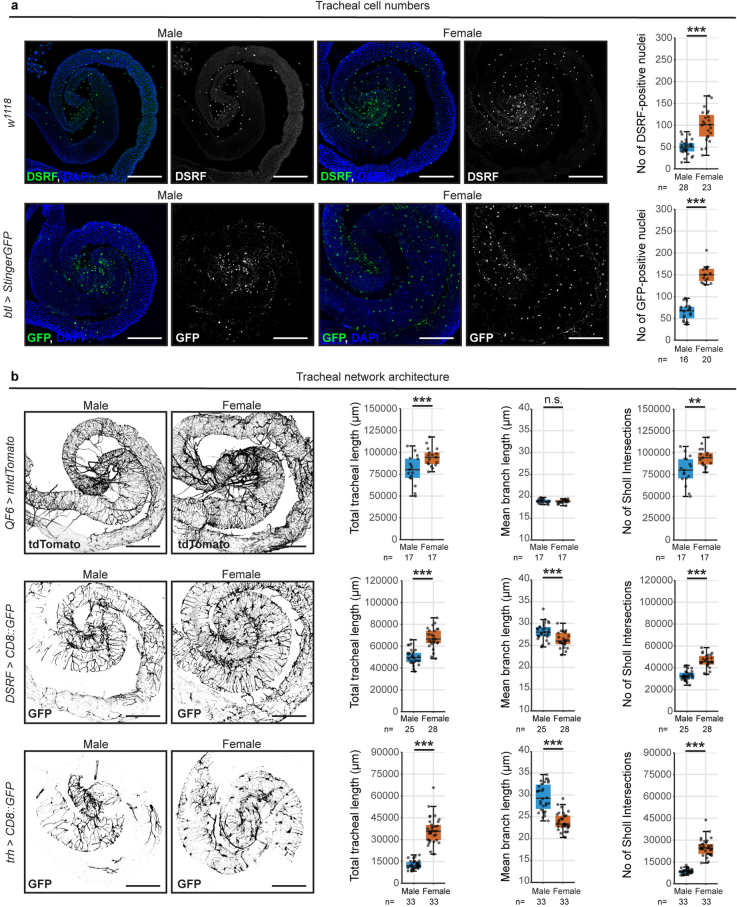
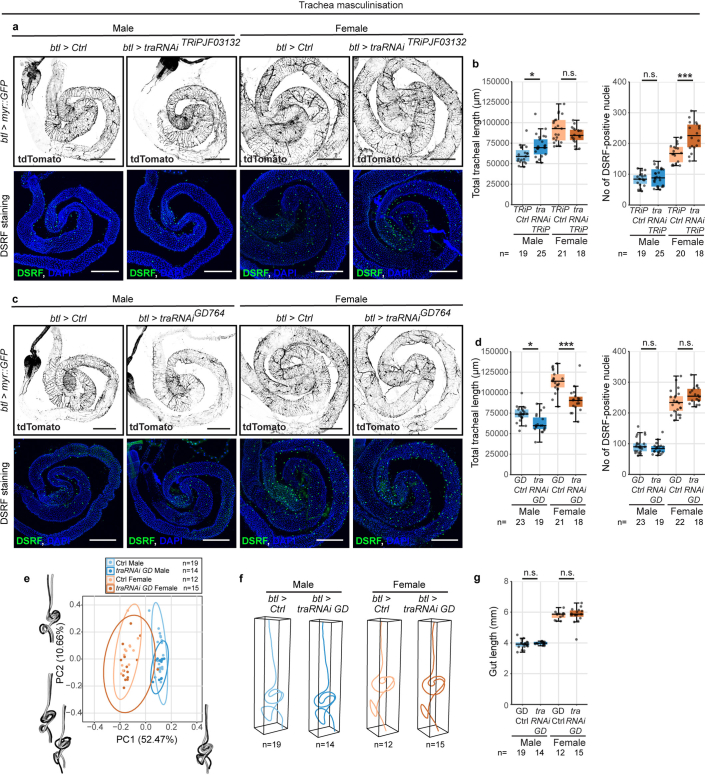
Organs have a distinctive yet often overlooked spatial arrangement in the body1-5. We propose that there is a logic to the shape of an organ and its proximity to its neighbours. Here, by using volumetric scans of many Drosophila melanogaster flies, we develop methods to quantify three-dimensional features of organ shape, position and interindividual variability. We find that both the shapes of organs and their relative arrangement are consistent yet differ between the sexes, and identify unexpected interorgan adjacencies and left-right organ asymmetries. Focusing on the intestine, which traverses the entire body, we investigate how sex differences in three-dimensional organ geometry arise. The configuration of the adult intestine is only partially determined by physical constraints imposed by adjacent organs; its sex-specific shape is actively maintained by mechanochemical crosstalk between gut muscles and vascular-like trachea. Indeed, sex-biased expression of a muscle-derived fibroblast growth factor-like ligand renders trachea sexually dimorphic. In turn, tracheal branches hold gut loops together into a male or female shape, with physiological consequences. Interorgan geometry represents a previously unrecognized level of biological complexity which might enable or confine communication across organs and could help explain sex or species differences in organ function.


Conflict of interest statement

The authors declare no competing interests.

Figures

Fig. 1
Fig. 1. Sex differences in organ shape and interorgan adjacencies.
a,b, Anteroposterior microCT slices overlaid with 3D organ reconstructions for male (a) and female (b) fruit flies. c, Gut regions (R1–R5) and shape descriptors: curvature (κ); torsion (τ); radius (r) of gut tube and tilt angle of midgut loops relative to main gut axis; t, tangent vector; n, normal vector; b, binormal vector; and s, arclength. d, Average gut centrelines. e,f, Gut shape variability PCA plot for whole gut (e) and midgut loops (f) with extremes of variation along each PC depicted (Methods). g, Relative and absolute lengths of anterior midgut, midgut loops and hindgut represented by colour shades. h, Male midgut loops are on average more tilted (horizontal) than females. i, Multidimensional scaling plot showing significant difference between male and female normalized gut curvature. j, Females have higher average normalized gut curvature for most of the midgut loop region. ko, 3D segmentation heatmaps showing gut proximity to testes (k), ovaries (l), CNS (m) and crop (n) and crop proximity to testes (o). pr, 3D segmentations showing crop contacting right ovary (p), crop duct proximity with gut and CNS (q) and crop duct configurations (r). p, Left ovary (dark brown) is on average larger than right ovary (light brown). q, Dorsal–ventral cross-sections through top and centre of proventriculus showing crop duct position asymmetry (red) relative to gut (orange) (right). Line graph: mean and standard deviation. Boxplot: line, median; box, first and third quartiles; whiskers, minimum and maximum. e,f,i, Ellipses represent 95% confidence spaces. n denotes number of biologically independent samples. Statistical significance was assessed using two-sided two-sample t-test (h) and two-sided paired t-test (p). ***P < 0.001. See Supplementary Information for organ contact frequencies, exact P values, statistical tests and sample sizes. Blue, males; orange, females. CNS, central nervous system comprising brain and ventral nerve cord; R, right; L, left; A, anterior; P, posterior; D, dorsal; V, ventral. Source Data
Fig. 2
Fig. 2. Tracheal branches hold gut loops together.
a, Tracheal branches visualized in different gut regions: sparse and parallel to length of R1; dense and perpendicular to length of R3–R4; sparse and perpendicular to length of R5. b, Correlation between average intensity of tracheal signal from btl>myr::GFP females and average gut curvature of wild-type OregonR females at the same relative midgut positions. c, Tracheal branches span across gut loops. d, The trhTS>Bax expression reduces tracheal terminal branches (top) and numbers of DSRF-positive nuclei (bottom) in female midguts. e, Average trhTS>Bax gut centrelines show differences in gut shape relative to controls. f, Multidimensional scaling plot showing change in gut curvature normalized by gut length in trhTS>Bax compared to controls. g, The trhTS>Bax guts show reduced average curvature normalized by gut length relative to controls. h, Hand>bnlRNAi expression reduces tracheal branches (left top, quantified in right top) and number of DSRF-positive nuclei (left bottom, quantified in right bottom) in female midguts. n values are shown. i, Average Hand>bnlRNAi gut centrelines showing differences in gut shape relative to controls. j, Multidimensional scaling plot showing change in gut curvature normalized by gut length between controls versus Hand>bnlRNAi. k, Hand>bnlRNAi guts show reduced average curvature normalized by gut length relative to controls. Line graph: mean and standard deviation. Boxplots: line, median; box, first quartile and third quartile; whiskers, minimum and maximum. Multidimensional scaling plot: ellipsoids represent 95% confidence space for each group, arrows represent shift in mean from control to experimental manipulation. n denotes number of biologically independent samples. Statistical significance was assessed using one-way ANOVA followed by Tukey post hoc tests (h). **P < 0.01; *** P < 0.001. Supplementary Information gives exact P values, statistical tests and sample sizes. Males, blue; females, orange; controls, lighter matching colours. Ctrl, control group (see genotypes in Supplementary Information). Scale bars, 200 μm. Source Data
Fig. 3
Fig. 3. Sex differences in tracheal branching and gut muscle-derived bnl expression.
a, The bnl expression in guts at 5 h (top) and 7 days (bottom) after pupal eclosion (APE), visualized by bnl-LexA>myr::GFP expression (left) and quantified along midgut length (right). b, RNA-seq profiling of male and female dissected midguts, visualized as the log2-transformed fold change in expression between groups plotted against adjusted (adj.) P value (using raw transcriptomics data from ref. ). Genes significantly upregulated (P < 0.05) in males and females are coloured in blue and orange, respectively. The bnl expression is significantly upregulated in females. c, Labelling of tracheal terminal cells by DSRF staining in OregonR flies shows difference in tracheal terminal cell number between male and female guts (quantified in right). d, Trachea labelled with btl>myr::GFP, showing differences between males and females. Quantifications show higher total tracheal length, tracheal coverage by gut area and tracheal branching (number of Sholl intersections) in females compared to males. Males have longer mean tracheal branch lengths than females. Line graphs: mean and standard deviation. Boxplots: line, median; box, first quartile and third quartile; whiskers, minimum and maximum. n denotes number of biologically independent samples. Statistical significance was assessed using two-sided two-sample t-tests (c,d). *P < 0.05; **P < 0.01; ***P < 0.001. See Supplementary Information for exact P values, statistical tests and sample sizes. Males, blue; females, orange. Scale bars, 200 μm. Source Data
Fig. 4
Fig. 4. Sex reversals of intestinal muscles impact tracheal branching and gut shape.
ac, Hand>SxlRNAiGL0034 masculinizes bnl expression at 5 h APE, seen by bnl-lexA>myr::GFP (top of a, quantified in b) and reduces the number of DSRF-positive tracheal terminal cells in females (bottom of a, quantified in c). d, Average centrelines of Hand>SxlRNAi guts, showing altered shape in central midgut region of females relative to controls. e, Multidimensional scaling plot showing change in gut curvature normalized by gut length for Hand>SxlRNAi females compared to controls and no change in males. f, Female Hand>SxlRNAi show reduced average gut curvature normalized by gut length relative to controls. gi, Hand>Sxl feminizes bnl expression at 5 h APE, seen by bnl-lexA>myr::GFP (top of g, quantified in h) and increases the number of DSRF-positive tracheal terminal cells in males (bottom of g, quantified in i). j, Average centrelines of Hand>Sxl guts showing altered shape in central midgut region of males relative to controls. k, Multidimensional scaling plot showing change in gut curvature normalized by gut length for Hand>Sxl males to controls and no change in females. l, Male Hand>Sxl show increased average gut curvature normalized by gut length. Line graphs: mean and standard deviation. Boxplots: line, median; box, first quartile and third quartile; whiskers, minimum and maximum. Multidimensional scaling plots: ellipsoids represent 95% confidence space for each group, arrows represent shift in the mean from control to experimental manipulation. n = number of biologically independent samples. Statistical significance in c and i was assessed using one-way ANOVA followed by Tukey post hoc tests. NS, not significant (P > 0.05). ***P < 0.001. See Supplementary Information for exact P values, statistical tests and sample sizes. Males, blue; females, orange; controls, lighter matching colours (see genotypes in Supplementary Information). Scale bars, 200 μm. Source Data
Fig. 5
Fig. 5. Physiological importance of gut trachea.
a,b, Expression of bnlRNAi from gut muscle (Hand>bnlRNAi) does not change amounts of SimaODD::GFP (top of a, quantified in top of b) nor Ldh::GFP (bottom of a, quantified in bottom of b). c, Expression of bnlRNAi from gut muscles (Hand>bnlRNAi) increases number of mitoses in 20-day-old flies, seen by number of pH 3-positive cells. d, Hand>bnlRNAi expression in DSS-treated guts reduces mitotic indices in midgut of 7-day-old females relative to DSS-treated controls, seen by number of pH 3-positive cells. e,f, Expression of Hand>bnlRNAi (e) or Hand>SxlRNAi (f) reduces fecundity in females relative to controls, as measured by the number of laid eggs per fly on days 2, 5 and 8 after mating. GFP intensity and GFP/RFP ratio graphs show mean and standard deviation. Boxplots: line, median; box, first quartile and third quartile; whiskers, minimum and maximum. n denotes number of biologically independent samples. Statistical significance was assessed using one-way ANOVA followed by Tukey post hoc tests (cf). *P < 0.05; **P < 0.01; ***P < 0.001. See Supplementary Information for exact P values, statistical tests and sample sizes. Males, blue; females, orange; controls, lighter matching colours (see genotypes in Supplementary Information). Scale bars, 200 μm. Source Data
Extended Data Fig. 1
Extended Data Fig. 1. Sex differences, variation and plasticity of gut shape.
a,b, Sample layout for microCT, showing parallel stacking of sample tubes (a) and a radiograph exemplifying a batch scan of multiple Drosophila specimens (b). c, PCA plot of shape variability in hindgut centrelines for wild-type OregonR. Male and female hindguts are significantly different in shape (Supplementary Table 5-6). d-f, Relative length (% of whole gut length) (d) and absolute length (e) of different gut regions and average gut radius (f) for OregonR. g-h, Gut torsion normalized by length (g) and radius (h) along midgut loop region for OregonR. i, PCA plot of wild-type CantonS whole gut shape variability showing male and female guts are significantly different in shape. j,k, Average CantonS gut centrelines (j) and gut length (k) showing differences between males and females. l, PCA plot of w1118 gut shape variability showing male and female guts are significantly different in shape. m,n, Average w1118 gut centrelines (m) and gut length (n) showing differences between males and females. o, Anteroposterior slices of female microCT scans overlaid with 3D reconstructions of the gut (orange) and ovaries (brown), showing differences in gut position between ovoD1 mutant females and controls. p, PCA plot of ovoD1 gut shape variability showing significant difference in shape to controls. q,r, Average ovoD1 mutant female gut centreline (q) and gut length (r) showing differences relative to controls. s, Anteroposterior slices of female microCT scans overlaid with 3D reconstructions of the gut (orange) and ovaries (brown), showing gut and ovary positions in flies starved for 48 h and controls. t, PCA plot of 48 hour-starved gut shape variability showing significant difference in shape to controls. u,v, Average gut centrelines (u) and gut length (v) of flies starved for 48 h, showing differences relative to controls. Line graphs: mean and standard deviation. Boxplots: line = median, box = first quartile and third quartile, whiskers = minimum and maximum. PCA plots: ellipses represent the 95% confidence space for each group. Diagrams represent the extremes of variation along each PC (see methods). n = number of biologically independent samples. Statistical significance was assessed using one-way ANOVA followed by Tukey post-hoc tests (d,e,r,v) or a two-sided two-sample t-test (f,k,n): non-significant (n.s.)= P > 0.05; ***= P < 0.001. See Supplementary Information for exact P-values, statistical tests and sample sizes. Males are in blue, females in orange and controls in lighter matching colours. Ctrl = control group (see genotypes in Supplementary Information). Source Data
Extended Data Fig. 2
Extended Data Fig. 2. Multi-organ analyses.
a-f, Gut proximity to testes apical tip (a-b), testes (c), ovaries (d) and crop (e-f) in wild-type OregonR flies, shown by heatmap on representative 3D segmentation of the gut (a,e, Key in Fig. 1) and by plotted distance along the whole gut length (b,c,d,f). g, 3D volume segmentation showing crop duct proximity with gut and CNS in males (left). Dorsal-ventral cross-sectional views through upper thorax at top and centre of the proventriculus showing asymmetry of crop duct position (red) relative to gut (orange, right). h, 3D volume segmentation showing crop duct configurations and anterior midgut of OregonR females. i, 3D segmentation of male genital tract including testes (blue), accessory glands, ejaculatory duct and ejaculatory bulb (shades of brown). Volume of left and right testes is not significantly different. j, Gut proximity to ovaries in ovoD1 mutant and control females, shown by plotted distances to positions along the whole gut length. k-l, Ovary (k) and gut (l) volumes in ovoD1 mutant females and controls. m, Gut proximity to ovaries in 48 hour-starved and control females, shown by plotted distances to positions along the whole gut length. n-o, Ovary (n) and gut (o) volumes in 48 hour-starved females and controls. p-r, Gut length (p), total gonad volume (q) and crop volume (r) for OregonR males and females. (These data were used in Procrustes ANOVA to assess constraint on gut shape, see Supplementary Tables 17–19). Line graphs: mean and standard deviation. Boxplots: line = median, box = first quartile and third quartile, whiskers = minimum and maximum. n = number of biologically independent samples. Statistical significance was assessed using two-sided paired t-test (i) or a two-sided two-sample t-test (k,l,n-r): non-significant (n.s.) = P > 0.05; *** = P < 0.001. See Supplementary Information for exact organ contact frequencies, P-values, statistical tests and sample sizes. Males are in blue, females in orange and controls in lighter matching colours. Ctrl = control group (see genotypes in Supplementary Information). Source Data
Extended Data Fig. 3
Extended Data Fig. 3. Genetic targeting of intestinal trachea.
a-c, Similar pattern of gut tracheation and gut curvature, shown by average intensity of tracheal signal from btl>myr::GFP and average gut curvature of OregonR (lighter matching colours) along the midgut for males (a) and females (b) and correlated at same relative midgut positions for males (c). d, trhTS>Bax reduces tracheal terminal branches (top) and number of DSRF-positive nuclei (middle) in male midguts. PCA plot of trhTS>Bax gut shape variability (bottom left). Groups are significantly different in shape (Supplementary Tables 20,21). trhTS>Bax have differences in gut length relative to controls (bottom right). e, Hand>bnlRNAi reduces trachea in male midguts, shown by decrease in trachea branches (top), or in number of DSRF-positive nuclei (middle). PCA plot of Hand>bnlRNAi gut shape variability (bottom left). Groups are significantly different in shape (Supplementary Tables 24-25). Hand>bnlRNAi show marginal differences in female gut length relative to controls (bottom right). f, HandTS>bnlRNAi reduces trachea in the midgut, shown by decreased trachea branches (top) and quantified by the total tracheal branch length (bottom). g-h, vm>bnlRNAi decreases number of DSRF-positive nuclei (g, quantified in h). i, PCA plot of vm>bnlRNAi gut shape variability. Groups are significantly different in shape (Supplementary Tables 26-27). j,k Average vm>bnlRNAi gut centrelines (j) and gut length (k) showing altered shape but no differences in gut length relative to controls. Line graphs show mean. Boxplots: line = median, box = first quartile and third quartile, whiskers = minimum and maximum. PCA plots: ellipses represent the 95% confidence space for each group. Diagrams represent the extremes of variation along each PC (see methods). n = number of biologically independent samples. Statistical significance was assessed using one-way ANOVA followed by Tukey post-hoc tests (d-f,h,k): non-significant (n.s.) = P > 0.05; ** = 0.01 > P > 0.001; *** = P < 0.001. See Supplementary Information for exact P-values, statistical tests and sample sizes. Males are in blue, females in orange and controls in lighter matching colours. Ctrl = control group (see genotypes in Supplementary Information). Scale bars: 200 μm. Source Data
Extended Data Fig. 4
Extended Data Fig. 4. Expression of bnl and gut muscle drivers.
a, bnl expression (bnl-Gal4>StingerGFP) in the gut epithelium and muscles at different stages of development: in larval enterocytes (top left), in adult gut muscle at 5 h after pupal eclosion (APE) (middle left) and in adult enterocytes at 7 days APE (bottom left). Schematic shows bnl locus and the position of T2A-Gal4 insertion (top right). GFP intensity quantified at 5 h APE (middle right) and 7 days APE (bottom right). b, Histogram of Pearson correlation coefficients between gut curvature and bnl intensity along midgut. Grey bars represent correlations with a “control” bnl intensity generated by fitting an autoregressive process to the true data (see Methods). c, bnl expression (bnl-Gal4>StingerGFP) at 5 h APE in gut R3 region showing enterocyte expression (top) and R2 region showing muscle expression (bottom). d, bnl expression (bnl-Gal4 > StingerGFP) overlaps F-actin-rich muscle layer, shown by Phalloidin staining (Phal), but not intestinal stem cells or enteroblasts, shown by horseradish peroxidase staining (HRP), nor enteroendocrine cells, shown by Prospero staining (Pros). e, Hand expression (Hand-Gal4>myr::GFP) in: adult brain, ventral nerve cord, heart, indirect flight muscle, fat body, crop, hindgut, ovaries and testes. f, vm expression (vm-Gal4>myr::GFP) in: adult brain, ventral nerve cord, heart, Malpighian tubules, fat body, crop, hindgut, ovaries and testes. Line graphs: mean and standard deviation. n = number of biologically independent samples. See Supplementary Information for exact P-values, statistical tests and sample sizes. Males are in blue and females in orange. Scale bars: (a,c) 200 μm, (d) 50 μm, (e,f) 100 μm. Source Data
Extended Data Fig. 5
Extended Data Fig. 5. Lack of epithelial contribution to gut shape phenotypes.
a,b, bnl downregulation from gut enterocytes (mex1>bnlRNAi) does not reduce tracheal branches (QF6>mtdTomato) (top (a), quantified in left (b)), or number of DSRF-positive nuclei (bottom (a), quantified in right (b)). c-d, btl downregulation from gut epithelium for 3 days prior to pupal eclosion (mex1,esgTS>btlRNAi) does not reduce tracheal branches (QF6>mtdTomato) (top (c), quantified in left (d)), or number of DSRF-positive nuclei (bottom (c), quantified in right (d)). e, PCA plot of mex1>bnlRNAi gut shape variability showing no significant difference in shape to controls. f, Average mex1>bnlRNAi gut centrelines show no differences in shape relative to controls. g, PCA plot of mex1,esgTS>btlRNAi gut shape variability showing no significant difference in shape to controls. h, Average mex1,esgTS>btlRNAi gut centrelines show no significant differences in shape relative to controls. Boxplots: line = median, box = first quartile and third quartile, whiskers = minimum and maximum. PCA plots: ellipses represent 95% confidence space for each group. Diagrams represent the extremes of variation along each PC (see methods). n = number of biologically independent samples. Statistical significance was assessed using one-way ANOVA followed by Tukey post-hoc tests (b,d): non-significant (n.s.) = P > 0.05. See Supplementary Information for exact P-values, statistical tests and sample sizes. Males are in blue, females in orange and controls in lighter matching colours. Ctrl = control group (see genotypes in Supplementary Information). Scale bars: 200 μm. Source Data
Extended Data Fig. 6
Extended Data Fig. 6. Sex differences in the intestinal tracheal network.
a, Trachea labelled by DSRF staining in w1118 (top) and btl>StingerGFP (bottom) show difference in tracheal terminal cell number between male and female guts (quantifications in right). b, Trachea labelled by QF6>mtdTomato (top), DSRF > CD8::GFP (middle) or trh > CD8::GFP (bottom), showing higher total tracheal length and tracheal branching (no. sholl intersections) in females compared to males and shorter mean tracheal branch lengths in females compared to males (except in QF6>mtdTomato) (quantifications shown in right). Boxplots: line = median, box = first quartile and third quartile, whiskers = minimum and maximum. n = number of biologically independent samples. Statistical significance was assessed using two-sided two-sample t-tests (a,b): non-significant (n.s.) = p > 0.05; ** = 0.01>p > 0.001; *** = p < 0.001. See Supplementary Information for exact p-values, statistical tests and sample sizes. Males are in blue, females in orange. Scale bars: 200 μm. Source Data
Extended Data Fig. 7
Extended Data Fig. 7. tra-mediated tracheal masculinizations.
a–d, Expression of two traRNAi lines in tracheal cells, by means of btl > TRiPJF03132 (a,b) and btl > GD764 (c,d), does not effectively masculinize midgut trachea, as seen by trachea labelled by btl>myr::GFP (top (a,c), quantified in left (b,d)), or by DSRF-positive tracheal terminal cell nuclei (bottom (a,c), quantified in right (b,d)). e, PCA plot of btl>traRNAi.GD764 gut shape variability showing no significant difference in shape to controls. f,g, Average btl>traRNAi.GD764 gut centrelines (f) and gut length (g) show no differences relative to controls. We note that we did not use a UAS-Dcr-2 transgene to enhance tra downregulation as its expression in trachea results in deleterious phenotypes in the absence of other transgenes. Boxplots: line = median, box = first quartile and third quartile, whiskers = minimum and maximum. PCA plots: ellipses represent the 95% confidence space for each group. Diagrams represent the extremes of variation along each PC (see methods). n = number of biologically independent samples. Statistical significance was assessed using one-way ANOVA followed by Tukey post-hoc tests (b,d,g): non-significant (n.s.) = p > 0.05; * = 0.05>p > 0.01; *** = p < 0.001. See Supplementary Information for exact p-values, statistical tests and sample sizes. Males are in blue, females in orange and controls in lighter matching colours. Ctrl = control group (see genotypes in Supplementary Information). Scale bars: 200 μm. Source Data
Extended Data Fig. 8
Extended Data Fig. 8. Genetic sex reversals of intestinal muscles.
a-c, Hand>traRNAi.JF03123 masculinizes bnl expression at 5 h after pupal eclosion (APE), seen by bnl-lexA>myr::GFP (top (a), quantified in (b)) and reduces tracheal branches (QF6>mtdTomato) (middle (a), quantified in left (c)) and the number of DSRF-positive nuclei (bottom (a), quantified in right (c)). d, PCA plot of Hand>traRNAi gut shape variability. Females are significantly different in shape to controls (Supplementary Tables 32-33). e, Average Hand>traRNAi gut centrelines show altered shape in the central midgut region in females relative to controls. f, Multidimensional scaling plot representing similarity in gut curvature normalized by gut length between Hand>traRNAi and controls. Arrows represent shift in the mean from control to Hand>traRNAi. g, Hand>traRNAi females have reduced average gut curvature normalized by gut length along midgut loop region relative to controls. h, PCA plot of Hand>SxlRNAi gut shape variability. Groups are significantly different in shape (Supplementary Tables 34-35). i, Hand>SxlRNAi guts show differences in length in females relative to controls. j, PCA plot of Hand>Sxl gut shape variability. Males are significantly different in shape to controls (Supplementary Tables 36-37). k, Hand>Sxl guts show no differences in length relative to controls. Line graphs: mean and standard deviation. Boxplots: line = median, box = first quartile and third quartile, whiskers = minimum and maximum. d,f,h,j, Ellipses represent 95% confidence space for each group. Diagrams represent the extremes of variation along each PC (see methods). n = number of biologically independent samples. Statistical significance was assessed using one-way ANOVA followed by Tukey post-hoc tests (c,i,k): non-significant (n.s.) = p > 0.05; * = 0.05>p > 0.01; *** = p < 0.001. See Supplementary Information for exact p-values, statistical tests and sample sizes. Males are in blue, females in orange and controls in lighter matching colours. Ctrl = control group (see genotypes in Supplementary Information). Scale bars: 200 μm. Source Data
Extended Data Fig. 9
Extended Data Fig. 9. Hypoxia reporters in the presence and absence of trachea.
a, Expression of SimaODD::GFP across several tissues (brain, midgut and gonads), showing higher GFP levels in the adult midgut of both males and females. b, Expression of bnlRNAi from gut muscle (Hand>bnlRNAi) in males does not change levels of SimaODD::GFP (top) nor Ldh::GFP (bottom) compared to controls. Ctrl = control group (see genotypes in Supplementary Information). Scale bars: 200 μm.
Extended Data Fig. 10
Extended Data Fig. 10. Functional interrogation of flies with reduced gut tracheation.
a, Expression of bnlRNAi from gut muscles (Hand>bnlRNAi) does not change mitotic indices in midgut of 7-day-old flies seen by number of pH3-positive cells. b, Hand>bnlRNAi expression marginally reduces total number of sips during 1 h of feeding, as recorded in a FlyPad device (see Methods). c-d, Hand>bnlRNAi expression does not alter FCF blue-dyed food contents in gut of adult flies fed ad libitum (c) or starved for 16 h and re-fed for 15 min (d), as measured by blue dye absorbance at 634 nm from cleared homogenates of groups of 3 flies. e, Hand>bnlRNAi expression does not alter food transit time in gut, measured by percentage of flies with dyed food present in portions of the gut (midgut, hindgut and ampulla). Only size-matched guts are shown to rule out effects of gut size (see Methods). f, Hand>bnlRNAi expression does not alter the total number of faecal deposits, quantified by bromophenol blue-dyed deposits after 60 h of feeding (see Methods). g-h, Hand>bnlRNAi expression reduces survival in male (g) and female (h) flies starved in 1% agar relative to respective controls, shown by Kaplan-Meier survival curves. Boxplots: line = median, box = first quartile and third quartile, whiskers = minimum and maximum. n = number of biologically independent samples. Statistical significance was assessed using one-way ANOVA followed by Tukey post-hoc tests (a–d,f), logistic regression with Chi2 post-hoc tests (e) and log-rank test (g,h): non-significant (n.s.) = p > 0.05; * = 0.05>p > 0.01; ** = 0.01>p > 0.001; *** = p < 0.001. See Supplementary Information for exact p-values, statistical tests and sample sizes. Males are in blue, females in orange and controls in lighter matching colours. Ctrl = control group (see genotypes in Supplementary Information). Source Data

Similar articles

Cited by

References

    1. Aristotle. The History of Animals (Zinc Read, 2023).
    1. Falcon, A. & Lefebvre, D. Aristotle’s Generation of Animals (Cambridge Univ. Press, 2018).
    1. Hippocrates of Kos & Adams, F. On the Sacred Disease (Dalcassian, 2023).
    1. Leroi, A. M. The Lagoon: How Aristotle Invented Science (Bloomsbury, 2015).
    1. Vesalius, A. The Fabric of the Human Body: An Annotated Translation of the 1543 and 1555 Editions of “De Humani Corporis Fabrica Libri Septem”, by D.H. Garrison and M.H. Hast (Karger, 2013).

LinkOut - more resources