

Reduced precipitation can induce ecosystem regime shifts in lakes by increasing internal nutrient recycling
- PMID: 38811751
- PMCID: PMC11137141
- DOI: 10.1038/s41598-024-62810-9
Reduced precipitation can induce ecosystem regime shifts in lakes by increasing internal nutrient recycling
Abstract
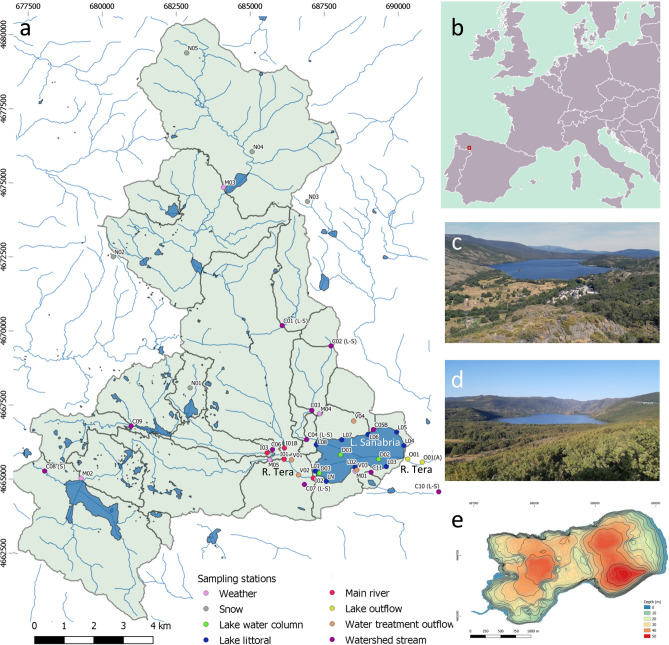
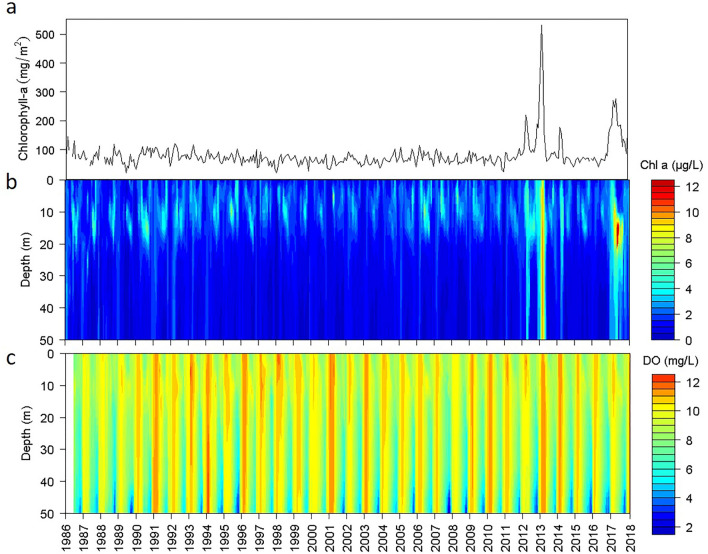
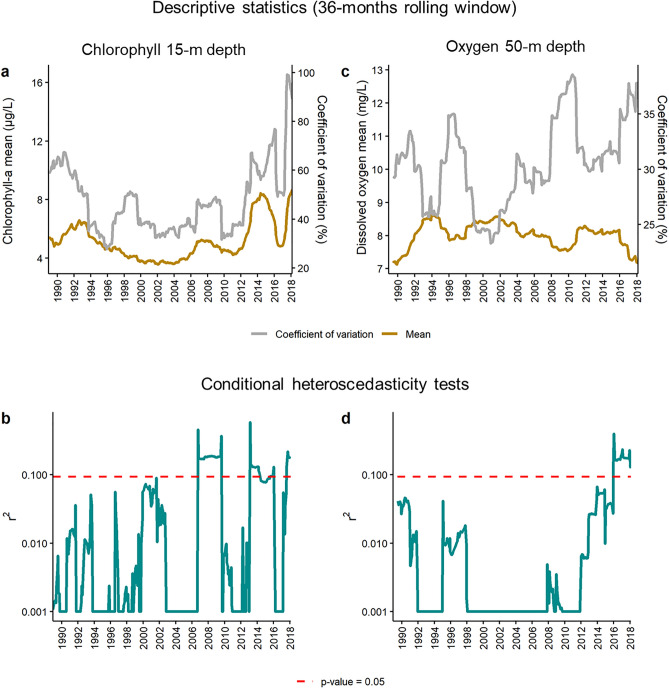
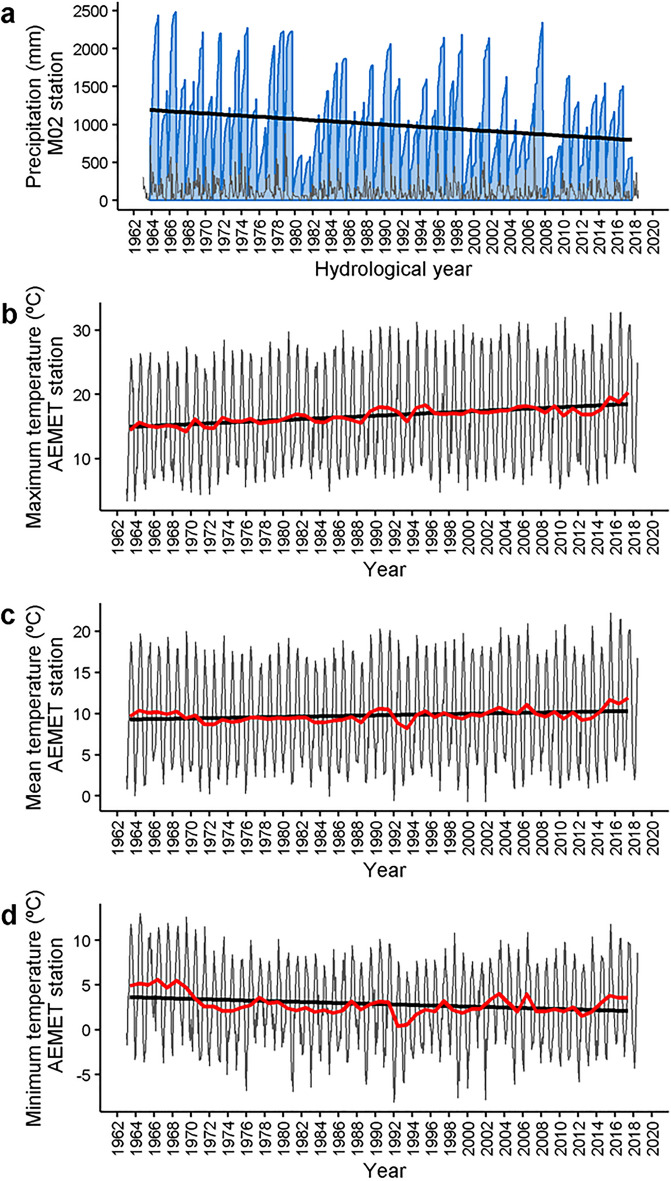
Eutrophication is a main threat to continental aquatic ecosystems. Prevention and amelioration actions have been taken under the assumption of a stable climate, which needs reconsideration. Here, we show that reduced precipitation can bring a lake ecosystem to a more productive regime even with a decline in nutrient external load. By analyzing time series of several decades in the largest lake of the Iberian Peninsula, we found autocorrelated changes in the variance of state variables (i.e., chlorophyll and oxygen) indicative of a transient situation towards a new ecosystem regime. Indeed, exceptional planktonic diatom blooms have occurred during the last few years, and the sediment record shows a shift in phytoplankton composition and an increase in nutrient retention. Reduced precipitation almost doubled the water residence time in the lake, enhancing the relevance of internal processes. This study demonstrates that ecological quality targets for aquatic ecosystems must be tailored to the changing climatic conditions for appropriate stewardship.
Keywords: Climate change; Conditional heteroscedasticity; Diatom blooms; Ecosystem regime shift; Global warming; Internal nutrient loading; Lake Sanabria; Long-term monitoring; Nutrient retention; Precipitation decline; Shifting reference states.
© 2024. The Author(s).
Conflict of interest statement
The authors declare no competing interests.
Figures


References
-
- Smith VH. Eutrophication of freshwater and coastal marine ecosystems a global problem. Environ. Sci. Pollut. R. 2003;10:126–139. - PubMed
-
- Naderian D, et al. A water quality database for global lakes. Resour. Conserv. Recycl. 2024;202:107401.
-
- Lewis WM, Jr, Wurtsbaugh WA, Paerl HW. Rationale for control of anthropogenic nitrogen and phosphorus to reduce eutrophication of inland waters. Environ. Sci. Technol. 2011;45:10300–10305. - PubMed
-
- Birk S, et al. Three hundred ways to assess Europe's surface waters: An almost complete overview of biological methods to implement the Water Framework Directive. Ecol. Indic. 2012;18:31–41.
-
- Kopf RK, Finlayson CM, Humphries P, Sims NC, Hladyz S. Anthropocene baselines: Assessing change and managing biodiversity in human-dominated aquatic ecosystems. Bioscience. 2015;65:798–811.
MeSH terms
Substances
Grants and funding
- 452-A-640.01.01/2014/Confederación Hidrográfica del Duero (Ministry for the Ecological Transition and the Demographic Challenge, Spain)
- 452-A-640.01.01/2014/Confederación Hidrográfica del Duero (Ministry for the Ecological Transition and the Demographic Challenge, Spain)
- 452-A-640.01.01/2014/Confederación Hidrográfica del Duero (Ministry for the Ecological Transition and the Demographic Challenge, Spain)
- 452-A-640.01.01/2014/Confederación Hidrográfica del Duero (Ministry for the Ecological Transition and the Demographic Challenge, Spain)
- 452-A-640.01.01/2014/Confederación Hidrográfica del Duero (Ministry for the Ecological Transition and the Demographic Challenge, Spain)
- 452-A-640.01.01/2014/Confederación Hidrográfica del Duero (Ministry for the Ecological Transition and the Demographic Challenge, Spain)
- 452-A-640.01.01/2014/Confederación Hidrográfica del Duero (Ministry for the Ecological Transition and the Demographic Challenge, Spain)
- 452-A-640.01.01/2014/Confederación Hidrográfica del Duero (Ministry for the Ecological Transition and the Demographic Challenge, Spain)
- 452-A-640.01.01/2014/Confederación Hidrográfica del Duero (Ministry for the Ecological Transition and the Demographic Challenge, Spain)
- 452-A-640.01.01/2014/Confederación Hidrográfica del Duero (Ministry for the Ecological Transition and the Demographic Challenge, Spain)
- 452-A-640.01.01/2014/Confederación Hidrográfica del Duero (Ministry for the Ecological Transition and the Demographic Challenge, Spain)
- 452-A-640.01.01/2014/Confederación Hidrográfica del Duero (Ministry for the Ecological Transition and the Demographic Challenge, Spain)
- 452-A-640.01.01/2014/Confederación Hidrográfica del Duero (Ministry for the Ecological Transition and the Demographic Challenge, Spain)
- 452-A-640.01.01/2014/Confederación Hidrográfica del Duero (Ministry for the Ecological Transition and the Demographic Challenge, Spain)
- 452-A-640.01.01/2014/Confederación Hidrográfica del Duero (Ministry for the Ecological Transition and the Demographic Challenge, Spain)
- 452-A-640.01.01/2014/Confederación Hidrográfica del Duero (Ministry for the Ecological Transition and the Demographic Challenge, Spain)
- 452-A-640.01.01/2014/Confederación Hidrográfica del Duero (Ministry for the Ecological Transition and the Demographic Challenge, Spain)
LinkOut - more resources
Full Text Sources
Other Literature Sources
