. 2024 Aug;31(8):1177-1185.
doi: 10.1038/s41417-024-00776-6. Epub 2024 May 29.

H3.3-G34W in giant cell tumor of bone functionally aligns with the exon choice repressor hnRNPA1L2

Affiliations

H3.3-G34W in giant cell tumor of bone functionally aligns with the exon choice repressor hnRNPA1L2

Eunbi Lee et al. Cancer Gene Ther. 2024 Aug.

Erratum in

Abstract

RNA processing is an essential post-transcriptional phenomenon that provides the necessary complexity of transcript diversity prior to translation. Aberrations in this process could contribute to tumourigenesis, and we have previously reported increased splicing alterations in giant cell tumor of bone (GCTB), which carries mutations in the histone variant H3.3 encoding glycine 34 substituted for tryptophan (H3.3-G34W). G34W interacts with several splicing factors, most notably the trans-acting splicing factor hnRNPA1L2. To gain a deeper understanding of RNA processing in GCTB and isogenic HeLa cells with H3.3-G34W, we generated RNA-immunoprecipitation sequencing data from hnRNPA1L2 and H3.3-G34W associated RNAs, which showed that 80% overlapped across genic regions and were frequently annotated as E2F transcription factor binding sites. Splicing aberrations in both GCTB and HeLa cells with H3.3-G34W were significantly enriched for known hnRNPA1L2 binding motifs (p value < 0.01). This splicing aberration differed from hnRNPA1L2 knockouts, which showed alterations independent of H3.3-G34W. Of functional significance, hnRNPA1L2 was redistributed to closely match the H3.3 pattern, likely driven by G34W, and to loci not occupied in normal parental cells. Taken together, our data reveal a functional overlap between hnRNPA1L2 and H3.3-G34W with likely significant consequences for RNA processing during GCTB pathogenesis. This provides novel opportunities for therapeutic intervention in future modus operandi.


Conflict of interest statement

The authors declare no competing interests.

Figures

Fig. 1
Fig. 1. Gene expression analysis by RNA-seq of GCTB vs. HeLa cells harboring H3.3-G34W.
a The results of hierarchical K-means clustering indicate distinct variations in DEGs. The heatmap depicts 12 GCTB (4 H3.3-WT and 8 -G34W) and 6 isogenic HeLa RNA-seq clones (three independent isogenic H3.3-WT and -G34W clones). b A comparison of WT vs. G34W in GCTB and HeLa extracted 209 overlapping DEGs of which 72% are E2F target genes. The total number of DEGs (adj. p < 0.05, |log2FC| > 1) is tabulated. c Hierarchical K-means clustering separates DEGs based on H3.3-G34W in GCTB and HeLa cells. The up- and down-regulated genes indicate cellular specificity of frequent E2F targets. d The volcano plot shows that there are 22% more down-regulated genes than up-regulated genes. e Multidimensional scaling was used to display the degree of separation between HeLa clones with WT and G34W genetic backgrounds, using a variance stabilizing transformation and showing the first two components. The knockout clones of hnRNPA1L2 cluster separately from either WT or G34W.
Fig. 2
Fig. 2. Splicing events in GCTB recapitulated in HeLa with H3.3-G34W vs. WT.
a SpliceR and rMATS analyses reveal that exon skipping/inclusion (SE) is the most common significant event. Note that hnRNPA1L2 knockout clones show a drop in SE events (arrow) and an increase in mutually exclusive events (MXE). b The plot shows significant splicing events that satisfied both FDR < 0.05 and |ΔPSI| > 0.1, where ΔPSI (percent spliced-in) is calculated by subtracting the average inclusion level of WT from the average inclusion level of G34W based on triplicate samples. Gray dots represent non-significant events, while red and blue dots represent significant events. c The rMAPS plot, based on rMATS output, identifies hnRNPA1L2 motifs as a significant motif at upregulated SE events (red) in the intron/exon junction of the target exon and the 3’end of the downstream intron in both GCTB and isogenic HeLa cells. The smallest p value is indicated with a yellow box (*p < 0.05, **p < 0.01), and a dashed line at 1.3 indicates a p value of 0.05 with significant peaks marked yellow. d A principal component analysis plot of HeLa cells was created using MASER based on the rMATS output of significant SE events. The plot successfully separates WT from G34W, which also display clonal heterogeneity.
Fig. 3
Fig. 3. Close correlation of RIP-seq peaks of isoH3.3-G34W and hnRNPA1L2 in HeLa.
a The tally of peak numbers over the number of reads after RIP-seq with anti-hnRNPA1L2 antibody shows a four-fold increase in hnRNPA1L2 peak numbers in the presence of H3.3-G34W. The GFP-tagged isoH3.3-G34W in the third bar serves as a control. b Multidimensional scaling of RIP-seq peaks separated by genetic background. c Venn diagrams indicate strong overlap of parental hnRNPA1L2 RIP-seq peaks with both GFP and hnRNPA1L2 IPs in isoH3.3-G34W clones pointing to their similar targeting regimens. d The Venn diagram displays the overlap between H3.3-G34W and hnRNPA1L2 on the genome, as indicated by RIP-seq peaks in isogenic H3.3-G34W HeLa with IP of hnRNPA1L2 and GFP-tagged H3.3-G34W. e The annotated regions from the 19,023 RIP-seq peaks from H3.3-G34W indicate that peak location is primarily at gene bodies and exons. f The GO-term analysis of RIP-peaks aligns with RNA-seq around E2F target genes, cell cycle control, and RNA metabolism. The numbers indicate fraction of genes identified in each term.
Fig. 4
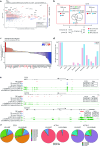
Fig. 4. Gene-by-gene analysis of hnRNPA1L2 RIP-seq peaks.
a The scatter plot displays the delta hnRNPA1L2 peak numbers of H3.3-G34W minus parental. The plot indicates peaks only detected in parental (blue dots), peaks only in H3.3-G34W (red dots), and peaks in genes of both parental and H3.3-G34W (black dots). For example, NBPF20 is a novel target that appears only in H3.3-G34W. b A comparison between splicing events from RNA-seq and RIP-seq events in H3.3-G34W in HeLa (red squares) and GCTB (blue square) over E2F targets. The 52 common genes were identified by matching the extracted SE events to annotated genes. c Waterfall plots show the inclusion level difference of these genes in GCTB. Ten genes in GCTB overlapped between RIP-seq peaks and SE events (i.e., coordinates over exons) and are marked in red text, while the remaining genes did not overlap over the same exons. d Of the 52 genes that showed perfect overlap between hnRNPA1L2 and SE events in both GCTB and HeLa, they were enriched predominantly over gene bodies. e Candidate genes from the 52 gene list showing overlap between SE events and RIP peaks. IGV traces of ZZ3, ACTN1, and KCTD17 show delta SE events of 0.03 in GCTB and −0.1 in HeLa, both at the false discovery rate of 0.01. f The pie-charts illustrate changes in isoforms in GCTB. Note that the parental does not have hnRNPA1L2 in these candidates.
Fig. 5
Fig. 5. Genic distribution of hnRNPA1L2 uncovers H3.3-G34W mimicry.
a The RIP-seq peak density of hnRNPA1L2 over annotated genic regions accumulates over the 3’UTR in WT (purple line), but partially redistributes over the 5’UTR in H3.3-G34W (green line). b hnRNPA1L2 targets exons for suppression and in the process becomes hijacked by H3.3-G34W to the histone H3.3 normal distribution locations. Importantly, the number of hnRNPA1L2 peaks increases 4-fold in H3.3-G34W. c This illustration shows the increased E2F targeting at the 5’UTR in H3.3-G34W by hnRNPA1L2 (represented by green bars), which contributes to reduced SE events at the 3’UTR and elevated promoter suppression at the 5’UTR through E2F suppression (such as E2F4 and 6).

Similar articles

Cited by

References

    1. Pan Q, Shai O, Lee LJ, Frey BJ, Blencowe BJ. Deep surveying of alternative splicing complexity in the human transcriptome by high-throughput sequencing. Nat Genet. 2008;40:1413–5. 10.1038/ng.259 - DOI - PubMed
    1. Scotti MM, Swanson MS. RNA mis-splicing in disease. Nat Rev Genet. 2016;17:19–32. 10.1038/nrg.2015.3 - DOI - PMC - PubMed
    1. Lim J, Park JH, Baude A, Fellenberg J, Zustin J, Haller F, et al. Transcriptome and protein interaction profiling in cancer cells with mutations in histone H3.3. Sci Data. 2018;5:180283. 10.1038/sdata.2018.283 - DOI - PMC - PubMed
    1. Lim J, Park JH, Baude A, Yoo Y, Lee YK, Schmidt CR, et al. The histone variant H3.3 G34W substitution in giant cell tumor of the bone link chromatin and RNA processing. Sci Rep. 2017;7:13459. 10.1038/s41598-017-13887-y - DOI - PMC - PubMed
    1. Lutsik P, Baude A, Mancarella D, Oz S, Kuhn A, Toth R, et al. Globally altered epigenetic landscape and delayed osteogenic differentiation in H3.3-G34W-mutant giant cell tumor of bone. Nat Commun. 2020;11:5414. 10.1038/s41467-020-18955-y - DOI - PMC - PubMed

MeSH terms

Substances

LinkOut - more resources