. 2024 May;6(5):847-860.
doi: 10.1038/s42255-024-01045-4. Epub 2024 May 29.

Hippo-YAP/TAZ signalling coordinates adipose plasticity and energy balance by uncoupling leptin expression from fat mass

Affiliations

Hippo-YAP/TAZ signalling coordinates adipose plasticity and energy balance by uncoupling leptin expression from fat mass

Sungwoo Choi et al. Nat Metab. 2024 May.

Abstract

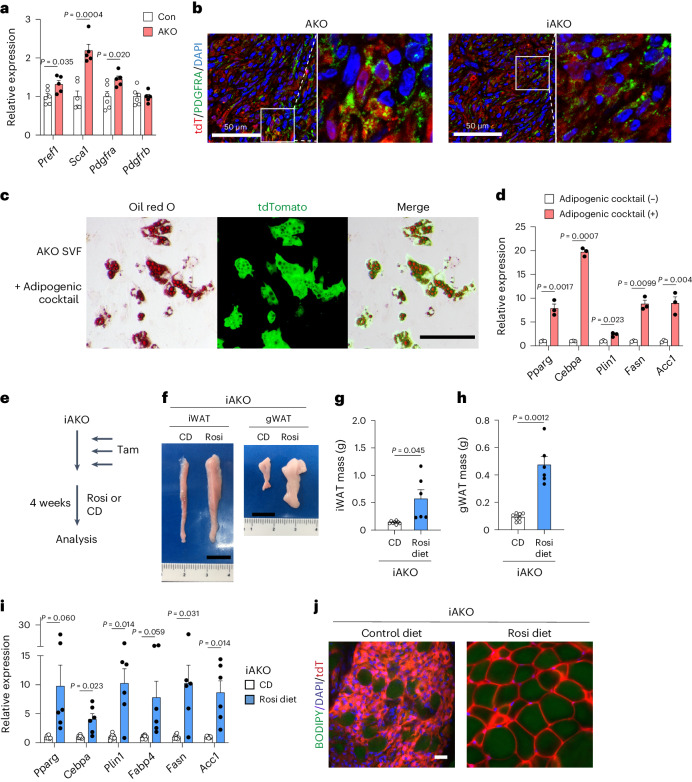
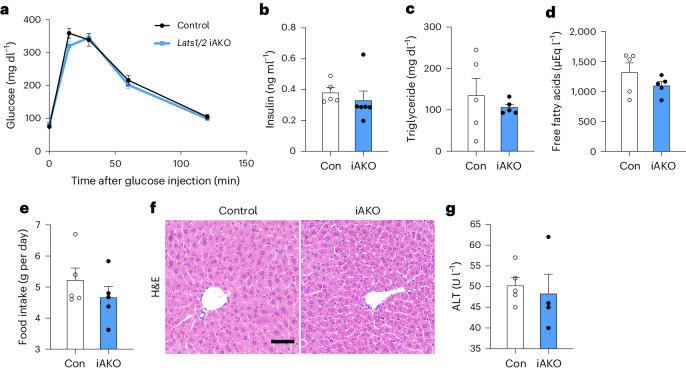
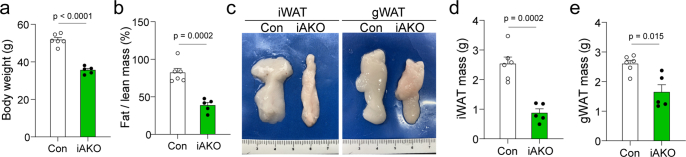
Adipose tissues serve as an energy reservoir and endocrine organ, yet the mechanisms that coordinate these functions remain elusive. Here, we show that the transcriptional coregulators, YAP and TAZ, uncouple fat mass from leptin levels and regulate adipocyte plasticity to maintain metabolic homeostasis. Activating YAP/TAZ signalling in adipocytes by deletion of the upstream regulators Lats1 and Lats2 results in a profound reduction in fat mass by converting mature adipocytes into delipidated progenitor-like cells, but does not cause lipodystrophy-related metabolic dysfunction, due to a paradoxical increase in circulating leptin levels. Mechanistically, we demonstrate that YAP/TAZ-TEAD signalling upregulates leptin expression by directly binding to an upstream enhancer site of the leptin gene. We further show that YAP/TAZ activity is associated with, and functionally required for, leptin regulation during fasting and refeeding. These results suggest that adipocyte Hippo-YAP/TAZ signalling constitutes a nexus for coordinating adipose tissue lipid storage capacity and systemic energy balance through the regulation of adipocyte plasticity and leptin gene transcription.


Conflict of interest statement

S.P. and I.-Y.K. hold equity in Myocare. The other authors declare no competing interests.

Figures

Fig. 1
Fig. 1. Adipose-specific Lats1/Lats2 knockout mice develop lipoatrophy due to regression of mature adipocytes to progenitor-like cells.
ad, iWAT of 4-week-old Lats1fl/fl; Lats2fl/fl (control (Con)) and Adipoq-Cre; Lats1fl/fl; Lats2fl/fl (AKO) mice was analysed for gross morphology (scale bar, 1 cm) (a), histology (scale bar, 50 µm) (b), adipocyte gene expression (n = 7 Con, n = 5 AKO) (c) and enrichment score plots for YAP signature (top) and PPARG signalling (bottom) gene sets from RNA-seq analysis. NES, normalized enrichment score (n = 3 per genotype) (d). e, iWAT of 4-week-old Adipoq-Cre; Lats1fl/+; Lats2fl/+; Rosa-LSL-tdTomato (Het; tdT) and Adipoq-Cre; Lats1fl/fl; Lats2fl/fl; Rosa-LSL-tdTomato (AKO; tdT) mice was subjected to whole-mount fluorescence imaging for tdT expression (red) marking Cre recombinase activity, BODIPY staining (green) of lipid droplets and Hoechst 33342 staining (blue) of nuclei. Scale bar, 20 µm. f, tdT fluorescence (red) microscopy of the SVF isolated from iWAT in mice as in e. Scale bar, 100 µm. g, iWAT of 8- to 10-week-old Lats1fl/fl; Lats2fl/fl; Rosa-LSL-tdTomato (Con) and Adipoq-CreERT2; Lats1fl/fl; Lats2fl/fl; Rosa-LSL-tdTomato (iAKO) mice treated with tamoxifen and analysed for gross morphology and whole-mount fluorescence imaging of tdT expression (red), BODIPY (green) and Hoechst (blue) staining at 1, 3 or 5 days after the final tamoxifen treatment. Scale bar, 50 µm. hk, Mice as in g were analysed for body weight (h), fat/lean mass ratio (i), gross morphology of iWAT (scale bar, 1 cm) (j) and histology of iWAT (scale bar, 50 µm) (k) at 28 days after the final tamoxifen injection (n = 5 per genotype). l, SVF isolated from iWAT of Con or iAKO mice at 6 to 8 weeks of age was treated with adipogenic induction media for 3 days, maintained for 4 days, treated with 4-hydroxytamoxifen (4OHT) for 10 days, and analysed by bright-field (Bright) and fluorescence (tdT) microscopy. Scale bar, 100 µm. m,n, RT–qPCR analysis of Lats1, Lats2 and YAP/TAZ target gene expression (m) and adipocyte gene expression (n) in SVF-differentiated adipocytes from iWAT of mice as in l (n = 3 per genotype). Source data
Fig. 2
Fig. 2. PPARG agonism rescues lipoatrophy in adipose-specific Lats1/Lats2 knockout mice.
a, RT–qPCR analysis of adipocyte progenitor marker genes in iWAT of 4-week-old Con and AKO mice (n = 6 Con, n = 5 AKO). b, Immunofluorescence staining of tdT (red) and PDGFRA (green) in iWAT of 4-week-old AKO; tdT mice and 8- to 10-week-old iAKO mice at 1 month after the final tamoxifen injection. Nuclei were stained with DAPI (blue). Boxed region shown at higher magnification on right. c, Adipocytes differentiated from the SVF of iWAT of 4-week-old AKO; tdT mice were stained with Oil Red O and subjected to bright-field (Oil Red O) or fluorescence (tdT) microscopy. Scale bar, 50 µm. d, RT–qPCR analysis of mature adipocyte marker genes in the SVF from iWAT of AKO mice treated (+), or not treated (−), with an adipogenic cocktail as in c (n = 3 per group). ej, Tamoxifen (Tam)-treated iAKO mice were maintained on a diet containing rosiglitazone (Rosi) or a control diet (CD) for 4 weeks (e), after which gross morphology of iWAT and gWAT (scale bar, 1 cm) (f), iWAT mass (g) and gWAT mass (h) were analysed. RT–qPCR analysis of adipocyte marker genes (i) and whole-mount fluorescence imaging of tdT (red), BODIPY (green) and Hoechst (blue) of iWAT (scale bar, 20 µm) (j). (n = 8 CD, n = 6 Rosi diet). Source data
Fig. 3
Fig. 3. Adipose-specific Lats1/Lats2 knockout mice do not display lipodystrophy-related metabolic dysfunction despite severe lipoatrophy.
Eight- to ten-week-old Con and iAKO mice were analysed at 3–4 weeks after the final tamoxifen injection. a,b, Glucose tolerance test (a) and fasting serum insulin (b) (n = 5 Con, n = 6 iAKO). cg, Fasting serum triglyceride (c), fasting serum free fatty acids (d), food intake (body weight) (e), liver histology (scale bar, 50 µm) (f) and serum ALT (g) (n = 5 Con, n = 5 iAKO). Source data
Fig. 4
Fig. 4. Adipose-specific Lats1/Lats2 knockout mice have increased energy expenditure and fat oxidation.
ae, Eight- to ten-week-old Con and iAKO mice were analysed in metabolic chambers for 5 days, starting 1 day after the final tamoxifen treatment. RER over 5 days (a) and during the combined light or dark periods (b), oxygen consumption rate (VO2) (c), energy expenditure (d) and total horizontal motor activity (X-total) (e). fh, Eight- to ten-week-old Con and iAKO mice were analysed for metabolic flux at 1 day after the final tamoxifen injection. Rate of lipolysis (glycerol release rate) (f), rate of palmitate turnover (g), palmitate oxidation rate (h) and 13C-labelled palmitate-derived citrate enrichment in various tissues (i). Ga., gastrocnemius; Sol., soleus; Diaph., diaphragm. (n = 5 Con, n = 5 iAKO). Source data
Fig. 5
Fig. 5. Leptin upregulation is essential for the prevention of lipodystrophy-associated metabolic dysfunction in adipose-specific Lats1/Lats2 knockout mice.
a, Serum leptin levels in Con and AKO mice (n = 5 Con, n = 5 AKO). b, Serum leptin levels in Con and Quad AKO (QKO) mice (n = 5 Con, n = 6 QKO). c, Serum leptin levels normalized by fat mass in Con and iAKO mice (n = 4 Con, n = 5 iAKO). d, RT–qPCR analysis of Adipoq and Lep expression in adipocytes differentiated from the SVF of iWAT from Con or iAKO mice after 4-hydroxytamoxifen treatment in vitro as in Fig. 1l–n (n = 3 Con, n = 3 iAKO). eh, Six-week-old Con, iAKO, Lepob/ob (ob/ob) and iAKO ob/ob (Adipoq-CreERT2; Lats1fl/fl; Lats2fl/fl; Lepob/ob) mice at 2 weeks after the final tamoxifen treatment were analysed for fasting blood glucose levels (e), fasting serum insulin levels (f), liver/body weight ratios (g) and liver histology (scale bar, 50 µm) (h). (n = 5 Con, n = 3 iAKO, n = 8 ob/ob, n = 8 iAKO ob/ob). Source data
Fig. 6
Fig. 6. YAP/TAZ–TEAD axis regulates Lep expression via directly binding the Lep gene enhancer.
a, Lep mRNA expression in undifferentiated (Undiff.) and adipocyte-differentiated (Diff.) C3H10T1/2 cells 2 days after transduction with GFP or TAZ4SA adenovirus (Undiff. n = 4 per group, Diff. n = 3 per group). b,c, TAZ ChIP–seq analysis of adipocyte-differentiated C3H10T1/2 cells expressing TAZ4SA. Peak annotation and motif enrichment analysis (b), and TAZ binding to Lep enhancer. H3K27ac and H3K4me1 data (GSE74189) (c). d, Flag-tagged YAP ChIP–seq analysis of MCF10A cells (GSE97972). YAP binding to LEP enhancer. H3K27ac, DNase I hypersensitivity (HS) (ENCODE project) and GeneHancer data. e, YAP binding to Lep enhancer in SVF-differentiated adipocytes from 4-week-old Con or AKO mice (B2m n = 3 per group; Lep n = 3 Con IgG, n = 3 Con YAP Ab, n = 5 AKO IgG, n = 5 AKO YAP Ab) Ab, antibody. f, Luciferase reporter assay for Lep enhancer (pGL-mLep) or TEAD-binding sequences (pGL-8×TB) (n = 4 per group). g, Lep mRNA expression in C3H10T1/2 cells with CRISPR–Cas9 deletion of Lep enhancer TEAD-binding site (TEAD) or non-specific (NS) guide RNA (gRNA) control (NS, n = 3 per group, TEAD n = 5 per group). hj, Lep mRNA expression in adipocytes differentiated from C3H10T1/2 cells (Con) or C3H10T1/2 cells with Lep enhancer TEAD-binding site deletion (KO). Con treated with vehicle (Veh) or verteporfin (VP) (h), Con (i) and KO (j) treated with Veh or LPA (n = 3 per group). k, RNA-seq analysis (GSE138911) for Lep expression in gWAT of Yapfl/fl; Tazfl/fl (Con) or Adipoq-Cre; Yapfl/fl; Tazfl/fl (YTKO) mice fed normal chow (NCD) or high-fat (HFD) diet. FPM, fragments per million mapped fragments (n = 2 per genotype). l, Lep mRNA expression in gWAT of Con and YTKO mice after overnight food deprivation (Fasted) or 4 h refeeding (Refed) (Con n = 8 per group, n = 4 YTKO Fasted, n = 5 YTKO Refed). m,n, Immunofluorescence images of YAP/TAZ (green), PPARG (adipocyte nuclei, red) and DAPI (blue) (scale bar, 20 µm) (m), and proportion YAP/TAZ-activated adipocytes quantified by nuclear/cytoplasmic ratio of YAP/TAZ per PPARG+ nuclei (n) in iWAT of C57BL6/J mice (n = 4 per group). o, Working model of Hippo–YAP/TAZ function in mature adipocytes. Source data
Extended Data Fig. 1
Extended Data Fig. 1. Adipocyte-specific deletion of Lats1/2 activates YAP/TAZ and attenuates PPAR signaling.
a, RT-qPCR analysis of the expression of Lats1, Lats2, and YAP/TAZ target genes in iWAT of 4-week-old control (Con) and AKO male mice as in Fig. 1a–c. b, Immunohistochemical staining of YAP and TAZ in iWAT of control and AKO mice as in a. Scale bar = 50 μm. Data expressed as mean ± s.e.m. (n = 6 Con, n = 5 AKO). Data were analyzed by two-tailed unpaired t test. c-e, RNA-seq analysis was performed using total RNA from iWAT of 4-week-old Lats1fl/fl; Lats2fl/fl; Rosa-LSL-tdTomato (control, Con) or Adipoq-Cre; Lats1fl/fl; Lats2fl/fl; Rosa-LSL-tdTomato (AKO; tdT) male mice (n = 3 per genotype). MA plot of differentially expressed genes (DEGs) from iWAT RNA-seq data. Significantly changed (p < 0.05) genes were shown by red (fold change ≥ 2) or blue (fold change ≤ -2), with representative genes in arrow (c). GSEA analysis with KEGG pathway gene sets showing the top 5 significantly downregulated pathways (all p < 0.001) in AKO compared to control iWAT. NES, normalized enrichment score (d). Heatmaps to visualize DEGs related to the YAP signature (left, Cordenonsi et al. Cell 2011) and PPARG signaling pathways (right). Gene symbols represent upregulated (in red) or downregulated (in blue) core enrichment genes that contribute most to the enrichment result (e). f, Inguinal white adipose tisssue (iWAT) H&E histology of 4-week-old of Lats1fl/fl; Lats2fl/fl; Yapfl/fl; Tazfl/fl (Control), Adipoq-Cre; Lats1fl/fl; Lats2fl/fl (AKO), and Adipoq-Cre; Lats1fl/fl; Lats2fl/fl; Yapfl/fl; Tazfl/fl (Quad AKO). Scale bar = 50 μm. Source data
Extended Data Fig. 2
Extended Data Fig. 2. Adipocyte-specific deletion of Lats1/2 leads to loss of lipid content and decreased mass in gWAT and BAT.
a–d, Gross morphology (a), tissue mass (b), H&E staining (scale bar = 50 μm) (c), and expression of mature adipocyte marker genes (d) for gWAT of 4-week-old control (Con) and AKO male mice as in Fig. 1a–c (n = 6 Con, n = 5 AKO). e–h, Gross morphology (e), tissue mass (f), H&E staining (scale bar = 50 μm) (g), and expression of mature adipocyte marker genes (h) for gWAT of 8- to 10-week-old control (Con) and iAKO male mice at 28 days after the final tamoxifen treatment as in Fig. 1g–k (n = 6 Con, n = 7 iAKO). i–k, H&E staining (scale bar = 50 μm) (i), and expression of mature adipocyte marker genes (j), and brown fat activation marker genes (k) for BAT of 4-week-old control (Con) and AKO male mice as in Fig. 1a–c (n = 6 Con, n = 5 AKO). l–n, H&E staining (scale bar = 50 μm) (l), and expression of mature adipocyte marker genes (m), and brown fat activation marker genes (n) for BAT of 8- to 10-week-old control (Con) and iAKO male mice at 28 days after the final tamoxifen treatment as in Fig. 1g–k (n = 6 Con, n = 7 iAKO). Data expressed as mean ± s.e.m. Data were analyzed by two-tailed unpaired t test. Source data
Extended Data Fig. 3
Extended Data Fig. 3. Inducible deletion of adipose Lats1/2 reduces fat mass in diet-induced obese mice.
a-e, Lats1fl/fl; Lats2fl/fl (Con) and Adipoq-CreER; Lats1fl/fl; Lats2fl/fl (iAKO) male mice aged 8 to 10 weeks were fed high fat diet for 4 months, followed by three intraperitoneal injection of tamoxifen (100 mg/kg) every other day. Body weight (a), fat mass/lean mass ratio (b), gross morphology of iWAT and gWAT (c), iWAT mass (d), and gWAT mass (e) was assessed at 28 days after the final tamoxifen injection (n = 6 Con, n = 5 iAKO). Data expressed as mean ± s.e.m. Data were analzyed by two-tailed unpaired t test. Source data
Extended Data Fig. 4
Extended Data Fig. 4. Inducible deletion of Lats1/2 or TAZ activation disrupts adipocyte maintenance in vitro.
a, Adipoq-CreER; Lats1fl/+; Lats2fl/+; Rosal-LSL-tdTomato (Control, Con) and Adipoq-CreER; Lats1fl/fl; Lats2fl/fl; Rosal-LSL-tdTomato (iAKO; tdT) male mice at 8 to 10 weeks of age were treated with tamoxifen (100 mg/kg) every other day for three times (n = 3 Con, n = 3 iAKO). Primary adipocytes were isolated from iWAT of Con and iAKO; tdT mice at one day after the final tamoxifen injection, cultured for 4 days and then subjected to bright-field microscopy and fluorescence microscopy of tdTomato (tdT) expression (red). Scale bar = 50 μm. b, Proportion of unilocular cells among tdT+ cells for cultures as in a (n = 6 Con images, n = 8 iAKO images). c, C3H10T1/2 cells were exposed to inducers of adipogenesis for 3 days, maintained for 2 days, infected with adenoviruses encoding either a hyperactive form of TAZ (TAZ4SA) or green fluorescent protein (GFP) for 2 days, and then maintained in culture for an additional 2 days before observation by bright-field microscopy. Scale bar = 250 μm. d, e, RT-qPCR analysis of the expression of YAP/TAZ target genes (d) and of mature adipocyte marker genes (e) in cells treated as in c (n = 3 per condition). Data expressed as mean ± s.e.m. Data were analyzed by two-tailed unpaired t test. Source data
Extended Data Fig. 5
Extended Data Fig. 5. Lats1/2 KO adipocyte-derived cells acquire progenitor-like gene expression signatures.
a-f, Stromal vascular fraction (SVF) were isolated from the inguinal white adipose tissue of 4-week-old Lats1fl/fl; Lats2fl/fl; Rosa-LSL-tdTomato (Con) and Adipoq-Cre; Lats1fl/fl; Lats2fl/fl; Rosa-LSL-tdTomato (AKO; tdT) male mice (n = 10 Con, n = 5 AKO; tdT). CD45-/tdT- cells from Con SVF (Con CD45- SVF cells) and CD45-/tdT+ cells from AKO; tdT SVF (Lats1/2 KO adipocyte-derived cells) were flow-sorted and subjected to single cell RNA-sequencing. Doublets were excluded based on forward scatter profiles. Live cells were selected using DAPI (Hoechst Blue) and leukocytes were removed using CD45 (APC) antibody. FACS gating strategy for Con CD45- SVF cells (a), and Lats1/2 KO adipocyte-derived cells (b). Uniform manifold approximation and projection (UMAP) (c), clusters (d) of Con CD45- SVF cells and Lats1/2 KO adipocyte-derived cells. Dot plot analysis of expression levels for adipocyte progenitor subtype, adipocyte, and classical preadipocyte marker genes in each cluster (Merrick et al. Science 2019) (e). Distributions of Con CD45- SVF cells and Lats1/2 AKO adipocyte derived cells (f). Source data
Extended Data Fig. 6
Extended Data Fig. 6. Lats1/2 KO adipocyte-derived cells express cell surface progenitor markers and retain adipogenic potential to redifferentiate into adipocytes.
a-c, Stromal vascular fraction (SVF) were isolated from the iWAT of 4-week-old Lats1fl/fl; Lats2fl/fl; Rosa-LSL-tdTomato (Con) and Adipoq-Cre; Lats1fl/fl; Lats2fl/fl; Rosa-LSL-tdTomato male mice (n = 5 Con, n = 3 AKO). CD45-/CD31-/tdT- cells from control SVF (Con SVF cells) and CD45-/CD31-/tdT+ cells from AKO; tdT SVF (Lats1/2 KO adipocyte-derived cells) were selected, followed by flow-sorting with DPP4 or ICAM1 antibody. 48 hr after plating, the cells were subjected to adipogenic differentiation media to test adipogenic potential. FACS gating plot using DPP4 (PE-Cy7) or ICAM1 (PE-Cy7) antibody of Con SVF cells or Lats1/2 KO adipcoyte-derived cells (a). Fluorescence images of adipocytes differentiated from Lats1/2 KO adipocyte-derived cells (b). Fluorescence images of adipocytes differentiated from DPP4+ or ICAM1+ cells from Con SVF cells or Lats1/2 KO adipocyte-derived cells (c). tdT, red; BODIPY, yellow; DAPI, blue. Scale bar = 50 μm. Experiment was repeated twice with similar results. Source data
Extended Data Fig. 7
Extended Data Fig. 7. Adipose Yap/Taz is essential for adipose Lats1/2 deletion induced whole-body energy expenditure and hepatic Pgc1a induction.
a-b, Food intake (a) and liver H&E histology (scale bar = 100μm) (b) of Lats1fl/fl; Lats2fl/fl (Con) or Adipoq-Cre; Lats1fl/fl; Lats2fl/fl (AKO) male mice at 4 weeks of age. (n = 9 Con, n = 7 AKO) c-h, Con and AKO were placed in a metabolic chamber for indirect calorimetry at 4 weeks of age. Con and AKO mice were sacrificed at 4-5 weeks of age. Body weight (c), RER over 3 days (d), during the combined light or dark periods (e) oxygen consumption rate (VO2) (f) and energy expenditure (g) (n = 4 per genotype). Liver Pgc1a mRNA expression (h) was assessed by qPCR (n = 6 Con, n = 5 AKO). i-n, Lats1fl/fl; Lats2fl/fl; Yapfl/fl; Tazfl/fl (Quad Con) and Adipoq-Cre; Lats1fl/fl; Lats2fl/fl; Yapfl/fl; Tazfl/fl (Quad AKO) male mice were placed in a metabolic chamber for indirect calorimetry at 4 weeks of age. Quad Con and Quad AKO male mice were sacrificed at 4-5 weeks of age. Body weight (i), RER over 3 days (j), during the combined light or dark periods (k) oxygen consumption rate (VO2) (l) and energy expenditure (m). Liver Pgc1a mRNA expression (n) was assessed by qPCR (n = 5 Quad Con, n = 6 Quad AKO). Data expressed as mean ± s.e.m. Data were analyzed by two-tailed unpaired t test. Source data
Extended Data Fig. 8
Extended Data Fig. 8. Recombinant leptin replacement rescues lipodystrophy-associated metabolic dysfunction in leptin-deficient adipose-specific Lats1/2 knockout mice.
a-b, Lats1fl/fl; Lats2fl/fl; Lep + /+ (Con), Adipoq-CreER; Lats1fl/fl; Lats2fl/fl; Lep + /+ (iAKO), Lats1fl/fl; Lats2fl/fl; Lepob/ob (Con ob/ob), and Adipoq-CreER; Lats1fl/fl; Lats2fl/fl; Lepob/ob (iAKO ob/ob) male and female mice at 5 weeks of age were intraperitoneally injected with tamoxifen (100 mg/kg) every other day for three times. Two weeks after the final tamoxifen injection, mice were sacrificed, followed by analysis of iWAT (a) and gWAT (b) mass. Data expressed as mean ± s.e.m. (n = 5 Con, n = 3 iAKO, n = 8 ob/ob, n = 8 iAKO ob/ob) c-i, iAKO ob/ob male and female mice at 5 weeks of age were intraperitoneally treated with tamoxifen (100 mg/kg) every other day for three times. From one day after the last tamoxifen injection, iAKO ob/ob mice were intraperitoneally injected with 5 mg/kg recombinant leptin (LEP) every day until mice were sacrificed. Two weeks after the final tamoxifen injection, mice were sacrificed, followed by analysis of iWAT mass (c), gWAT mass (d), liver H&E histology (scale bar = 50 μm) (e), liver mass/body mass (f), fasting blood glucose (g), fasting serum insulin concentration (h), and fasting serum triglycerides (i), were determined. Data expressed as mean ± s.e.m. (n = 8 iAKO ob/ob, n = 8 iAKO ob/ob + LEP) Data were analyzed by two-tailed unpaired t test. Source data
Extended Data Fig. 9
Extended Data Fig. 9. YAP and TAZ in mice adipose tissues are stabilized by a refeed after overnight fasting or high fat diet feeding.
a-b, Wild type control male mice aged 8 to 10 weeks were fasted overnight and then fed for 4 hours. After fasting or refeeding, inguinal white adipose tissue of mice was collected and subjected to western blot analysis to measure protein levels (a). The western signals were quantified against VINCULIN (b) (n = 5 Fasted, n = 7 Refed). c-d, Wild type control male mice aged at 8 weeks of age were fed with normal chow diet (NCD) or high fat diet (HFD) for 14 weeks. Inguinal white adipose tissue of mice was harvested, and the protein levels were measured by western blot analyses (c). The western blot signals were quantified against VINCULIN (d) (n = 7 NCD, n = 7 HFD). Data expressed as mean ± s.e.m. Data were analyzed by two-tailed unpaired t test. Source data
Extended Data Fig. 10
Extended Data Fig. 10. Systems genetics analysis of TAZ expression and genetic variants.
a, Expression-based Phenome-Wide Association study (ePheWAS) (https://systems-genetics.org) was performed in BXD mice showing the association of Wwrt1/TAZ expression in subcutanenous white adipose tissue (ScWAT) and various mouse phenotypes39. The dashed horizontal line represents the significance threshold. CD: chow diet. b-c, Scatter plots of Lep and Wwtr1/TAZ (b) or Yap1/YAP (c) expression in BXD ScWAT under chow diet (CD) and high-fat diet (HFD) conditions. The lines indicate linear fits, and Pearson correlation coefficients are shown. d, Lollipop plot demonstrating the associated phenotypes of genetic variants in TAZ identified by genome-wide association study (GWAS) using UK Biobank whole-genome seqence (WGS) data. The variant effect prediction (VEP) is shown. Source data

References

    1. Rosen ED, Spiegelman BM. Adipocytes as regulators of energy balance and glucose homeostasis. Nature. 2006;444:847–853. doi: 10.1038/nature05483. - DOI - PMC - PubMed
    1. Kahn CR, Wang G, Lee KY. Altered adipose tissue and adipocyte function in the pathogenesis of metabolic syndrome. J. Clin. Invest. 2019;129:3990–4000. doi: 10.1172/JCI129187. - DOI - PMC - PubMed
    1. Sethi JK, Vidal-Puig AJ. Thematic review series: adipocyte biology. Adipose tissue function and plasticity orchestrate nutritional adaptation. J. Lipid Res. 2007;48:1253–1262. doi: 10.1194/jlr.R700005-JLR200. - DOI - PMC - PubMed
    1. Mann JP, Savage DB. What lipodystrophies teach us about the metabolic syndrome. J. Clin. Invest. 2019;129:4009–4021. doi: 10.1172/JCI129190. - DOI - PMC - PubMed
    1. Wang F, et al. Lipoatrophy and severe metabolic disturbance in mice with fat-specific deletion of PPARγ. Proc. Natl Acad. Sci. USA. 2013;110:18656–18661. doi: 10.1073/pnas.1314863110. - DOI - PMC - PubMed

MeSH terms

Grants and funding