. 2024 May 29;23(1):114.
doi: 10.1186/s12943-024-02022-x.

JUN mediates the senescence associated secretory phenotype and immune cell recruitment to prevent prostate cancer progression

Affiliations

JUN mediates the senescence associated secretory phenotype and immune cell recruitment to prevent prostate cancer progression

Torben Redmer et al. Mol Cancer. .

Abstract

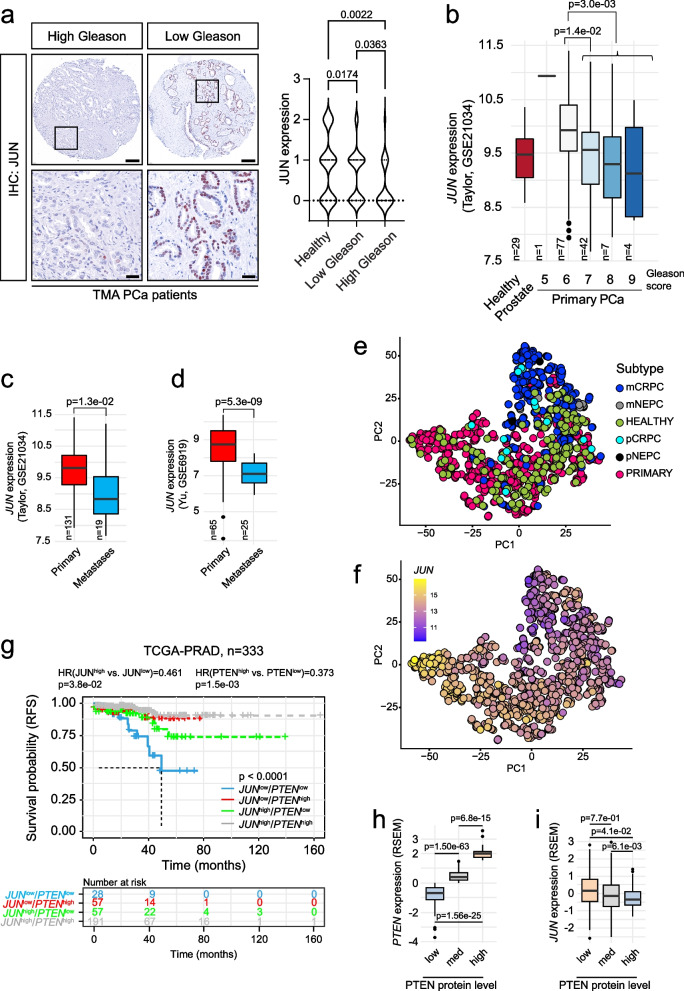
Background: Prostate cancer develops through malignant transformation of the prostate epithelium in a stepwise, mutation-driven process. Although activator protein-1 transcription factors such as JUN have been implicated as potential oncogenic drivers, the molecular programs contributing to prostate cancer progression are not fully understood.

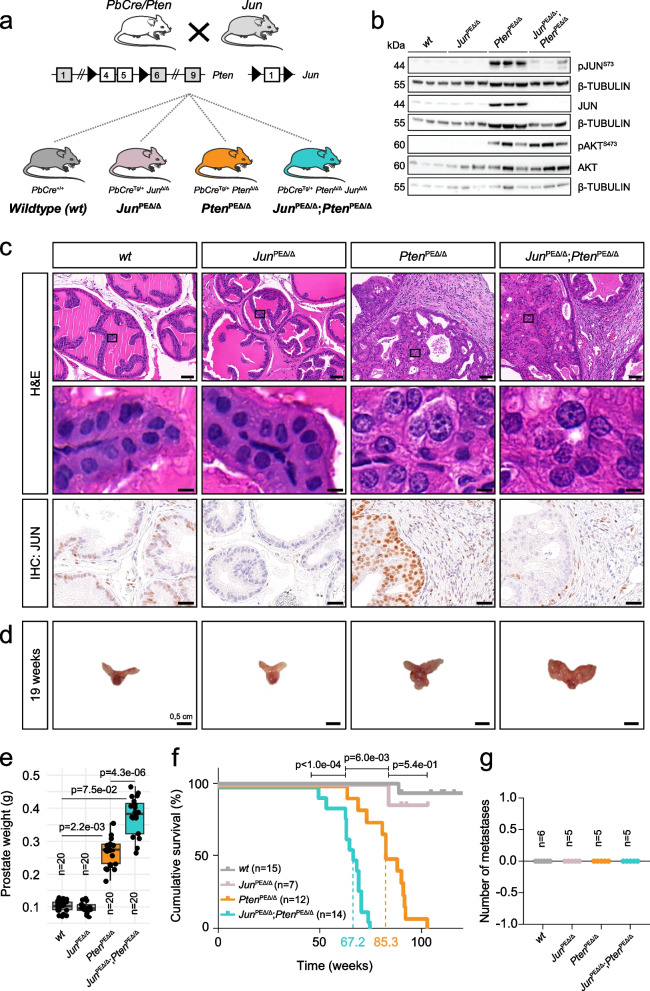
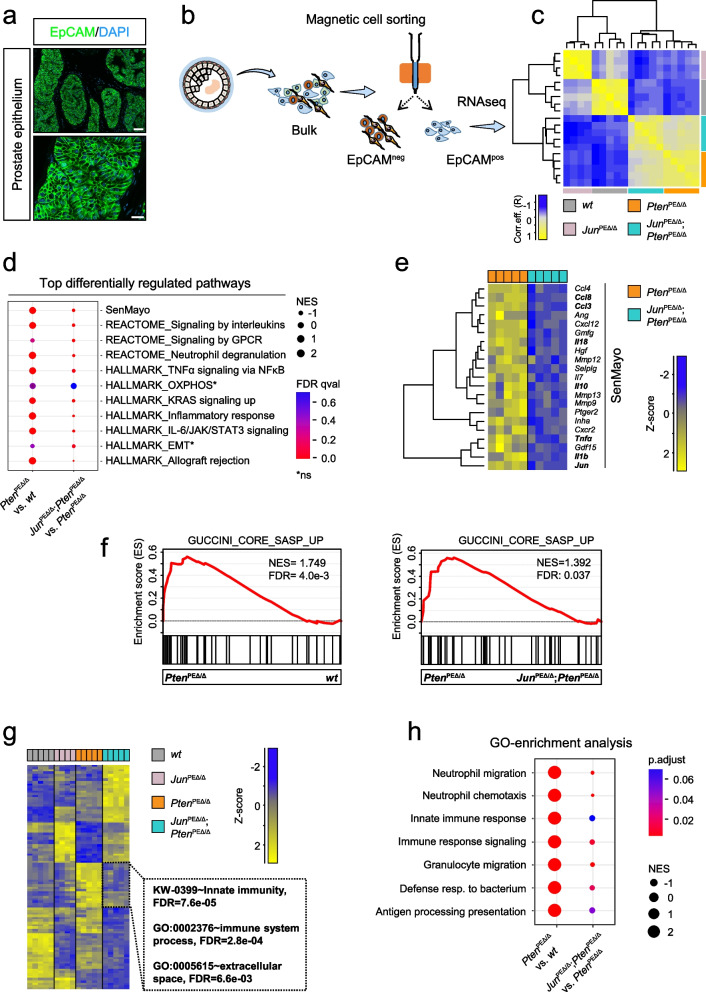
Methods: We analyzed JUN expression in clinical prostate cancer samples across different stages and investigated its functional role in a Pten-deficient mouse model. We performed histopathological examinations, transcriptomic analyses and explored the senescence-associated secretory phenotype in the tumor microenvironment.

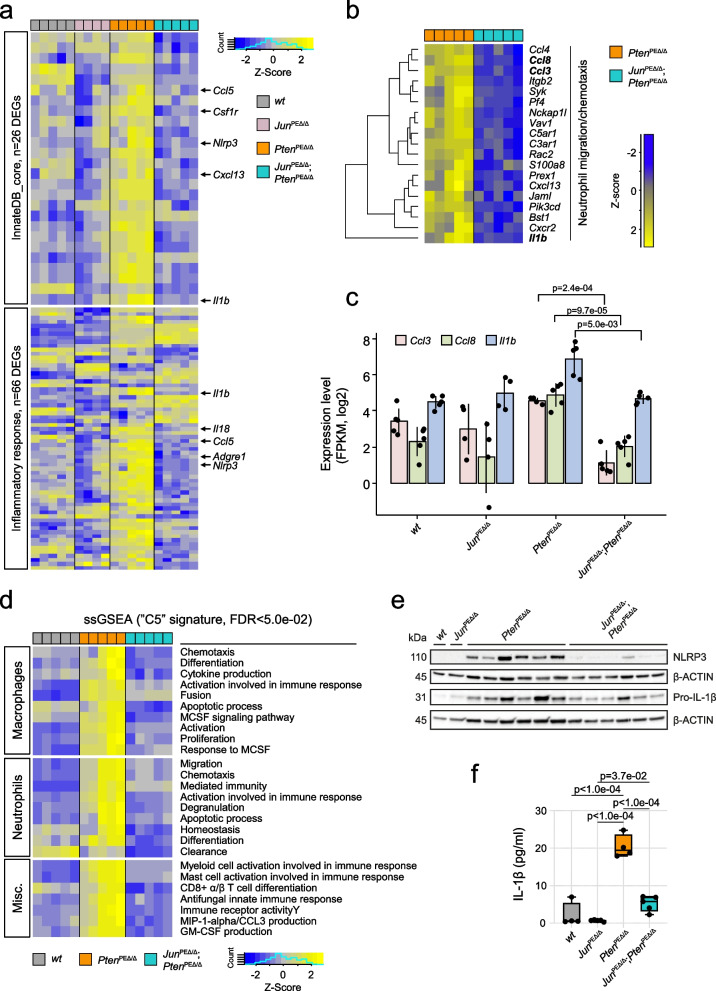
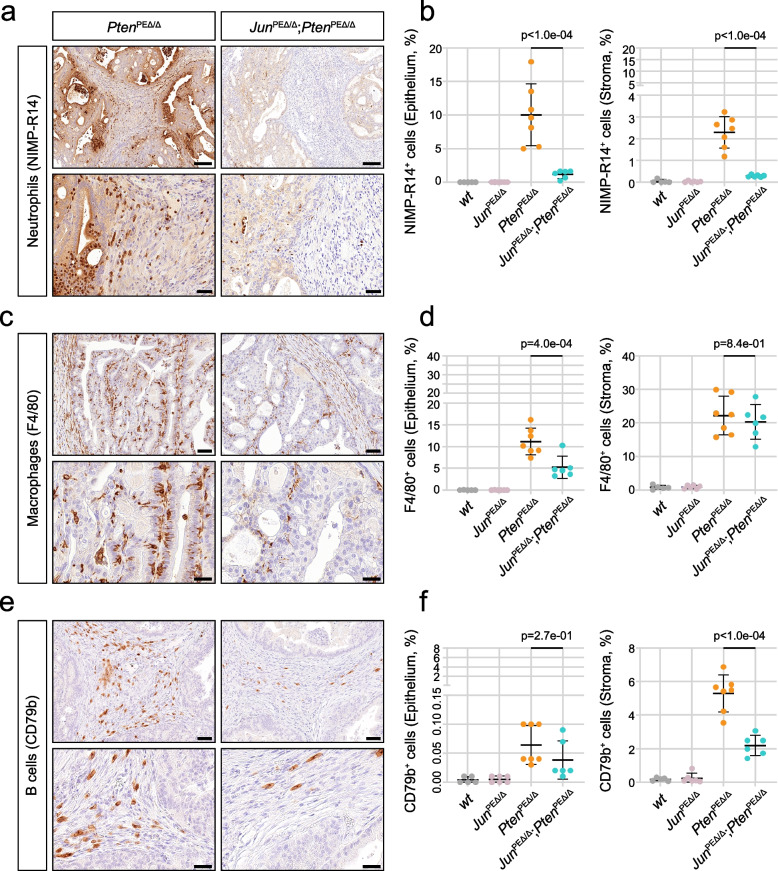
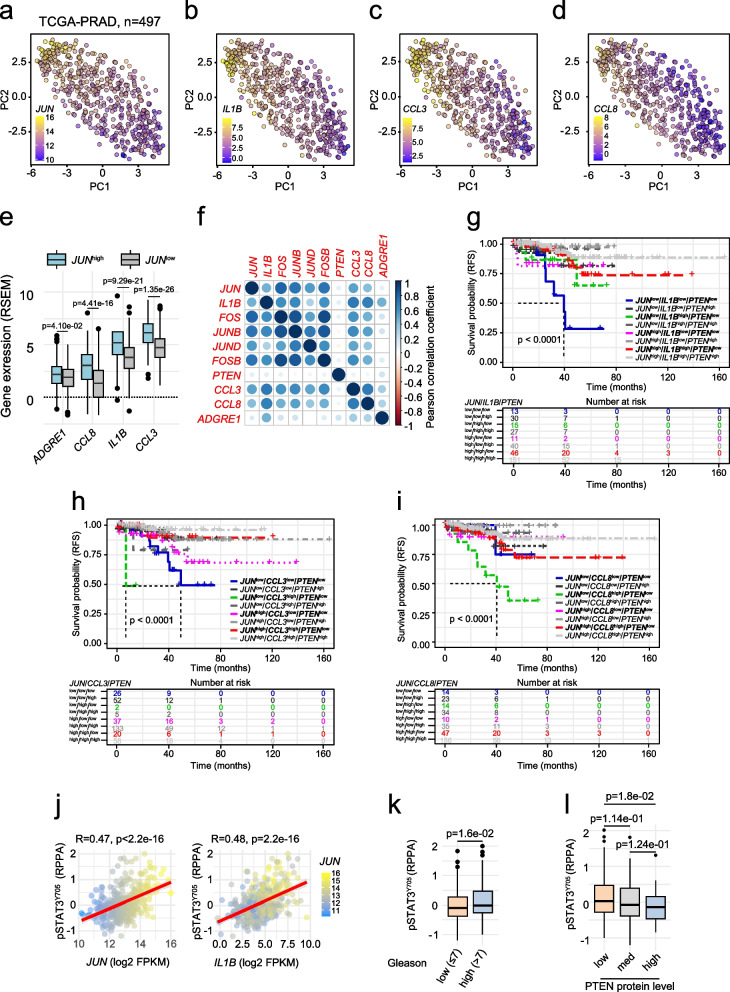
Results: Elevated JUN levels characterized early-stage prostate cancer and predicted improved survival in human and murine samples. Immune-phenotyping of Pten-deficient prostates revealed high accumulation of tumor-infiltrating leukocytes, particularly innate immune cells, neutrophils and macrophages as well as high levels of STAT3 activation and IL-1β production. Jun depletion in a Pten-deficient background prevented immune cell attraction which was accompanied by significant reduction of active STAT3 and IL-1β and accelerated prostate tumor growth. Comparative transcriptome profiling of prostate epithelial cells revealed a senescence-associated gene signature, upregulation of pro-inflammatory processes involved in immune cell attraction and of chemokines such as IL-1β, TNF-α, CCL3 and CCL8 in Pten-deficient prostates. Strikingly, JUN depletion reversed both the senescence-associated secretory phenotype and senescence-associated immune cell infiltration but had no impact on cell cycle arrest. As a result, JUN depletion in Pten-deficient prostates interfered with the senescence-associated immune clearance and accelerated tumor growth.

Conclusions: Our results suggest that JUN acts as tumor-suppressor and decelerates the progression of prostate cancer by transcriptional regulation of senescence- and inflammation-associated genes. This study opens avenues for novel treatment strategies that could impede disease progression and improve patient outcomes.

Keywords: AP-1 transcription factors; Immune infiltration; JUN; Prostate cancer; SASP; Senescence.


Conflict of interest statement

The authors declare no competing interests.

Figures

Fig. 1
Fig. 1
JUN levels are correlated with prostate cancer progression stages. a Left panel: Representative immunohistochemistry (IHC) images of tissue microarrays (TMAs) investigating human prostate tumors (n = 60) with high or low Gleason scores stained for JUN protein. Scale bars indicate 150 µm (top row) and 30 µm (bottom row), images are presented in 16.8 × (top row) and 80.0 × magnification (bottom row). The area used for the higher magnification is indicated by the rectangle. Right panel: Violin plot showing JUN expression divided in absent (0), low-grade (1), medium-grade (2) and high-grade (3) in healthy (no Gleason score), low Gleason (Gleason score 5–6) and high Gleason (Gleason score 7–9) TMA samples. b JUN mRNA levels in high (Gleason score ≥ 7) and low (Gleason score < 7) grade human prostate tumors. Data were retrieved from [35]. Significance was determined by an unpaired, two-sided t-test or one-sided Anova. c High and low JUN levels significantly (p = 1.3e-02) discriminate primary prostate tumors (n = 131) (red) and metastases (n = 19) (blue). Data were retrieved from [35]. d High and low JUN levels significantly (p = 5.3e-09) discriminate primary prostate tumors (n = 65) (red) and metastases (n = 25) (blue). Data were retrieved from [37]. Significances in c-d were determined by an unpaired, two-sided t-test. e Principal component analysis (PCA) of prostate tumors of different developmental stages comprising normal prostate tissue, primary tumors and primary (p) and metastatic (m) CRPC and NEPC tumors. Datasets from [38]. f Overlay of JUN expression with PCA clustering from e). JUN levels are color coded from high expression (yellow) to low expression (blue). g Kaplan–Meier survival analysis of TCGA-PRAD [33] tumors (n = 333) assessing levels of JUN and PTEN. Hazard ratios (HR) were determined by Cox-regression analysis: HR(JUNhigh vs. JUNlow) = 0.461, p = 3.8e-02 and HR(PTENhigh vs. PTENlow) = 0.307, p = 1.5e-03. Statistical testing was done with a logrank test. h Co-analysis between PTEN expression (RNA-Seq by Expectation–Maximization (RSEM) and PTEN protein level reverse-phase protein array (RPPA)). i Co-analysis between PTEN protein level (RRPA) and JUN expression (RSEM)
Fig. 2
Fig. 2
Jun-deficiency fosters the progression of Pten-loss induced tumors. a Top: Schematic representation of mouse models used in the study. Homozygous loss of Pten or Jun was achieved by a Probasin promoter-controlled Cre recombinase (PbCre)-mediated ablation of floxed exons 4 and 5 (Pten) or exon 1 (Jun). Bottom: established and investigated genetic models. Wildtype (PbCre+/+; wt) and mice with single knockout of Pten (PbCretg/+; PtenPEΔ/Δ) and Jun (PbCretg/+; JunPEΔ/Δ) were compared with double knockout (PbCretg/+; JunPEΔ/Δ;PtenPEΔ/Δ). PE = prostate epithelium; tg = transgene; Δ = knockout. b Western blot analysis of phosphorylated (pJUNS73 and pAKTS473) and total JUN and AKT. β-TUBULIN served as loading control. Protein lysates of entire organs (n = 3 biological replicates) from 19-week-old wt, PtenPEΔ/Δ, JunPEΔ/Δ and JunPEΔ/Δ;PtenPEΔ/Δ were investigated. c Top row: H&E stainings of 19-week-old wt, PtenPEΔ/Δ, JunPEΔ/Δ and JunPEΔ/Δ;PtenPEΔ/Δ prostates. Scale bars indicate 60 µm (top row) and 2 µm (second row), images are presented in 40.0 × (top row) and 600.0 × magnification (second row). Black rectangles represent the area used for the zoom image below. Bottom row: IHC with an antibody against JUN in 19-week-old prostates of all four experimental groups. Scale bars indicate 30 µm; images are presented in 100.0 × magnification. d Macroscopic images of 19-week-old dissected prostates of wt, PtenPEΔ/Δ, JunPEΔ/Δ and JunPEΔ/Δ;PtenPEΔ/Δ mice. e Box plot showing the weights of prostates in grams between wt, PtenPEΔ/Δ, JunPEΔ/Δ and JunPEΔ/Δ;PtenPEΔ/Δ 19-week-old animals (n = 20). Significance was determined with an unpaired, two-sided t-test. f Kaplan–Meier survival analysis of wt, PtenPEΔ/Δ, JunPEΔ/Δ and JunPEΔ/Δ;PtenPEΔ/Δ animals. Biological replicates are indicated and the cumulative survival (%) is shown. Statistical significance was calculated with a logrank test. g Organs (heart, lung, liver, spleen, kidney, lymph nodes and brain) of 39-week-old wt, PtenPEΔ/Δ, JunPEΔ/Δ and JunPEΔ/Δ;PtenPEΔ/Δ mice were stained with H&E and analysed for metastatic lesion formation. The number of metastases detected in each tissue are shown
Fig. 3
Fig. 3
Transcriptome profiling of genetic models reveals a JUN-dependent regulation of innate immunity. a Representative immunofluorescence (IF) image of a wt murine prostate for the epithelial marker EpCAM (green). DAPI (blue) is shown as a nuclear stain. Top image: 40.0 × magnification, scale bar represents 60 µm; Bottom image: 147.5 × magnification, scale bar represents 20 µm. b Overview of sample preparation for transcriptome profiling of wt, PtenPEΔ/Δ, JunPEΔ/Δ and JunPEΔ/Δ;PtenPEΔ/Δ prostate samples of 19-week-old animals. An antibody against the epithelial marker EpCAM was used to separate single cell suspensions of minced and digested prostates into EpCAM positive (pos) and negative (neg) fractions by magnetic cell sorting. EpCAMpos cells were used for RNA-seq expression profiling. c Heat map showing correlation analysis of tumor samples described in b) regarding global similarity of samples. The Pearson correlation coefficient (R) is shown (color coded). d Gene onthology (GO)-enrichment analysis of differentially expressed genes (DEGs) showing the top differentially regulated pathways between PtenPEΔ/Δ and JunPEΔ/Δ;PtenPEΔ/Δ. Significance as shown by FDR is color coded, enriched (positive normalized enrichment score (NES)) or depleted (negative NES) processes are indicated. Asterisk represents non-significant pathways (ns). e Heat map showing SenMayo genes most significantly (p ≤ 1e-02) regulated among PtenPEΔ/Δ and JunPEΔ/Δ;PtenPEΔ/Δ prostates. f GSEA enrichment analysis using the Guccini_core_SASP gene set in PtenPEΔ/Δ versus JunPEΔ/Δ;PtenPEΔ/Δ and PtenPEΔ/Δ versus wt animals. g Heat map representation of wt, PtenPEΔ/Δ, JunPEΔ/Δ and JunPEΔ/Δ;PtenPEΔ/Δ samples showing DEGs. “Innate immunity”, FDR = 7.64e-05; “Immune system”, FDR = 2.77e-04 and “Extracellular space”, FDR = 6.60e-03 related processes most discriminated the groups. Genotypes and expression levels are color coded. h GO-enrichment analysis of DEGs showing the regulation of innate immune cells such as neutrophil granulocytes. Significance as shown by p-value is color coded, enriched (positive NES) or depleted (negative NES) processes are indicated. Shown are the signaling pathways enriched in PtenPEΔ/Δ tumors compared to wt (left side) and JunPEΔ/Δ;PtenPEΔ/Δ tumors compared to PtenPEΔ/Δ (right side)
Fig. 4
Fig. 4
JUN expression determines the level of immune cell infiltration of Pten-loss driven tumors. a Heat map showing JUN-dependent regulation of genes related to innate immunity (upper panel) and inflammatory response (lower panel) in wt, JunPEΔ/Δ, PtenPEΔ/Δ and JunPEΔ/Δ;PtenPEΔ/Δ prostates. JUN-dependent core factors such as Il1b, Nlrp3 and Ccl5 are highlighted. b Heat map presenting the JUN-dependent regulation of genes involved in migration and chemotaxis of neutrophil granulocytes in PtenPEΔ/Δ and JunPEΔ/Δ;PtenPEΔ/Δ prostates. Genotypes and expression levels in a-b are color coded. c Expression levels (log2, FPKM) of Ccl3, Ccl8 and Il1b are significantly (Ccl3, p = 2.4e-04; Ccl8, p = 9.7e-05 and Il1b, p = 5.0e-03) reduced in EpCAM+ cells of JunPEΔ/Δ;PtenPEΔ/Δ prostates. Significance was determined by an unpaired two-sided t-test. d Single-sample GSEA analysis using the M5 signature of Broad Institute’s molecular signature database (MsigDB) revealing enrichment of macrophage- and neutrophil-associated properties in PtenPEΔ/Δ compared to JunPEΔ/Δ;PtenPEΔ/Δ prostates. e Western blot analysis of NLRP3 and non-cleaved Pro-IL-1β in all four experimental groups in biological replicates. β-ACTIN served as loading control. f Multiplex immunoassay of homogenized prostate samples of 19-week-old wt, JunPEΔ/Δ, PtenPEΔ/Δ and JunPEΔ/Δ;PtenPEΔ/Δ animals for analysis of IL-1β levels in pico grams (pg)/ml of indicated biological replicates. Statistical testing was done with one-way Anova, significant p-values are indicated
Fig. 5
Fig. 5
Histological analysis of infiltrating immune cells reveals downregulated innate immune response in JunPEΔ/Δ;PtenPEΔ/Δ prostates. a Representative images of IHC stainings of NIMP-R14, a pan-marker of neutrophil granulocytes, indicating high neutrophil infiltration of PtenPEΔ/Δ prostates, reverted by the additional loss of Jun in JunPEΔ/Δ;PtenPEΔ/Δ prostates. Top row: 20.0 × magnification, scale bar represents 150 µm; Bottom row: 63.0 × magnification, scale bar represents 40 µm. b Quantification of NIMP-R14+ neutrophils in epithelium (left) and stroma (right). A significantly decreased (p < 1e-04) infiltration of neutrophils in tumors and adjacent stroma of JunPEΔ/Δ;PtenPEΔ/Δ prostates is evident. c Representative images of IHC stainings for the pan-marker of macrophages F4/80. A high infiltration of PtenPEΔ/Δ prostates and adjacent stroma by macrophages is evident and reverted by the additional loss of Jun in JunPEΔ/Δ;PtenPEΔ/Δ prostates. Top row: 40.0 × magnification, scale bar represents 60 µm; Bottom row: 100.0 × magnification, scale bar represents 30 µm. d Quantification of F4/80+ macrophages in epithelium (left) and stroma (right). A significantly decreased (p = 4e-04) infiltration of macrophages in tumors but not adjacent stroma (p = 8.3e-01) of JunPEΔ/Δ;PtenPEΔ/Δ prostates is evident. e Representative images of IHC stainings of B cell infiltration using the pan-marker CD79b. A high infiltration of stroma adjacent to PtenPEΔ/Δ prostates by CD79b+ B cells is evident and reverted by the additional loss of Jun in JunPEΔ/Δ;PtenPEΔ/Δ prostates. Top row: 40.0 × magnification, scale bar represents 60 µm; Bottom row: 100.0 × magnification, scale bar represents 30 µm. f Quantification of B cells in epithelium (left) and stroma (right). B cell infiltration as observed in the stroma of PtenPEΔ/Δ prostates was significantly decreased (p < 1e-04) in JunPEΔ/Δ;PtenPEΔ/Δprostates. Statistical significance between PtenPEΔ/Δ and JunPEΔ/Δ;PtenPEΔ/Δ groups are indicated in b, d and f
Fig. 6
Fig. 6
Expression of immune cell-attracting chemokines CCL3 and CCL8 correlates with levels of JUN in patient datasets. a-d Principal component analysis (PCA) representation of human PCa illustrating expression levels of JUN, IL1B, CCL3 and CCL8. Expression levels are color coded from high (yellow) to low (blue). e Box plots indicating significant enrichment of ADGRE1 (F4/80, p = 4.10e-02), CCL8 (p = 4.41e-16), IL1B (p = 9.29e-21) and CCL3 (p = 1.35e-26) in JUNhigh and JUNlow separated groups. f Pearson correlation of indicated AP-1 factors, PTEN, CCL3, CCL8, IL1B and ADGRE1. Strength of correlation is color coded. g-i Kaplan–Meier survival analyses of TCGA-PRAD tumors (n = 333) assessing the effect of IL1B (g), CCL3 (h) and CCL8 (i) on RFS in the context of PTEN and JUN. j Correlation of JUN (left) and IL1B (right) expression to amount of phosphorylated STAT3 (pSTAT3Y705) in the TCGA-PRAD cohort (n = 352). k Box plot of reverse-phase protein array (RPPA) data representing reduced levels of pSTAT3Y705 (p = 1.6e-02) in high risk PCa of Gleason scores > 7 (range 8–10) compared to low risk (Gleason scores ≤ 7). l Box plot of RPPA data representing gradually decreasing levels of pSTAT3Y705 (p = 1.8e-02) in PTEN low, medium and high tumors. Dataset used for Fig. 6 is TCGA-PRAD [33]

References

    1. Gandaglia G, Leni R, Bray F, Fleshner N, Freedland SJ, Kibel A, Stattin P, Van Poppel H, La Vecchia C. Epidemiology and Prevention of Prostate Cancer. Eur Urol Oncol. 2021;4:877–892. doi: 10.1016/j.euo.2021.09.006. - DOI - PubMed
    1. Berenguer CV, Pereira F, Câmara JS, Pereira JAM. Underlying Features of Prostate Cancer-Statistics, Risk Factors, and Emerging Methods for Its Diagnosis. Curr Oncol. 2023;30:2300–2321. doi: 10.3390/curroncol30020178. - DOI - PMC - PubMed
    1. Tan ME, Li J, Xu HE, Melcher K, Yong E. Androgen receptor: structure, role in prostate cancer and drug discovery. Acta Pharmacol Sin. 2015;36:3–23. doi: 10.1038/aps.2014.18. - DOI - PMC - PubMed
    1. Jamaspishvili T, Berman DM, Ross AE, Scher HI, De Marzo AM, Squire JA, Lotan TL. Clinical implications of PTEN loss in prostate cancer. Nat Rev Urol. 2018;4:222–234. doi: 10.1038/nrurol.2018.9. - DOI - PMC - PubMed
    1. Feldman BJ, Feldman D. The development of androgen-independent prostate cancer. Nat Rev Cancer. 2001;1:34–45. doi: 10.1038/35094009. - DOI - PubMed

Substances