Comparative Study
. 2024 May 29;14(1):12.
doi: 10.1186/s13395-024-00344-4.

Studying intramuscular fat deposition and muscle regeneration: insights from a comparative analysis of mouse strains, injury models, and sex differences

Affiliations
Comparative Study

Studying intramuscular fat deposition and muscle regeneration: insights from a comparative analysis of mouse strains, injury models, and sex differences

Alessandra M Norris et al. Skelet Muscle. .

Abstract

Intramuscular fat (IMAT) infiltration, pathological adipose tissue that accumulates between muscle fibers, is a shared hallmark in a diverse set of diseases including muscular dystrophies and diabetes, spinal cord and rotator cuff injuries, as well as sarcopenia. While the mouse has been an invaluable preclinical model to study skeletal muscle diseases, they are also resistant to IMAT formation. To better understand this pathological feature, an adequate pre-clinical model that recapitulates human disease is necessary. To address this gap, we conducted a comprehensive in-depth comparison between three widely used mouse strains: C57BL/6J, 129S1/SvlmJ and CD1. We evaluated the impact of strain, sex and injury type on IMAT formation, myofiber regeneration and fibrosis. We confirm and extend previous findings that a Glycerol (GLY) injury causes significantly more IMAT and fibrosis compared to Cardiotoxin (CTX). Additionally, females form more IMAT than males after a GLY injury, independent of strain. Of all strains, C57BL/6J mice, both females and males, are the most resistant to IMAT formation. In regard to injury-induced fibrosis, we found that the 129S strain formed the least amount of scar tissue. Surprisingly, C57BL/6J of both sexes demonstrated complete myofiber regeneration, while both CD1 and 129S1/SvlmJ strains still displayed smaller myofibers 21 days post injury. In addition, our data indicate that myofiber regeneration is negatively correlated with IMAT and fibrosis. Combined, our results demonstrate that careful consideration and exploration are needed to determine which injury type, mouse model/strain and sex to utilize as preclinical model especially for modeling IMAT formation.


Conflict of interest statement

The authors declare no competing interests.

Figures
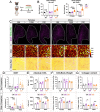
Fig. 1
Fig. 1
Comparison of IMAT, myofiber size and collagen deposition between mouse strains and sex during muscle homeostasis. A Experimental outline. B Body weights (g) of male (M) and female (F) mice from C57BL/6J (Bl6), 129S1/SvlmJ (129S) & CD1 strains at 10 weeks of age. Data are grouped to compare between sexes within the same strain (Left); and within the same sex (Right). C Top: Immunofluorescence of Tibialis Anterior muscles (TAs) of uninjured Bl6, 129S & CD1 females and males to visualize PERILIPIN+ adipocytes (green). Nuclei are marked by DAPI (magenta). Scale bar: 500 µm. Middle: Individual muscle fibers, stained by PHALLOIDIN and false color-coded according to size (µm2). Scale bar: 250 µm. Bottom: Collagen deposition (red) is detected by the histological stain Sirius Red. Scale bar: 250 µm. D Quantification of IMAT normalized to area of uninjured TA (adipocytes/mm2). E Average cross-sectional area (CSA) of total myofibers (µm2). F Average CSA of total myofibers normalized to body weight (µm2/g). G Quantification of area occupied by collagen deposition normalized to total TA area (%). D-G Top: Data are grouped to compare between sexes within the same strain. Bottom: Data are grouped to compare between strains within the same sex. All data are represented as mean ± SEM. An unpaired two-tailed t test or a one-way ANOVA followed by a Dunnet’s multiple comparison was used. A p value less than 0.05 was considered statistically significant where: * p ≤ 0.05, ** p ≤ 0.01, *** p ≤ 0.001 and **** p ≤ 0.0001
Fig. 2
Fig. 2
IMAT infiltration post injury differs between strains, sexes, and injury types. A Experimental outline. B Immunofluorescence of mature adipocytes (PERILIPIN+ cells; green) 21 days post injury (dpi) with Cardiotoxin (CTX) or Glycerol (GLY), in females (F) and males (M) from C57BL/6J (Bl6), 129S1/SvlmJ (129S) & CD1 mouse strains. Nuclei are visualized through DAPI (magenta). Scale bar: 500 µm. C-E Quantification of adipocytes normalized to injured area (adipocytes/mm.2) 21 days after CTX or GLY injury in male (M) and female (F) Bl6, 129S & CD1 mice. Data are grouped to compare between: C sexes within the same injury and strain; D strains within the same injury and sex; E injuries within the same sex and strain. F Summary model: 129S and CD1 strains have more IMAT than Bl6; GLY induces more IMAT than CTX; and females have more IMAT than males. All data are represented as mean ± SEM. An unpaired two-tailed t test or a one-way ANOVA followed by a Dunnet’s multiple comparison was used. A p value less than 0.05 was considered statistically significant where: * p ≤ 0.05, ** p ≤ 0.01, *** p ≤ 0.001 and **** p ≤ 0.0001
Fig. 3
Fig. 3
Tissue fibrosis is mostly affected by strain and injury type but independent of sex. A Experimental outline. B Collagen deposition (red) of Tibialis Anterior (TA) cross sections was visualized by the histological stain Sirius Red 21 days post Cardiotoxin (CTX) or Glycerol (GLY) injury in C57BL/6J (Bl6), 129S1/SvlmJ (129S) & CD1 female (F) and male (M) mice. Scale bar: 500 µm. C-E Quantification of area occupied by collagen deposition normalized to total TA area (%). Data are grouped to compare between: C sexes within the same injury and strain; D strains within the same injury and sex; E injuries within the same sex and strain. F Summary model: Bl6 and CD1 strains are more fibrotic than 129S; and GLY induces a higher fibrotic response than a CTX model. All data are represented as mean ± SEM. An unpaired two-tailed t test or a one-way ANOVA followed by a Dunnet’s multiple comparison was used. A p value less than 0.05 was considered statistically significant where: * p ≤ 0.05, ** p ≤ 0.01, *** p ≤ 0.001 and **** p ≤ 0.0001
Fig. 4
Fig. 4
Myofiber regeneration is highly strain, sex, and injury dependent. A Experimental outline. B Individual muscle fibers, stained by PHALLOIDIN and false color-coded according to cross-sectional area (CSA; µm2), 21 days post Cardiotoxin (CTX) or Glycerol (GLY) injury in C57BL/6J (Bl6), 129S1/SvlmJ (129S) & CD1 females (F) and males (M). Scale: 500 µm. C-E Average CSA normalized to mouse body weight (µm2/g) 21 days post CTX or GLY injury, in both sexes from BL6, 129S & CD1 mice. Data are grouped to compare between: C sexes within the same injury and mouse strain; D strains within the same sex and injury; E injury model within the same sex and strain. FH Distribution of myofiber size (µm2) as a percentage of total fibers (%) of uninjured muscle, CTX and GLY injured in female: F Bl6, (G) 129S and (H) CD1. C-H Uninjured data was obtained from Fig. 1. I Summary data: the Bl6 strain has the highest regenerative myofiber efficiency. All data are represented as mean ± SEM. An unpaired two-tailed t test or a one-way ANOVA followed by a Dunnet’s multiple comparison was used. A p value less than 0.05 was considered statistically significant where: * p ≤ 0.05, ** p ≤ 0.01, *** p ≤ 0.001 and **** p ≤ 0.0001
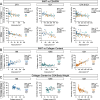
Fig. 5
Fig. 5
IMAT and fibrosis are positively correlated, both impacting myofiber size. Data for IMAT obtained from Fig. 2, Collagen content from Fig. 3 and average CSA/Body weight from Fig. 4. A Correlation between IMAT and CSA/Body weight for every TA, separated by sex and injury model. B Correlation between IMAT formation and collagen content separated by strain. C Correlation between Collagen content and average CSA/Body weight separated by strain. A Pearson correlation test was used
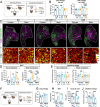
Fig. 6
Fig. 6
A single cross between C57BL/6J and 129S1/SvlmJ increases IMAT formation providing a superior model for studying IMAT. A Breeding and experimental outline. B Body weight (g) of adult, 10-week-old C57BL/6J (Bl6), 129S1/SvlmJ and B6129SF1/J (B/129) males and females. Data are group to compare between: (Left) sex within the same strain; (Right) strains within the same sex. C (Top) Immunofluorescence of adipocytes (PERILIPIN+ cells; green) 21 days post injury (dpi) with Glycerol (GLY) in females (F) and males (M) from Bl6, B/129 & 129S mouse strains. Nuclei were visualized through DAPI (magenta). Scale bar: 500 µm. (Bottom) Muscle fibers were visualized through PHALLOIDIN and color-coded according to their cross-sectional area (CSA; um2). Scale bar: 250 µm. D Quantification of adipocytes normalized to injured area (adipocytes/mm2); and (E) average CSA normalized to body weight (µm2/g) 21 days post GLY injury in Bl6, 129S and B/129 female and male mice. B, D, E Data are grouped to compare between (Left) sexes within the same strain; (Right) strains within the same sex. B-E Data and images for Bl6 and 129S strains were taken from Fig. 1 for body weight, Fig. 2 for IMAT and Fig. 4 for muscle regeneration. F Breeding and experimental outline. G Body weight (g) of adult 10-week-old mixed C57BL/6J (Bl6mix) and mixed N1 progeny (N1mix) females and males. H Quantification of adipocytes normalized to injured area (adipocytes/mm2); I average cross-sectional area (CSA; µm2); and (J) average CSA normalized to body weight (µm2/g) 21 days post GLY injury of Bl6mix and N1mix of both sexes. All data are represented as mean ± SEM. An unpaired two-tailed t test or a one-way ANOVA followed by a Dunnet’s multiple comparison was used. A p value less than 0.05 was considered statistically significant where: * p ≤ 0.05, ** p ≤ 0.01, *** p ≤ 0.001 and **** p ≤ 0.0001

Similar articles

Cited by

References

    1. Metter EJ, Talbot LA, Schrager M, Conwit R. Skeletal Muscle Strength as a Predictor of All-Cause Mortality in Healthy Men. The Journals of Gerontology: Series A. 2002;57(10):B359–B365. - PubMed
    1. Caan BJ, Cespedes Feliciano EM, Prado CM, Alexeeff S, Kroenke CH, Bradshaw P, et al. Association of Muscle and Adiposity Measured by Computed Tomography With Survival in Patients With Nonmetastatic Breast Cancer. JAMA Oncol. 2018;4(6):798–804. doi: 10.1001/jamaoncol.2018.0137. - DOI - PMC - PubMed
    1. Reid KF, Martin KI, Doros G, Clark DJ, Hau C, Patten C, et al. Comparative effects of light or heavy resistance power training for improving lower extremity power and physical performance in mobility-limited older adults. J Gerontol A Biol Sci Med Sci. 2015;70(3):374–380. doi: 10.1093/gerona/glu156. - DOI - PMC - PubMed
    1. Wang H, Hai S, Liu Y, Liu Y, Dong B. Skeletal Muscle Mass as a Mortality Predictor among Nonagenarians and Centenarians: A Prospective Cohort Study. Sci Rep. 2019;9(1):2420. doi: 10.1038/s41598-019-38893-0. - DOI - PMC - PubMed
    1. Arora H, Willcocks RJ, Lott DJ, Harrington AT, Senesac CR, Zilke KL, et al. Longitudinal timed function tests in Duchenne muscular dystrophy: ImagingDMD cohort natural history. Muscle Nerve. 2018;58(5):631–638. doi: 10.1002/mus.26161. - DOI - PMC - PubMed

Publication types

LinkOut - more resources