

Effects of transcranial direct current stimulation on brain activity and cortical functional connectivity in children with autism spectrum disorders
- PMID: 38812483
- PMCID: PMC11135472
- DOI: 10.3389/fpsyt.2024.1407267
Effects of transcranial direct current stimulation on brain activity and cortical functional connectivity in children with autism spectrum disorders
Abstract
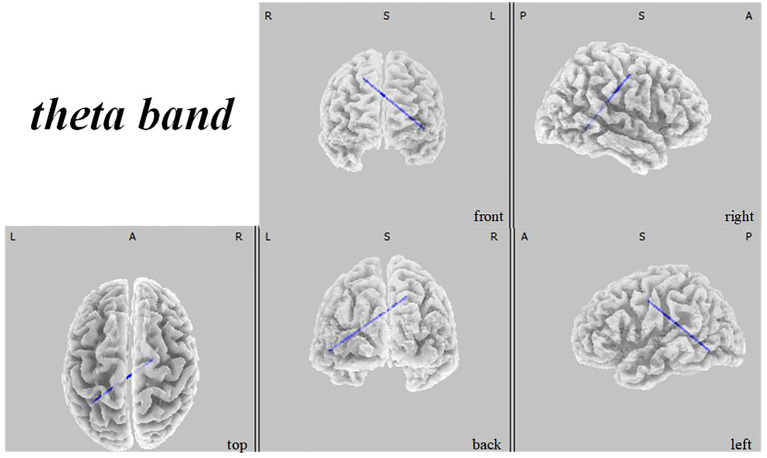
Introduction: Transcranial direct current stimulation (tDCS) has emerged as a therapeutic option to mitigate symptoms in individuals with autism spectrum disorder (ASD). Our study investigated the effects of a two-week regimen of tDCS targeting the left dorsolateral prefrontal cortex (DLPFC) in children with ASD, examining changes in rhythmic brain activity and alterations in functional connectivity within key neural networks: the default mode network (DMN), sensorimotor network (SMN), and dorsal attention network (DAN).
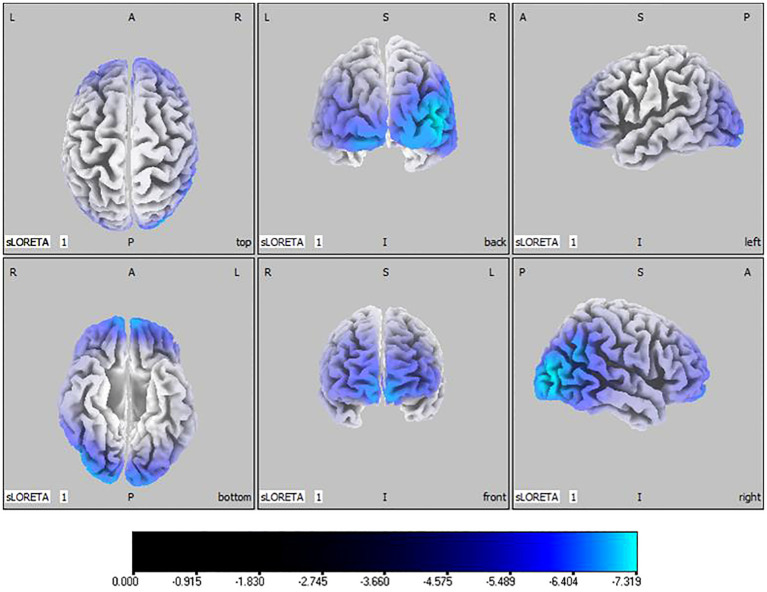
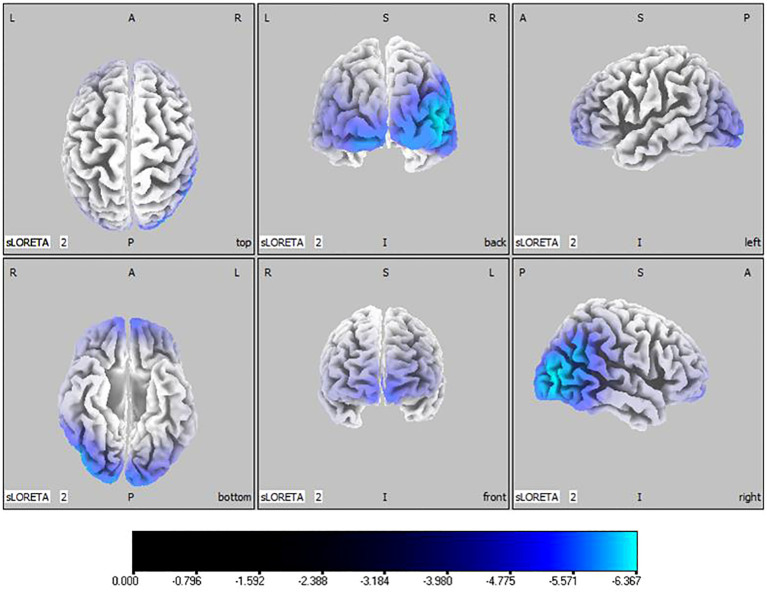
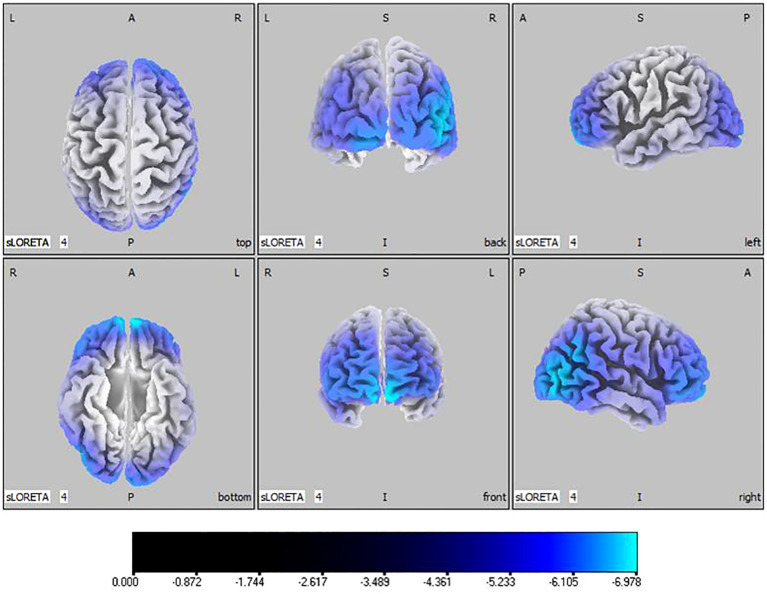
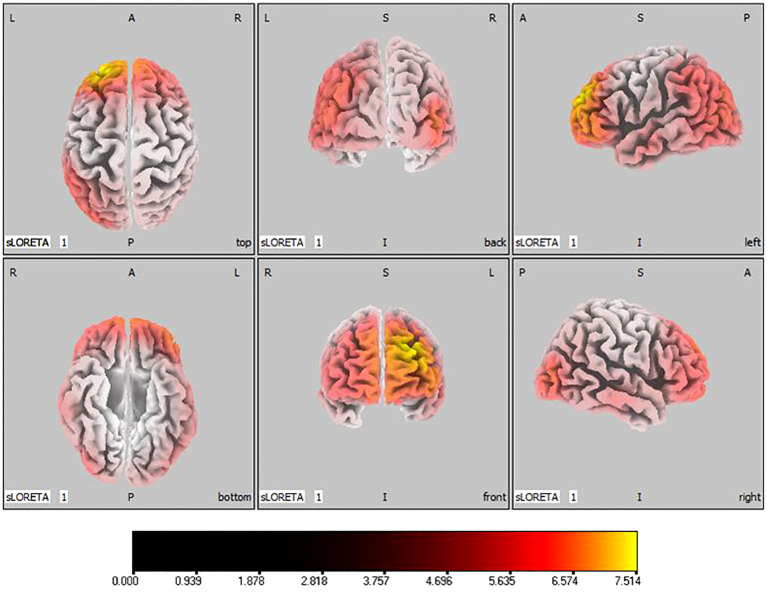
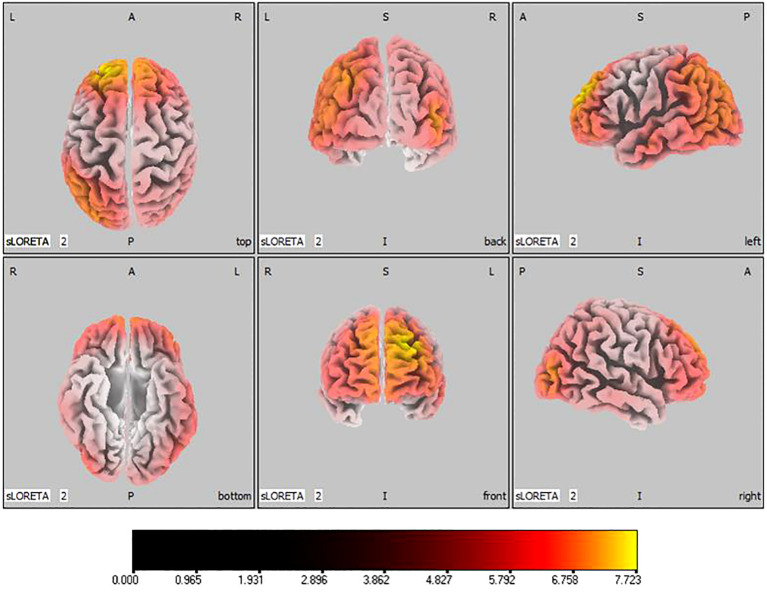
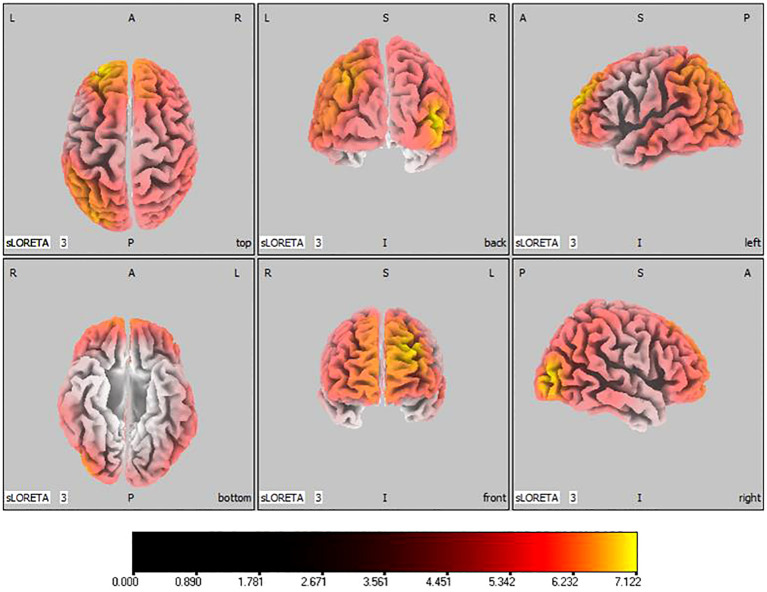
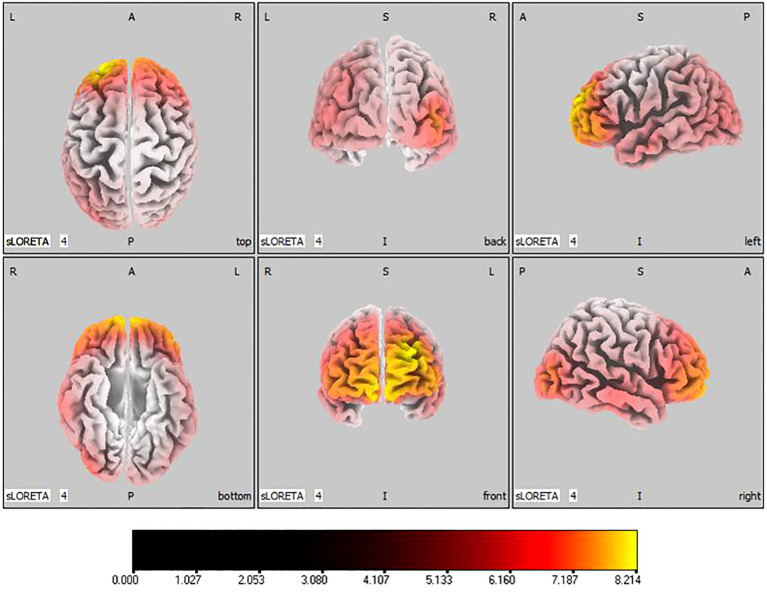
Methods: We enrolled twenty-six children with ASD and assigned them randomly to either an active stimulation group (n=13) or a sham stimulation group (n=13). The active group received tDCS at an intensity of 1mA to the left DLPFC for a combined duration of 10 days. Differences in electrical brain activity were pinpointed using standardized low-resolution brain electromagnetic tomography (sLORETA), while functional connectivity was assessed via lagged phase synchronization.
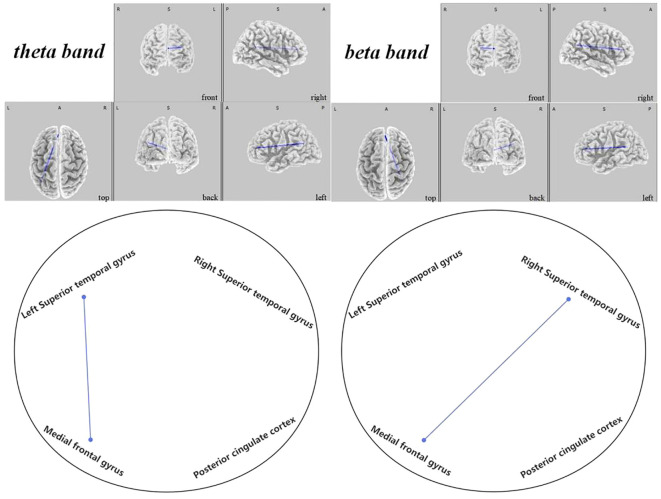
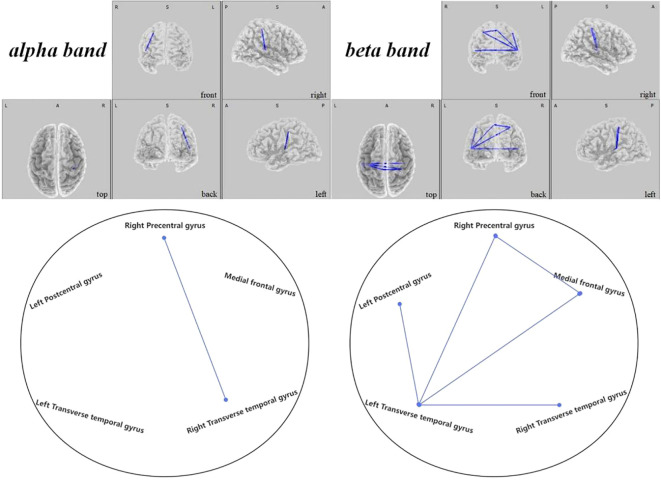
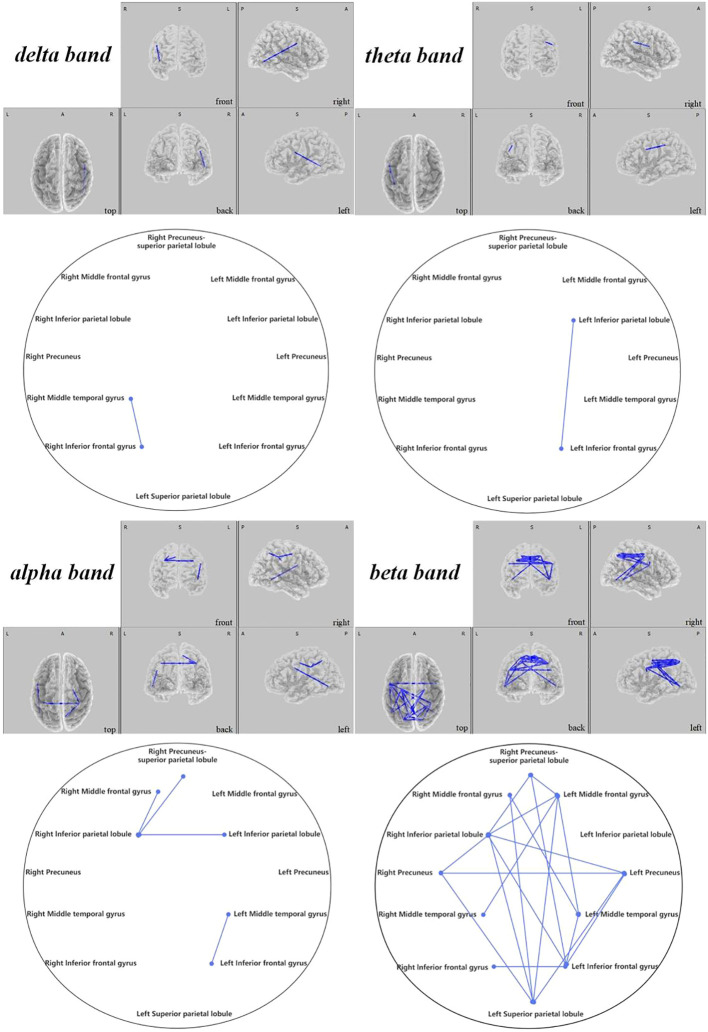
Results: Compared to the typically developing children, children with ASD exhibited lower current source density across all frequency bands. Post-treatment, the active stimulation group demonstrated a significant increase in both current source density and resting state network connectivity. Such changes were not observed in the sham stimulation group.
Conclusion: tDCS targeting the DLPFC may bolster brain functional connectivity in patients with ASD, offering a substantive groundwork for potential clinical applications.
Keywords: autism spectrum disorder; electroencephalogram; lagged phase synchronization; sLORETA; transcranial direct current stimulation.
Copyright © 2024 Kang, Li, Lv, Hao and Li.
Conflict of interest statement
The authors declare that the research was conducted in the absence of any commercial or financial relationships that could be construed as a potential conflict of interest.
Figures

Similar articles
-
The impact of prefrontal transcranial direct current stimulation (tDCS) on theory of mind, emotion regulation and emotional-behavioral functions in children with autism disorder: A randomized, sham-controlled, and parallel-group study.Autism Res. 2022 Oct;15(10):1985-2003. doi: 10.1002/aur.2803. Epub 2022 Sep 7. Autism Res. 2022. PMID: 36069668 Clinical Trial.
-
TDCS Modulates Brain Functional Networks in Children with Autism Spectrum Disorder: A Resting-State EEG Study.J Integr Neurosci. 2025 Mar 18;24(3):27314. doi: 10.31083/JIN27314. J Integr Neurosci. 2025. PMID: 40152572
-
EEG resting-state functional connectivity: evidence for an imbalance of external/internal information integration in autism.J Neurodev Disord. 2022 Aug 27;14(1):47. doi: 10.1186/s11689-022-09456-8. J Neurodev Disord. 2022. PMID: 36030210 Free PMC article.
-
Transcranial direct current stimulation modulates brain functional connectivity in autism.Neuroimage Clin. 2020;28:102500. doi: 10.1016/j.nicl.2020.102500. Epub 2020 Nov 19. Neuroimage Clin. 2020. PMID: 33395990 Free PMC article.
-
Brain stimulation by tDCS as treatment option in Autism Spectrum Disorder-A systematic literature review.Prog Brain Res. 2021;264:233-257. doi: 10.1016/bs.pbr.2021.03.002. Epub 2021 Apr 16. Prog Brain Res. 2021. PMID: 34167658
Cited by
-
Neural Correlates of Alexithymia Based on Electroencephalogram (EEG)-A Mechanistic Review.J Clin Med. 2025 Mar 11;14(6):1895. doi: 10.3390/jcm14061895. J Clin Med. 2025. PMID: 40142703 Free PMC article. Review.
-
Understanding and targeting repetitive behaviors and restricted interests in autism spectrum disorder via high-definition transcranial direct current stimulation: a study-protocol.BMC Psychiatry. 2025 Feb 25;25(1):170. doi: 10.1186/s12888-025-06506-y. BMC Psychiatry. 2025. PMID: 40001028 Free PMC article.
References
-
- Maenner MJ, Shaw KA, Baio J, Washington A, Dietz PM. Prevalence of autism spectrum disorder among children aged 8 years-autism and developmental disabilities monitoring network, 11 sites, United States, 2016. MMWR Surveillance summaries: Morbid mortal week Rep Surveillance summaries / CDC. (2020) 69:1–12. doi: 10.15585/mmwr.ss6706a - DOI - PMC - PubMed
-
- Aksu S, Uslua I, Scen P, Barham H, Bilgic B, Hanagasi H, et al. . Does transcranial direct current stimulation enhance cognitive performance in Parkinson’s disease mild cognitive impairment? An event-related potentials and neuro psychological assessment study. Neurol Sci. (2022) 43:4029–44. doi: 10.1007/s10072-022-06020-z - DOI - PubMed
-
- Rajji TK, Bowie CR, Herrmann N, Pollock BG, Bikson M, Blumberger DM, et al. . Design and rationale of the PACt-MD randomized clinical trial: prevention of Alzheimer’s dementia with cognitive remediation plus transcranial direct current stimulation in mild cognitive impairment and depression. J Alzheimers Dis. (2020) 76:733–51. doi: 10.3233/JAD-200141 - DOI - PubMed
LinkOut - more resources
Full Text Sources
Miscellaneous