. 2024 May 15:15:1386517.
doi: 10.3389/fimmu.2024.1386517. eCollection 2024.

Ex vivo characterization of acute myeloid leukemia patients undergoing hypomethylating agents and venetoclax regimen reveals a venetoclax-specific effect on non-suppressive regulatory T cells and bona fide PD-1+TIM3+ exhausted CD8+ T cells

Affiliations

Ex vivo characterization of acute myeloid leukemia patients undergoing hypomethylating agents and venetoclax regimen reveals a venetoclax-specific effect on non-suppressive regulatory T cells and bona fide PD-1+TIM3+ exhausted CD8+ T cells

Giulia Corradi et al. Front Immunol. .

Abstract

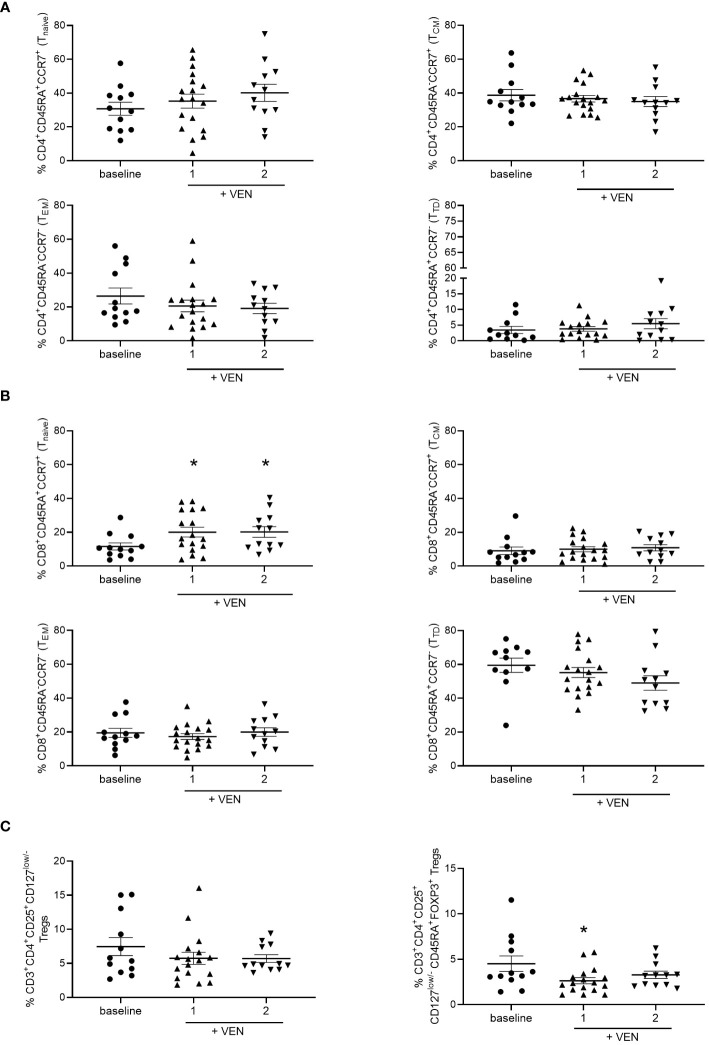
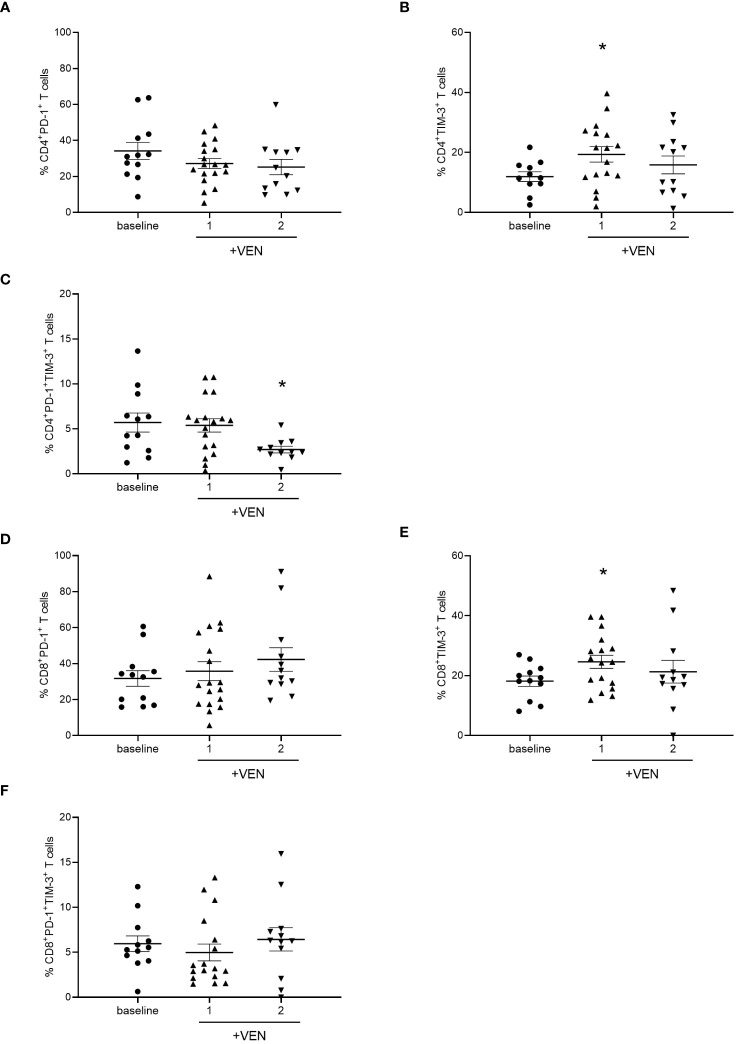
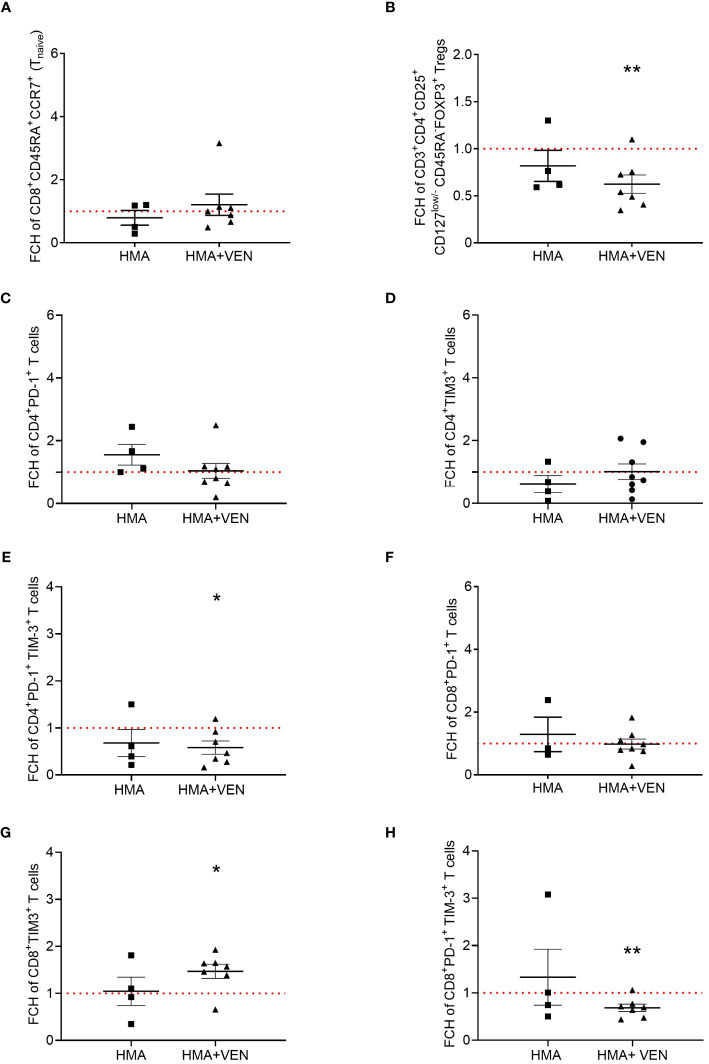
Acute myeloid leukemia (AML) is an aggressive heterogeneous disease characterized by several alterations of the immune system prompting disease progression and treatment response. The therapies available for AML can affect lymphocyte function, limiting the efficacy of immunotherapy while hindering leukemia-specific immune reactions. Recently, the treatment based on Venetoclax (VEN), a specific B-cell lymphoma 2 (BCL-2) inhibitor, in combination with hypomethylating agents (HMAs) or low-dose cytarabine, has emerged as a promising clinical strategy in AML. To better understand the immunological effect of VEN treatment, we characterized the phenotype and immune checkpoint (IC) receptors' expression on CD4+ and CD8+ T cells from AML patients after the first and second cycle of HMA in combination with VEN. HMA and VEN treatment significantly increased the percentage of naïve CD8+ T cells and TIM-3+ CD4+ and CD8+ T cells and reduced cytokine-secreting non-suppressive T regulatory cells (Tregs). Of note, a comparison between AML patients treated with HMA only and HMA in combination with VEN revealed the specific contribution of VEN in modulating the immune cell repertoire. Indeed, the reduction of cytokine-secreting non-suppressive Tregs, the increased TIM-3 expression on CD8+ T cells, and the reduced co-expression of PD-1 and TIM-3 on both CD4+ and CD8+ T cells are all VEN-specific. Collectively, our study shed light on immune modulation induced by VEN treatment, providing the rationale for a novel therapeutic combination of VEN and IC inhibitors in AML patients.

Keywords: acute myeloid leukemia; hypomethylating agents; immune checkpoint inhibitors (ICIs); immune checkpoints receptors; immune system; venetoclax.


Conflict of interest statement

The authors declare that the research was conducted in the absence of any commercial or financial relationships that could be construed as a potential conflict of interest.

Figures

Figure 1
Figure 1
Distribution of T cell subsets during HMA plus VEN treatment. All the samples were analyzed by flow cytometry and data are represented as mean ± SEM. (A) CD4+ T cell subsets. Frequencies of CD45RA+/CCR7+ cells (naïve=N, upper left panel), CD45RA-/CCR7+ cells (central memory=CM, upper right panel); CD45RA-/CCR7- cells (effector memory=EM, lower left panel), CD45RA+/CCR7- cells (terminally differentiated=TD, lower right panel). Baseline, at least n=11; cycle 1 at least, n=16; cycle 2, n=12. (B) CD8+ T cell subsets. Cells were analyzed as described for A). Baseline, at least n=11; cycle 1, at least n=17; cycle 2, n=12. For naïve CD8+ T cells (upper left panel): baseline vs cycle 1, *P=0.037; baseline vs cycle 2, *P=0.034. (C) Frequencies of Tregs (CD3+CD4+CD25+CD127low/- cells) before treatment (n=12), after first (n=17), and second (n=12) cycle of HMA plus VEN (left panel). Frequencies of cytokine secreting non-suppressive Tregs (CD45RA-CD25highFOXP3+ cells; right panel) within the CD3+CD4+CD25+CD127low/- Treg population, expressed as a percentage of CD4+ cells, in patients before treatment (baseline, n=12), after first (n=17), and second (n=12) cycle of HMA plus VEN; baseline vs cycle 1 *P=0.041.
Figure 2
Figure 2
Analysis of ICs on T cells during HMA plus VEN treatment. All the samples were analyzed by flow cytometry and data are represented as mean ± SEM. (A) Percentage of CD4+PD-1+ T cells before treatment (n=12), after first (n=18), and second (n=12) cycle of HMA plus VEN. (B) Percentage of CD4+ TIM-3+ T cells before treatment (n=12), after first (n=17) and second (n=12) cycle of HMA plus VEN (baseline vs cycle 1, *P=0.041. (C) Percentage of PD-1+/TIM-3+ CD4+ T cells before treatment (n=12), after first (n=18), and second (n=11) cycle of HMA plus VEN, baseline vs cycle 1, *P=0.017. (D) Percentage of CD8+PD-1+ T cells before treatment (n=12), after first (n=18), and second (n=12) cycle of HMA plus VEN. (E) Percentage of CD8+ TIM-3+ T cells before treatment (n=12), after first (n=17), and second (n=12) cycle of HMA plus VEN. Baseline vs cycle 1, *P=0.039. (F) Percentage of PD-1+/TIM-3+ CD8+ T cells before treatment (n=12), after first (n=17), and second (n=12) cycle of HMA plus VEN.
Figure 3
Figure 3
Expression of CD244 and CD57 on CD8+ T cells during HMA plus VEN treatment. All the samples were analyzed by flow cytometry and data are represented as mean ± SEM. (A) Percentage of CD8+CD244+ T cells before treatment (n=12), after first (n=18), and second (n=12) cycle of HMA plus VEN. (B) Percentage of CD8+ CD57+ T cells before treatment (n=12), after first (n=18), and second (n=12) cycle of HMA plus VEN.
Figure 4
Figure 4
Analysis of pair-matched patients. All the samples were collected from patients during only 1 cycle of HMA (grey) or 1 cycle of HMA plus VEN treatment (black), and were analyzed by flow cytometry. Fold change percentages (FCH) were calculated normalizing the baseline value to 1 shown as the red line (cycle 1/baseline), and data are represented as mean ± SEM. (A) FCH of CD45RA+/CCR7+ cells (naïve) CD8+ T cells before and after first treatment cycle (HMA, n=4; HMA plus VEN, n=7). (B) FCH of cytokine secreting non-suppressive Tregs (CD45RA-FOXP3+ cells) within the CD3+CD4+CD25+CD127low/- Treg population, expressed as a percentage of total CD4+ T cells (HMA, n=4; HMA plus VEN, n=7; baseline vs cycle 1 HMA plus VEN, **P=0.008). (C) FCH of CD4+PD-1+ T cells before and after first treatment cycle (HMA, n=4; HMA plus VEN, n=8). (D) FCH of CD4+ TIM-3+ T cells before and after first treatment cycle (HMA, n=4; HMA plus VEN, n=8). (E) FCH of CD4+ PD-1+TIM-3+ T cells before and after first treatment cycle (HMA, n=4; HMA plus VEN, n=7; baseline vs cycle 1 HMA plus VEN, *P=0.025). (F) FCH of CD8+PD-1+ T cells before and after first treatment cycle (HMA, n=3; HMA plus VEN, n=8). (G) FCH of CD8+TIM-3+ T cells before and after first treatment cycle (HMA, n=4; HMA plus VEN, n=7; baseline vs cycle 1 HMA plus VEN, *P=0.020). (H) FCH of CD8+PD-1+TIM-3+ T cells before and after first treatment cycle (HMA, n=4; HMA plus VEN, n=7; baseline vs cycle 1 HMA plus VEN, **P=0.007).

Similar articles

Cited by

References

    1. Ferrara F, Lessi F, Vitagliano O, Birkenghi E, Rossi G. Current therapeutic results and treatment options myeloid leukemia. Cancers (Basel). (2019) 2):11–224. doi: 10.3390/cancers11020224 - DOI - PMC - PubMed
    1. Daver N, Wei AH, Pollyea DA, Fathi AT, Vyas P, Dinardo CD. New directions for emerging therapies in acute myeloid leukemia : the next chapter. Blood Cancer J. (2020) 10:1–12. doi: 10.1038/s41408-020-00376-1 - DOI - PMC - PubMed
    1. Wang X, Zheng J, Liu J, Yao J, He Y, Li X, et al. . Increased population of CD4 + CD25 high regulatory T cells with their higher apoptotic and proliferating status in peripheral blood of acute myeloid leukemia patients. Eur J Haematol. (2005) 75:468–76. doi: 10.1111/j.1600-0609.2005.00537.x - DOI - PubMed
    1. Szczepanski MJ, Szajnik M, Czystowska M, Mandapathil M, Strauss L, Welsh A, et al. . Increased frequency and suppression by regulatory T cells in patients with acute myelogenous leukemia. Clinical Cancer Research (2009) 15(13):3325–32. doi: 10.1158/1078-0432.CCR-08-3010 - DOI - PMC - PubMed
    1. Corradi G, Bassani B, Simonetti G, Sangaletti S, Vadakekolathu J, Fontana MC, et al. . Release of IFN g by acute myeloid leukemia cells remodels bone marrow immune microenvironment by inducing regulatory T cells. Clin Cancer Res. (2022) 28:3141–55. doi: 10.1158/1078-0432.CCR-21-3594 - DOI - PubMed

MeSH terms