. 2024 May 15:15:1364979.
doi: 10.3389/fimmu.2024.1364979. eCollection 2024.

The prognostic implications and tumor-promoting functions of CHSY3 in gastric cancer

Affiliations

The prognostic implications and tumor-promoting functions of CHSY3 in gastric cancer

Han Wang et al. Front Immunol. .

Abstract

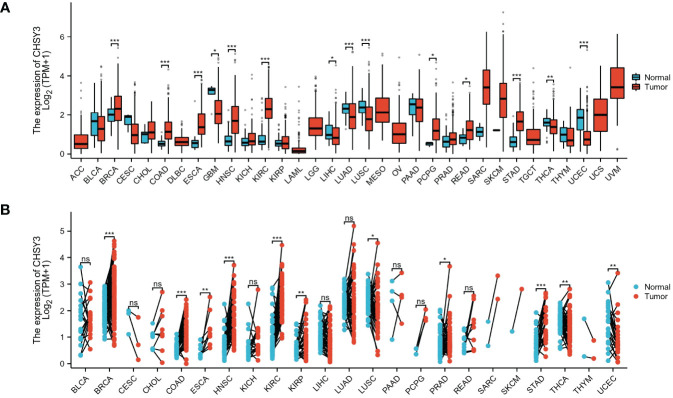
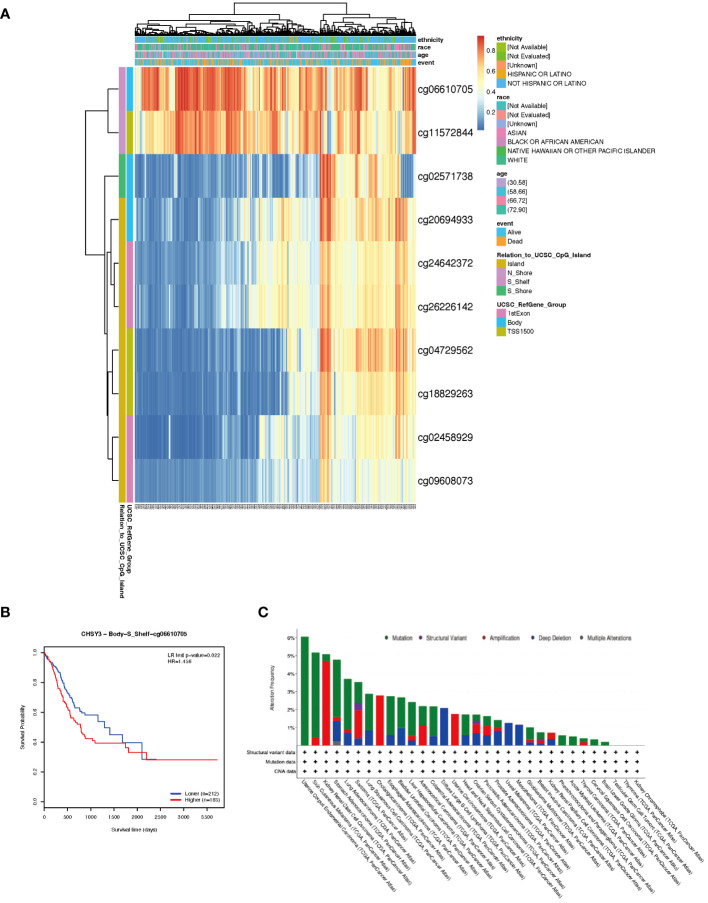
Chondroitin sulfate synthase 3 (CHSY3) is an important enzyme that regulates glycosylation, but its role in tumors has not been determined. Here, we showed that high CHSY3 expression promotes proliferation in gastric cancer (GC) cells and is associated with poor prognosis in GC patients. We analyzed the immunohistochemistry data of 150 gastric cancer patients to determine the clinicopathological and survival significance of CHSY3. Immunofluorescence was used to detect the colocalization of CHSY3 with infiltrating immune cells. Additionally, CHSY3 was predominantly found in tumor tissues and showed higher abundance compared to matched adjacent tissues. High CHSY3 expression was associated with more advanced tumor stage, higher recurrence risk and worse survival. Immunohistochemistry and bioinformatic analysis revealed that CHSY3 expression was significantly positively correlated with tumor-associated macrophage (TAM) infiltration. Moreover, after knocking down CHSY3, the proliferation of cells was decreased, and the migration ability was reduced, as shown by scratch, monoclonal and transwell assays. In conclusion, this study revealed that CHSY3 has a tumor-promoting effect on GC, suggesting a novel therapeutic strategy against this disease.

Keywords: CHSY3; gastric cancer; prognosis; tumor immune microenvironment; tumor-associated macrophages.


Conflict of interest statement

The authors declare that the research was conducted in the absence of any commercial or financial relationships that could be construed as a potential conflict of interest.

Figures

Figure 1
Figure 1
The pancancer mRNA expression of CHSY3. (A) The mRNA expression of CHSY3 in 33 tumors in the TCGA database. (B) Expression of CHSY3 in paired samples of 23 tumors in the TCGA database. ACC, adrenocortical carcinoma; BLCA, bladder urothelial carcinoma; BRCA, breast invasive carcinoma; CESC, cervical and endocervical cancers; CHOL, cholangiocarcinoma; COAD, colon adenocarcinoma; DLBC, lymphoid neoplasm diffuse large B-cell lymphoma; ESCA, esophageal carcinoma; GBM, glioblastoma multiforme; HNSC, head and neck squamous cell carcinoma; KICH, kidney chromophobe; KIRC, kidney renal clear cell carcinoma; KIRP, kidney renal papillary cell carcinoma; LAML, acute myeloid leukemia; LGG, brain lower grade glioma; LIHC, liver hepatocellular carcinoma; LUAD, lung adenocarcinoma; LUSC, lung squamous cell carcinoma; MESO, mesothelioma; OV, ovarian serous cystadenocarcinoma; PAAD, pancreatic adenocarcinoma; PCPG, pheochromocytoma and paraganglioma; PRAD, prostate adenocarcinoma; READ, rectum adenocarcinoma; SARC, sarcoma; SKCM, skin cutaneous melanoma; STAD, stomach adenocarcinoma; STES, stomach and esophageal carcinoma; TGCT, testicular germ cell tumor; THCA, thyroid carcinoma; THYM, thymoma; UCEC, uterine corpus endometrial carcinoma; UCS, uterine carcinosarcoma; UVM, uveal melanoma. (ns, p > 0.05; *p < 0.05; **p < 0.01; ***p < 0.001).
Figure 2
Figure 2
The expression profile of CHSY3 in gastric cancer. (A) Increased CHSY3 in gastric cancer tissues compared with normal tissues in the TCGA database. (B) Increased CHSY3 expression in gastric cancer tissue compared with matched normal tissue from the TCGA database (n = 27). (C) The ROC curve analysis of CHSY3 in GC patients. (D, E) High CHSY3 expression was correlated with poor OS and DSS in GC patients according to data from the TCGA database. (F) High CHSY3 expression was correlated with poor OS in GC patients according to the Kaplan–Meier plotter database. * P < 0.05, **P < 0.01, ***P < 0.001. (G) The mRNA level of CHSY3 in 7 pairs of GC cases and their corresponding adjacent normal tissues. (H) Western blotting was performed to detect the protein level of CHSY3 in 7 pairs of GC cases and their corresponding adjacent normal tissues.
Figure 3
Figure 3
Genes co-expressed with CHSY3 in STAD were analyzed via the LinkedOmics database. (A) All genes significantly associated with CHSY3 were identified by Pearson correlation in the STAD cohort. (B, C) The top 50 genes positively and negatively related to CHSY3 in STAD are shown by heatmaps. Red represents positively linked genes, and blue represents negatively linked genes. (D, E) GO annotations and KEGG pathways associated with CHSY3 in the STAD cohort.
Figure 4
Figure 4
Correlations between CHSY3 expression and immune cell infiltration. (A) Relationships between CHSY3 expression and the infiltration levels of NK cells, macrophages, B cells, CD4+ T cells, CB8+ T cells, neutrophils, and dendritic cells in human cancers. (B) Relationship between the high/low expression of CHSY3 and immune cells infiltration. (C) mIHC staining demonstrating the colocalization of CHSY3 (red) with macrophages (green). (D, E) Heatmaps of the correlations between CHSY3 expression and NK cells and macrophages in the TIMER2 database. *p < 0.05, **p < 0.01, ***p < 0.001.
Figure 5
Figure 5
Correlation of CHSY3 expression with immune infiltration level in STAD. (A) The CHSY3 expression level was significantly correlated with the infiltration of B cells (r = −0.071, p = 0.172), CD8+ T cells (r = 0.097, p = 0.062), CD4+ T cells (r =0.302, p = 0.000), macrophages (r = 0.533, p = 0.000), neutrophils (r = 0.224, p = 0.000) and DCs (r = 0.347, p = 0.000) in patients with STAD. (B) Cumulative survival was related to B cells (p = 0.786), CD8+ T cells (p = 0.554), CD4+ T cells (p = 0.23), macrophages (p = 0.004), neutrophils (p = 0.436) and DCs (p = 0.011) in patients with STAD. (C) Scatterplots of the correlations between CHSY3 expression and the gene markers of TAMs and M1 and M2 macrophages in STAD.
Figure 6
Figure 6
CHSY3 promotes the malignant properties of GC progression (A) WB was used to verify the efficiency of the shRNAs. (B) Wound healing assays indicated that CHSY3 knockdown could restrain the migration of GC cells. (C) Transwell assays showed that CHSY3 knockdown inhibited the migration of GC cells. (D) Colony formation assays were used to evaluate the effect of CHSY3 knockdown on the growth of AGS cells. (E) IF analysis of the relative expression of Ki-67 in CHSY3-knockdown cells. *p < 0.05, **p < 0.01, ***p < 0.001.
Figure 7
Figure 7
The expression and prognostic value of CHSY3 in gastric cancer (A) Gastric cancer tissue was quantified by scoring the staining intensity, which included negative (–) and weak (+) staining and moderate (++) and strong (+ + +) staining. Scale bar = 100 mm. (B-C) High CHSY3 expression was correlated with poor OS and DFS in GC patients.
Figure 8
Figure 8
DNA methylation analysis and mutation features of CHSY3 in cancers. (A) DNA methylation of CHSY3 in STAD samples from the TCGA. (B) Prognostic value of a single CpG in the CHSY3 gene in STAD. The threshold of significance was an LR test p value <0.05. cg06610705 of CHSY3 indicates a significant level of DNA methylation in STAD. (C) The alteration frequency and mutation type of CHSY3 (https://www.cbioportal.org/).

Similar articles

Cited by

References

    1. Smyth EC, Nilsson M, Grabsch HI, van Grieken NC, Lordick F. Gastric cancer. Lancet (London England). (2020) 396:635–48. doi: 10.1016/S0140-6736(20)31288-5 - DOI - PubMed
    1. Yuan Z, Cui H, Xu Q, Gao J, Liang W, Cao B, et al. . Total versus proximal gastrectomy for proximal gastric cancer after neoadjuvant chemotherapy: a multicenter retrospective propensity score-matched cohort study. Int J Surg. (2023) 110(2):1000–7. doi: 10.1097/JS9.0000000000000927 - DOI - PMC - PubMed
    1. Park J, Hsueh P-C, Li Z, Ho P-C. Microenvironment-driven metabolic adaptations guiding CD8(+) T cell anti-tumor immunity. Immunity. (2023) 56:32–42. doi: 10.1016/j.immuni.2022.12.008 - DOI - PubMed
    1. Rui R, Zhou L, He S. Cancer immunotherapies: advances and bottlenecks. Front Immunol. (2023) 14:1212476. doi: 10.3389/fimmu.2023.1212476 - DOI - PMC - PubMed
    1. Vu LD, Gevaert K, De Smet I. Protein language: post-translational modifications talking to each other. Trends Plant Sci. (2018) 23:1068–80. doi: 10.1016/j.tplants.2018.09.004 - DOI - PubMed