. 2024 May 15:15:1373537.
doi: 10.3389/fimmu.2024.1373537. eCollection 2024.

Tissue-specific sex differences in pediatric and adult immune cell composition and function

Affiliations

Tissue-specific sex differences in pediatric and adult immune cell composition and function

Mahina Tabassum Mitul et al. Front Immunol. .

Abstract

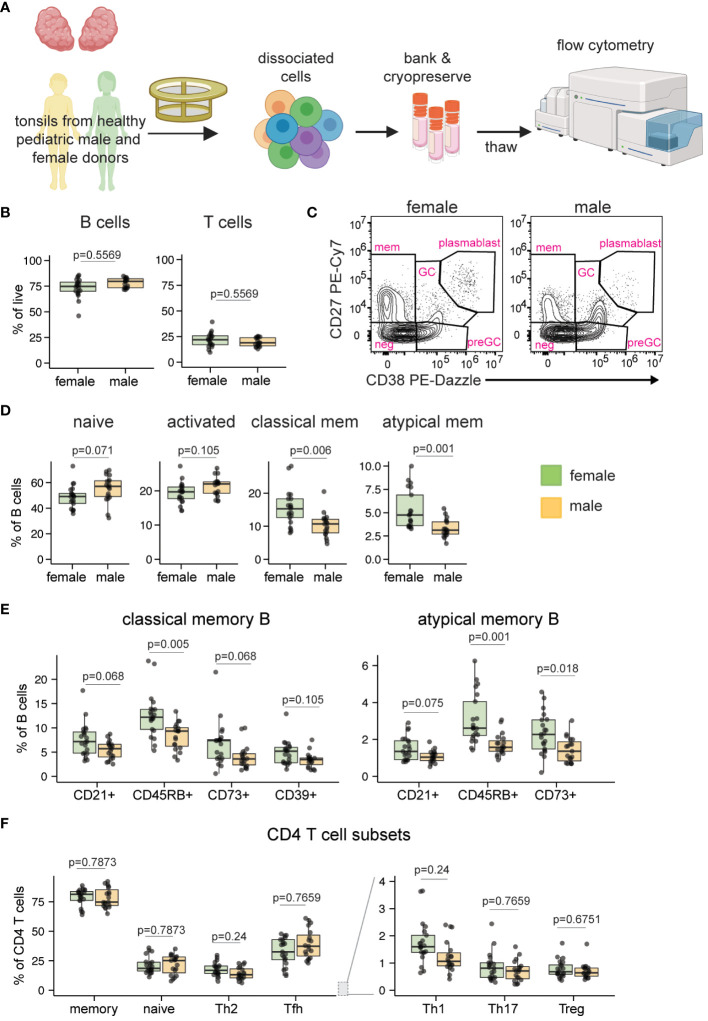
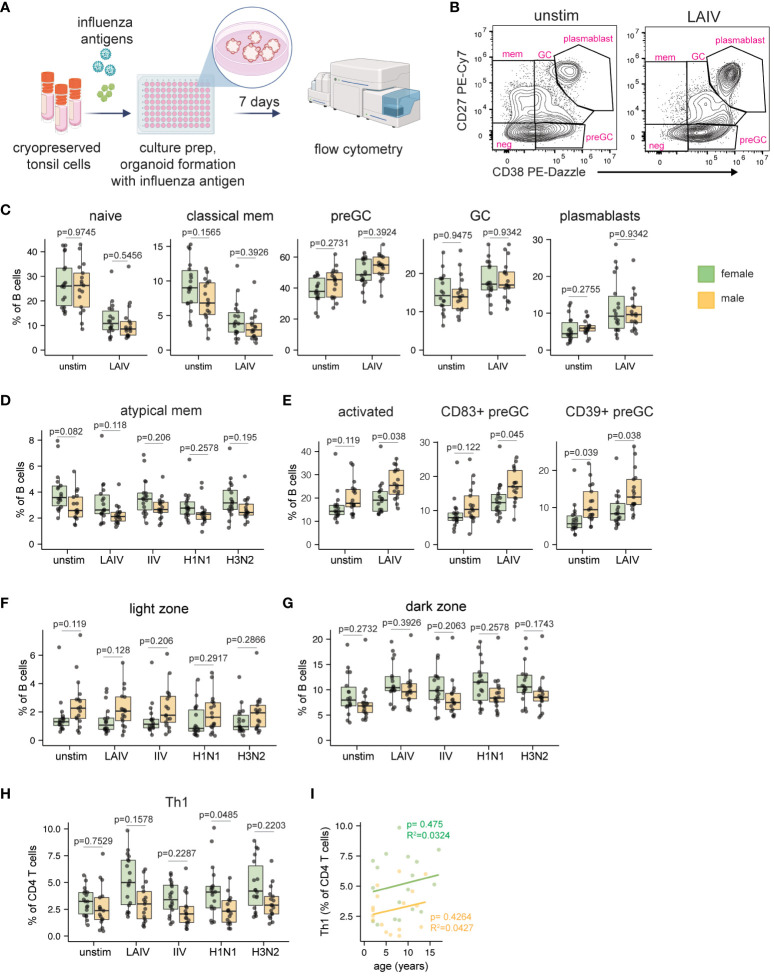
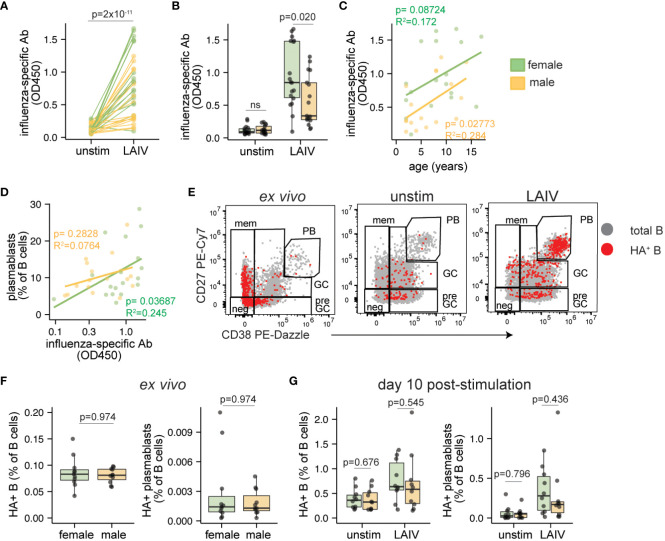
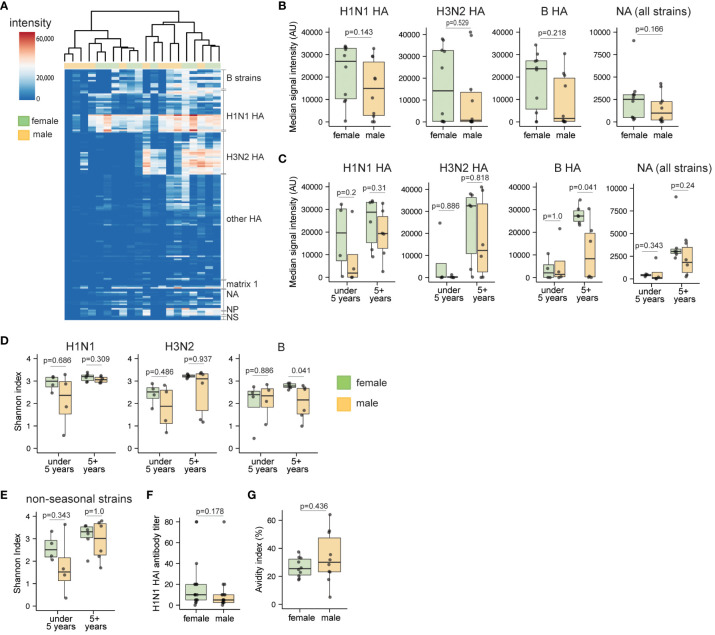
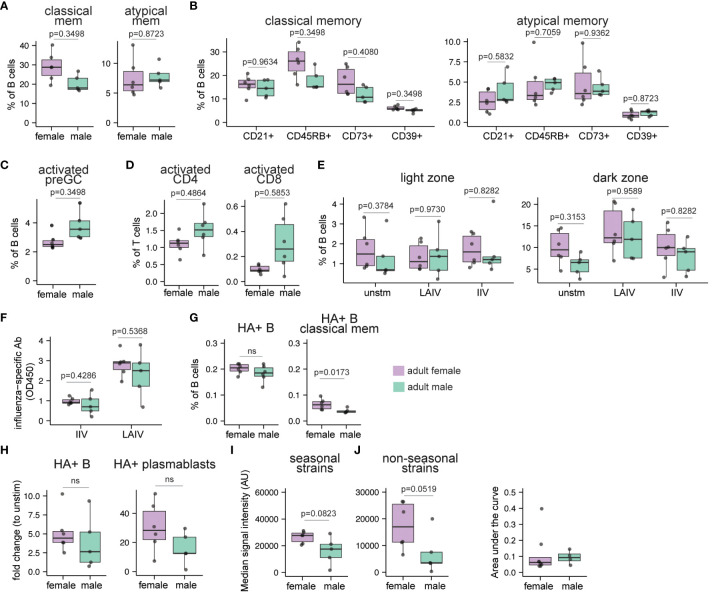
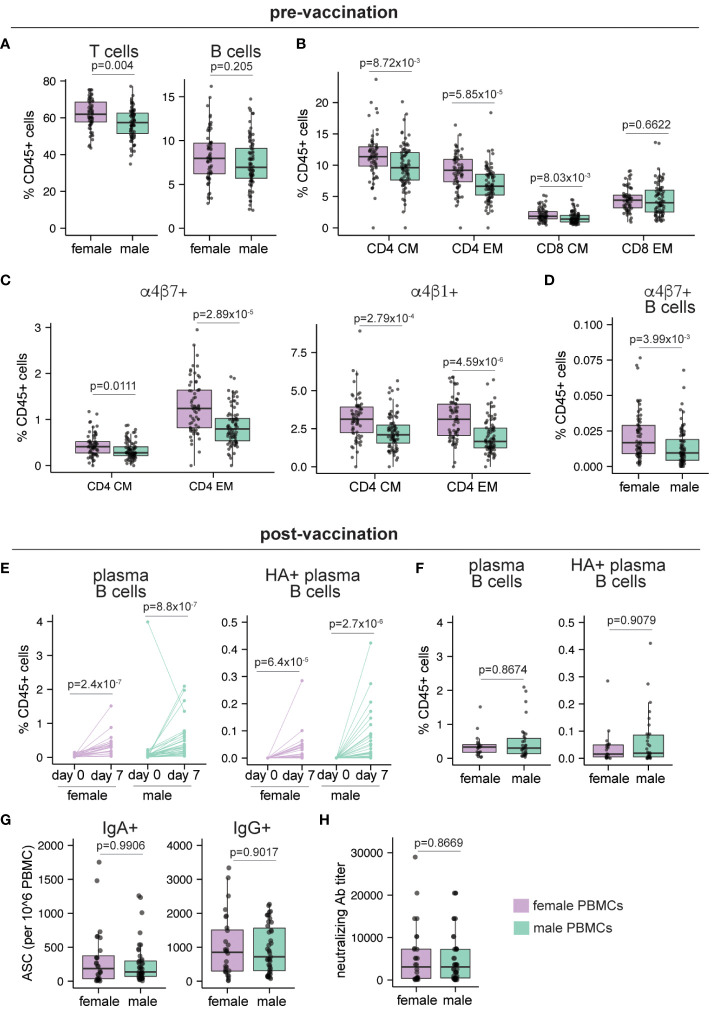
Sex-based differences in immune cell composition and function can contribute to distinct adaptive immune responses. Prior work has quantified these differences in peripheral blood, but little is known about sex differences within human lymphoid tissues. Here, we characterized the composition and phenotypes of adaptive immune cells from male and female ex vivo tonsils and evaluated their responses to influenza antigens using an immune organoid approach. In a pediatric cohort, female tonsils had more memory B cells compared to male tonsils direct ex vivo and after stimulation with live-attenuated but not inactivated vaccine, produced higher influenza-specific antibody responses. Sex biases were also observed in adult tonsils but were different from those measured in children. Analysis of peripheral blood immune cells from in vivo vaccinated adults also showed higher frequencies of tissue homing CD4 T cells in female participants. Together, our data demonstrate that distinct memory B and T cell profiles are present in male vs. female lymphoid tissues and peripheral blood respectively and suggest that these differences may in part explain sex biases in response to vaccines and viruses.

Keywords: adaptive immunity; influenza vaccine; pediatric immunity; sex differences; tonsil organoids.


Conflict of interest statement

LW is a co-inventor on a patent, owned by Stanford University, that describes the immune organoid culture technique. The remaining authors declare that the research was conducted in the absence of any commercial or financial relationships that could be construed as a potential conflict of interest. The author(s) declared that they were an editorial board member of Frontiers, at the time of submission. This had no impact on the peer review process and the final decision.

Figures

Figure 1
Figure 1
Sex bias in B and T cell phenotypes in ex vivo pediatric tonsils. (A) Tonsil samples from pediatric tonsillectomy patients were evaluated for cell composition by flow cytometry. Tonsil tissues from n=40 donors (19 male, 21 female) were assessed. Created with Biorender. (B) Frequency of total B and T cells. (C) Representative flow cytometry plots showing the distribution of five major B cell subsets. (D) Frequencies of naive (IgD+ CD27-), activated (CD83+), classical memory (CD38- CD27+), and atypical memory (IgD- CD27-) B cells. (E) Distribution of subset-defining markers in classical and atypical memory B cells. (F) Sex-based differences in ex vivo CD4 T cell phenotypes. Each point represents one donor. Mann Whitney U tests followed by multiple hypothesis correction (using the Benjamini & Hochberg method) were used to calculate p values. Boxplots indicate the median value, with hinges denoting the first and third quartiles and whiskers denoting the highest and lowest value within 1.5 times the interquartile range of the hinges.
Figure 2
Figure 2
Sex bias in B and T cell responses to influenza antigens in human tonsil organoids. (A) Tonsil organoids were prepared from 35 cryopreserved tonsil samples (n=18 female, n=17 male) and stimulated with live-attenuated influenza vaccine (LAIV), inactivated influenza vaccine (IIV), or wild-type H1N1 and H3N2 viruses. Cells were harvested on day 7 for analysis by flow cytometry. Created with Biorender. (B) Representative flow cytometry plots showing the distribution of major B cell subsets in unstimulated and LAIV-stimulated tonsil organoids. (C) B cell phenotype quantification in male- and female-derived organoids. (D) Frequencies of atypical memory B cells (IgD- CD27-) in male and female-derived organoids. (E) Frequencies of activated (CD83+) total B cells and activated pre-GC B cells (as measured by CD83 and CD39). Sex differences in the frequency of (F) light zone and (G) dark zone GC B cells in unstimulated and influenza antigen-stimulated organoids. (H) Th1 CD4 T cell frequencies in male and female-derived organoids. (I) Linear correlation analysis of Th1 cell frequency and donor age in LAIV-stimulated organoids from male and female participants. Each point represents one donor. Mann Whitney U tests followed by multiple hypothesis correction (using the Benjamini & Hochberg method) were used to calculate p values. Spearman’s rank correlation test and multiple linear regression was performed to calculate the linear regression. Boxplots indicate the median value, with hinges denoting the first and third quartiles and whiskers denoting the highest and lowest value within 1.5 times the interquartile range of the hinges.
Figure 3
Figure 3
Sex differences in antibody magnitude in tonsil organoids in response to LAIV. Culture supernatants were collected from unstimulated and influenza stimulated tonsil organoids (n=35; 17 male, 18 female) on day 7 to measure influenza-specific antibodies by ELISA. Influenza-specific antibody secretion from unstimulated and LAIV-stimulated organoids on a (A) per-donor and (B) sex-stratified basis. Correlation between the secreted antibody levels in LAIV-stimulated organoids and (C) the age of the tissue donors, (D) the frequency of plasmablasts on day 7. (E) Representative flow cytometry plots showing A/California 2009 H1N1 HA+ B cells in ex vivo tonsils and day 10 unstimulated or LAIV-stimulated tonsil organoids. (F) A/California 2009 H1N1 HA+ B cells and HA+ plasmablasts in ex vivo tonsil tissues (n=20, 10 male, 10 female). (G) HA+ B cells and HA+ plasmablasts in unstimulated and LAIV stimulated tonsil organoids on day 10 (n=20; 10 male, 10 female). Mann Whitney U tests were used to calculate p values between groups. Spearman’s rank correlation test and multiple linear regression were performed to calculate linear regression values. Boxplots indicate the median value, with hinges denoting the first and third quartiles and whiskers denoting the highest and lowest value within 1.5 times the interquartile range of the hinges.
Figure 4
Figure 4
Sex differences in breadth and diversity of influenza-specific antibodies in children in response to LAIV. Culture supernatants from unstimulated and LAIV-stimulated tonsil organoids (n=20, 10 male and 10 female children, age-matched) were collected on day 10 and antibody breadth and diversity were assessed using a high throughput protein microarray. (A) Heatmap representing signal intensities for influenza-specific IgG antibodies elicited by LAIV in the tonsil organoids. (B) Protein microarray antibody summary data for influenza virus subtypes. Data represent the median signal intensity for antibodies binding all H1N1 HA, H3N2 HA, B HA, and NA proteins from the array. (C) Median antibody signal intensities stratified by donor sex and age. Shannon index for influenza-specific IgG antibodies binding (D) seasonal and (E) non-seasonal virus subtypes. (F) A/California/07/2009 H1N1 virus neutralizing antibody titers in LAIV-stimulated tonsil organoids (n=35) from day 7 supernatants. (G) Antibody avidity index of LAIV 2019-20 vaccine HA-specific antibodies on day 10 after LAIV stimulation (n=20). Each point is an individual donor. Mann Whitney U tests were performed to determine the statistical significance between groups. Boxplots indicate the median value, with hinges denoting the first and third quartiles and whiskers denoting the highest and lowest value within 1.5 times the interquartile range of the hinges.
Figure 5
Figure 5
Sex bias in immune cell composition and immune responses to influenza antigens in human tonsil organoids derived from adults. Tonsil samples and influenza antigen stimulated tonsil organoids from age-matched adult males and females (n=11, 5 males, 6 females) were assessed by flow cytometry to evaluate immune cell composition ex vivo and immune response to influenza antigens on day 10. (A) cell frequencies of classical memory (CD38- CD27+) and atypical memory (CD27- IgD-) B cells in the ex vivo tonsil tissues. The phenotypes of (B) classical memory and atypical memory B cells and (C) activated (CD83+) preGC B cells in the ex vivo tonsil tissues. (D) Frequencies of activated (HLA-DR+ CD38+) CD4 and CD8 T cells. (E) The frequencies of CD83+ light zone and CXCR4+ dark zone GC B cells in tonsil organoids on day 10. (F) Influenza-specific antibody secretion from IIV and LAIV-stimulated tonsil organoids. (G) Frequencies of A/California/2009 H1N1 HA-specific B cells and classical memory B cells in ex vivo tonsil tissues. (H) Fold change in A/California/2009 H1N1 HA-specific B cells and plasmablasts (within total B cells) in LAIV-stimulated tonsil organoids compared to unstimulated organoids. (I) Median signal intensities (arbitrary units) for influenza-specific IgG (HA and non-HA) elicited by LAIV in the tonsil organoids on day 10 for all the seasonal and non-seasonal influenza virus subtypes. (J) The area under the curve (AUC) for neutralizing antibodies for A/California/07/2009 H1N1 virus present in the culture supernatants in the LAIV-stimulated tonsil organoids derived from adult males and females on day 14 (n=12, 8 females, 4 males). A lower AUC indicates enhanced virus neutralization. Each point represents one donor. Mann Whitney U tests followed by multiple hypothesis correction (using the Benjamini & Hochberg method) were used to calculate p values (A-E). Mann Whitney U tests were used to calculate p values between groups (F–I). Boxplots indicate the median value, with hinges denoting the first and third quartiles and whiskers denoting the highest and lowest value within 1.5 times the interquartile range of the hinges.
Figure 6
Figure 6
Sex differences in human peripheral blood pre- and post-vaccination. Peripheral blood samples were collected from adult healthy volunteers on day 0 (pre-vaccination, n=149; 65 female, 84 male) and day 7 post IIV vaccination (n=56; 33 male, 23 female). Mass cytometry was used to characterize the immune cells as described in McIlwain et al. Frequencies of (A) B and T cells, (B) central memory (CM) and effector memory (EM) CD4 and CD8 T cells, (C) gut homing (α4β7+) and lymphoid homing (α4β1+) CD4 CM and EM T cells, (D) gut homing non-plasma B cells before vaccination. (E) Frequencies of plasma B cells and A/California/2009 H1N1 HA-specific plasma B cells before and 7 days after vaccination. (F) Frequencies of plasma B cells and A/California/2009 H1N1 HA-specific plasma B cells in female and male donors on day 7 post-vaccination. (G) Number of IgA+ and IgG+ antibody secreting cells (ASCs) enumerated by ELISPOT on day 30 post-vaccination (n=71; 28 female, 43 male). (H) Neutralizing antibody titers for A/California/2009 H1N1 virus on day 30 post-vaccination (n=71; 28 female, 43 male). Each point represents one donor. Mann Whitney U tests were used to calculate p values. Additionally, multiple hypothesis correction (using the Benjamini & Hochberg method) was performed for data in (A–D, F) Significance levels are shown for FDR < 0.1. Boxplots indicate the median value, with hinges denoting the first and third quartiles and whiskers denoting the highest and lowest value within 1.5 times the interquartile range of the hinges.

References

    1. Blanchard DC, Griebel G, Blanchard RJ. Gender bias in the preclinical psychopharmacology of anxiety: male models for (predominantly) female disorders. J Psychopharmacol Oxf Engl. (1995) 9:79–82. doi: 10.1177/026988119500900201 - DOI - PubMed
    1. Beery AK, Zucker I. Sex bias in neuroscience and biomedical research. Neurosci Biobehav Rev. (2011) 35:565–72. doi: 10.1016/j.neubiorev.2010.07.002 - DOI - PMC - PubMed
    1. Rubtsova K, Marrack P, Rubtsov AV. Sexual dimorphism in autoimmunity. J Clin Invest. (2015) 125:2187–93. doi: 10.1172/JCI78082 - DOI - PMC - PubMed
    1. Smith-Bouvier DL, Divekar AA, Sasidhar M, Du S, Tiwari-Woodruff SK, King JK, et al. . A role for sex chromosome complement in the female bias in autoimmune disease. J Exp Med. (2008) 205:1099–108. doi: 10.1084/jem.20070850 - DOI - PMC - PubMed
    1. Ursin RL, Klein SL. Sex differences in respiratory viral pathogenesis and treatments. Annu Rev Virol. (2021) 8:393–414. doi: 10.1146/annurev-virology-091919-092720 - DOI - PubMed