

pH-Responsive Theranostic Colloidosome Drug Carriers Enable Real-Time Imaging of Targeted Thrombolytic Process with Near-Infrared-II for Deep Venous Thrombosis
- PMID: 38812529
- PMCID: PMC11136571
- DOI: 10.34133/research.0388
pH-Responsive Theranostic Colloidosome Drug Carriers Enable Real-Time Imaging of Targeted Thrombolytic Process with Near-Infrared-II for Deep Venous Thrombosis
Abstract
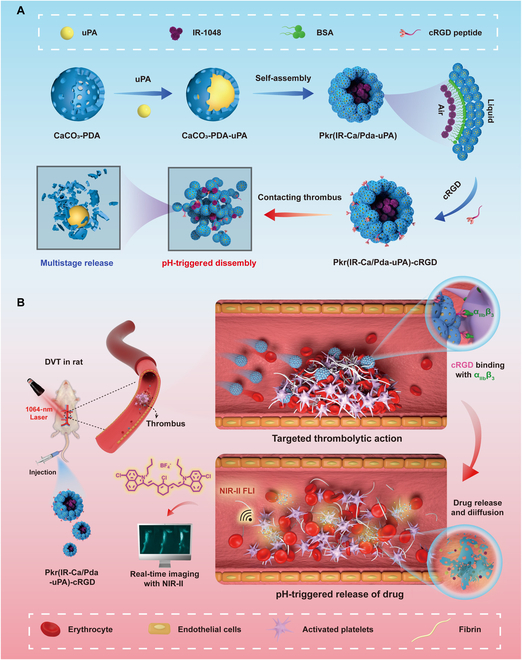
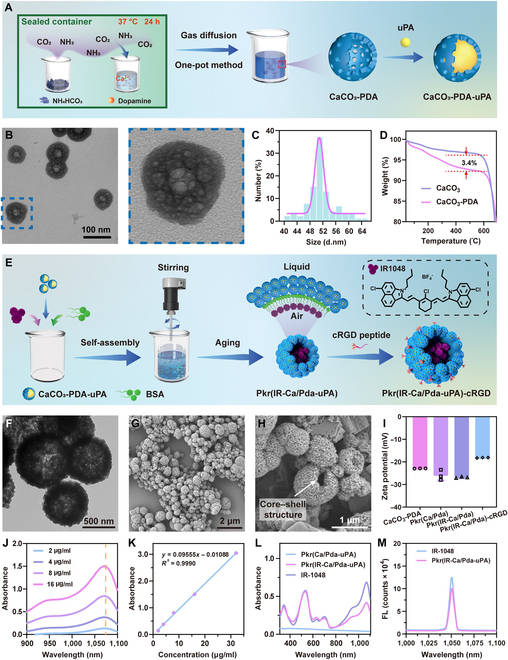
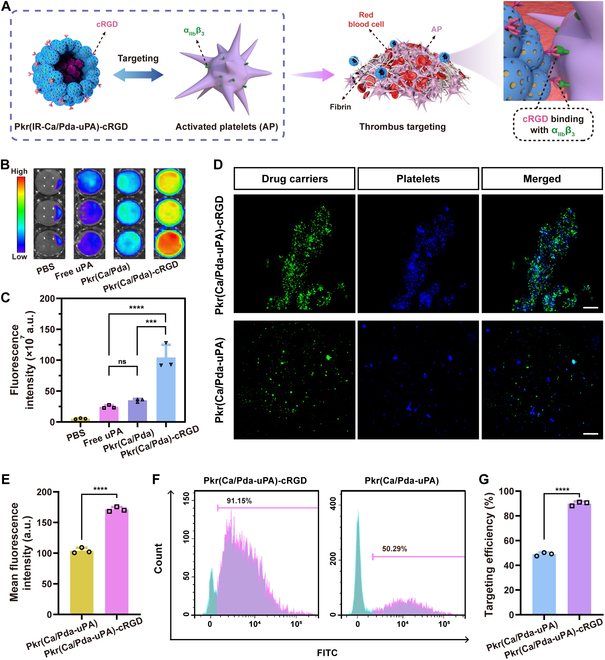
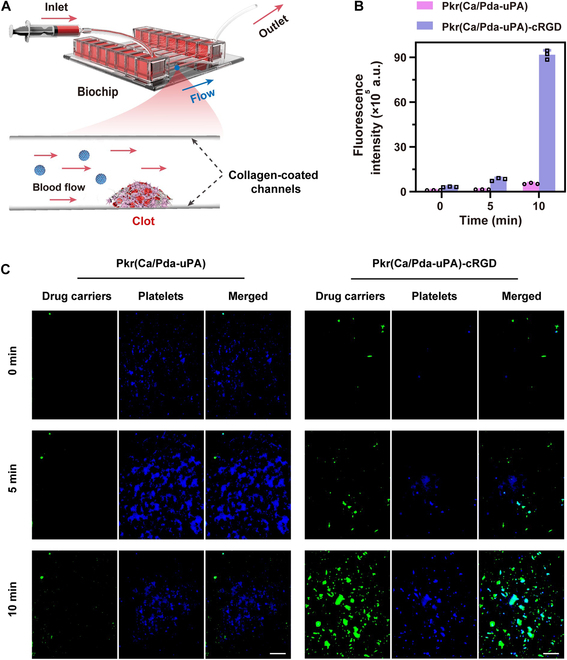
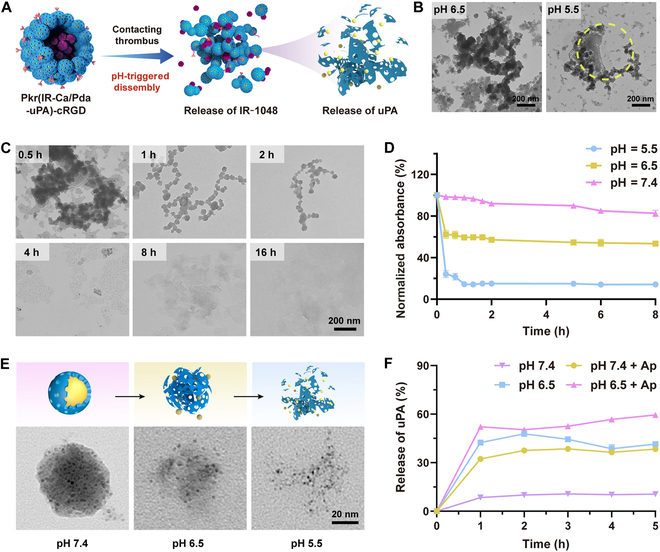
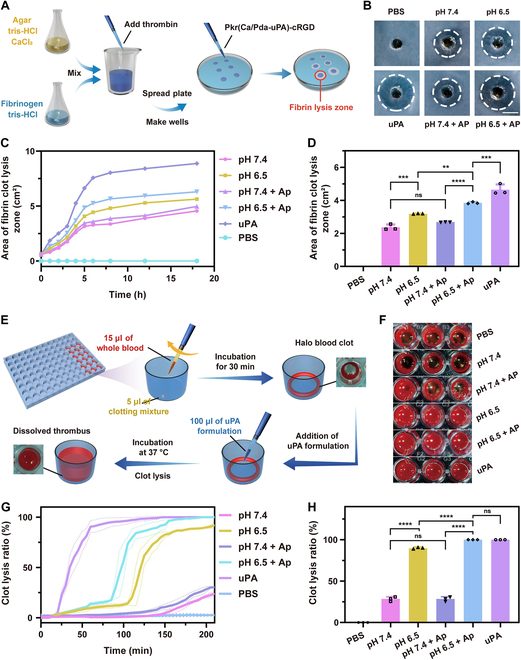
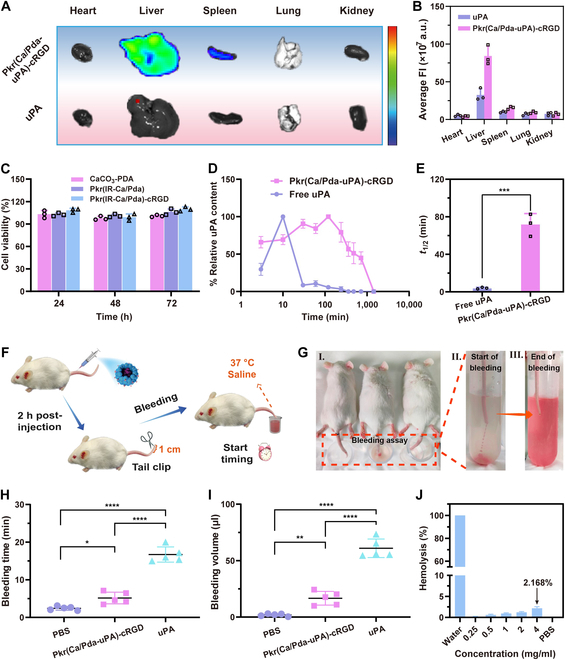
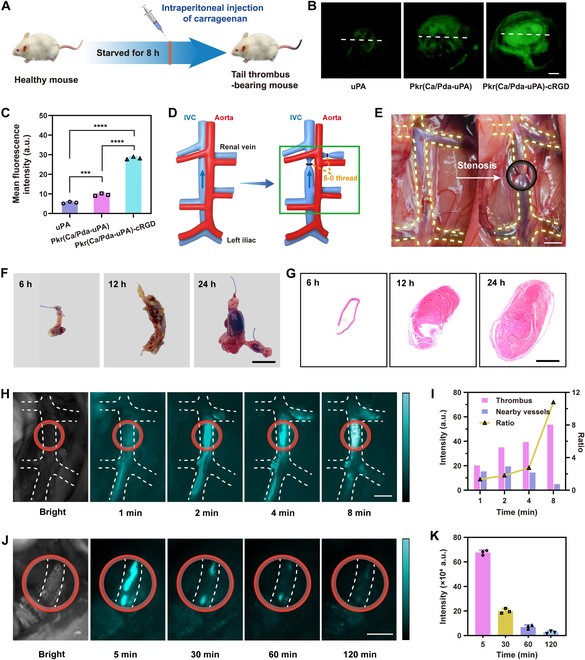
Thrombosis can cause life-threatening disorders. Unfortunately, current therapeutic methods for thrombosis using injecting thrombolytic medicines systemically resulted in unexpected bleeding complications. Moreover, the absence of practical imaging tools for thrombi raised dangers of undertreatment and overtreatment. This study develops a theranostic drug carrier, Pkr(IR-Ca/Pda-uPA)-cRGD, that enables real-time monitoring of the targeted thrombolytic process of deep vein thrombosis (DVT). Pkr(IR-Ca/Pda-uPA)-cRGD, which is prepared from a Pickering-emulsion-like system, encapsulates both near-infrared-II (NIR-II) contrast agent (IR-1048 dye, loading capacity: 28%) and urokinase plasminogen activators (uPAs, encapsulation efficiency: 89%), pioneering the loading of multiple drugs with contrasting hydrophilicity into one single-drug carrier. Upon intravenous injection, Pkr(IR-Ca/Pda-uPA)-cRGD considerably targets to thrombi selectively (targeting rate: 91%) and disintegrates in response to acidic thrombi to release IR-1048 dye and uPA for imaging and thrombolysis, respectively. Investigations indicate that Pkr(IR-Ca/Pda-uPA)-cRGD enabled real-time visualization of targeted thrombolysis using NIR-II imaging in DVT models, in which thrombi were eliminated (120 min after drug injection) without bleeding complications. This may be the first study using convenient NIR-II imaging for real-time visualization of targeted thrombolysis. It represents the precision medicine that enables rapid response to acquire instantaneous medical images and make necessary real-time adjustments to diagnostic and therapeutic protocols during treatment.
Copyright © 2024 Yaxin Ye et al.
Conflict of interest statement
Competing interests: There are no conflicts of interest to declare.
Figures
Similar articles
-
Thrombus-specific theranostic nanocomposite for codelivery of thrombolytic drug, algae-derived anticoagulant and NIR fluorescent contrast agent.Acta Biomater. 2021 Oct 15;134:686-701. doi: 10.1016/j.actbio.2021.07.072. Epub 2021 Aug 3. Acta Biomater. 2021. PMID: 34358695
-
Bacteria-propelled microtubular motors for efficient penetration and targeting delivery of thrombolytic agents.Acta Biomater. 2022 Apr 1;142:49-59. doi: 10.1016/j.actbio.2022.02.008. Epub 2022 Feb 11. Acta Biomater. 2022. PMID: 35158079
-
Targeting Contrast Agents With Peak Near-Infrared-II (NIR-II) Fluorescence Emission for Non-invasive Real-Time Direct Visualization of Thrombosis.Front Mol Biosci. 2021 May 7;8:670251. doi: 10.3389/fmolb.2021.670251. eCollection 2021. Front Mol Biosci. 2021. PMID: 34026844 Free PMC article. Review.
-
Human hair derived uPA loaded capsules with dual near-infrared (I and II biowindows) laser responsive capabilities for multi-effective thrombolysis therapy.J Mater Chem B. 2020 Dec 21;8(47):10854-10866. doi: 10.1039/d0tb02242j. Epub 2020 Nov 13. J Mater Chem B. 2020. PMID: 33185225
-
Thrombolysis for intravascular thrombosis in neonates and children.Curr Opin Pediatr. 2009 Feb;21(1):9-14. doi: 10.1097/MOP.0b013e32831ef537. Curr Opin Pediatr. 2009. PMID: 19242237 Review.
Cited by
-
Nanoparticles for Thrombolytic Therapy in Ischemic Stroke: A Systematic Review and Meta-Analysis of Preclinical Studies.Pharmaceutics. 2025 Feb 6;17(2):208. doi: 10.3390/pharmaceutics17020208. Pharmaceutics. 2025. PMID: 40006575 Free PMC article. Review.
References
-
- Khan F, Tritschler T, Kahn SR, Rodger MA. Venous thromboembolism. Lancet. 2021;398(10294):64–77. - PubMed
-
- Huisman MV, Barco S, Cannegieter SC, Le Gal G, Konstantinides SV, Reitsma PH, Rodger M, Noordegraaf AV, Klok FA. Pulmonary embolism. Nat Rev Dis Prim. 2018;4(1):18028. - PubMed
-
- Zenych A, Fournier L, Chauvierre C. Nanomedicine progress in thrombolytic therapy. Biomaterials. 2020;258: Article 120297. - PubMed
LinkOut - more resources
Full Text Sources
Miscellaneous
