

4-nitroquinoline 1-oxide-induced oral epithelial lesions exhibit time- and stage-dependent changes in the tumor immune microenvironment
- PMID: 38812785
- PMCID: PMC11133644
- DOI: 10.3389/fonc.2024.1343839
4-nitroquinoline 1-oxide-induced oral epithelial lesions exhibit time- and stage-dependent changes in the tumor immune microenvironment
Abstract
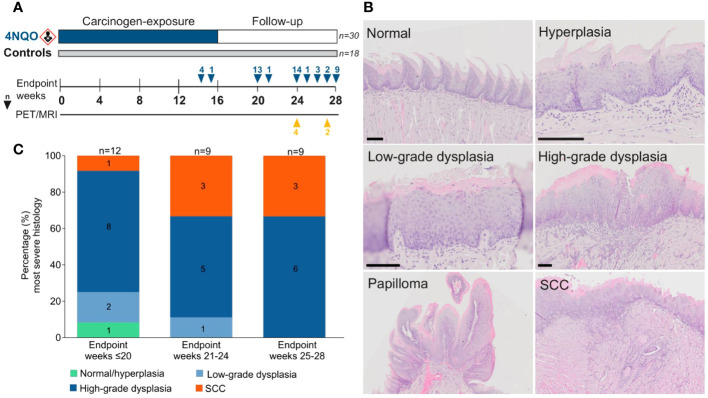
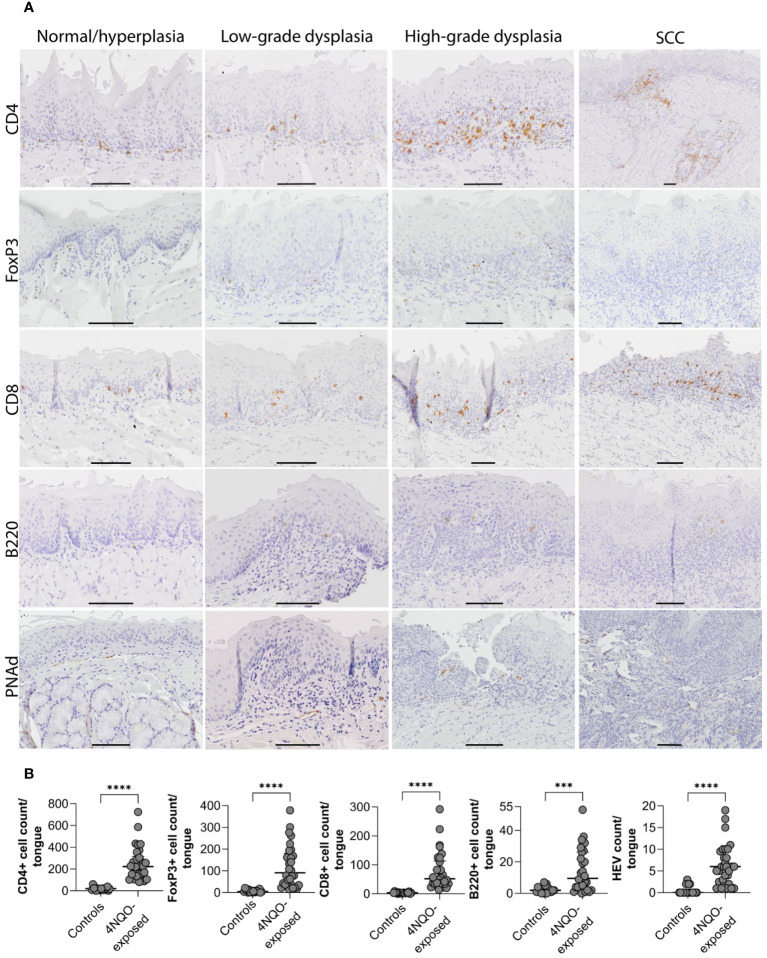
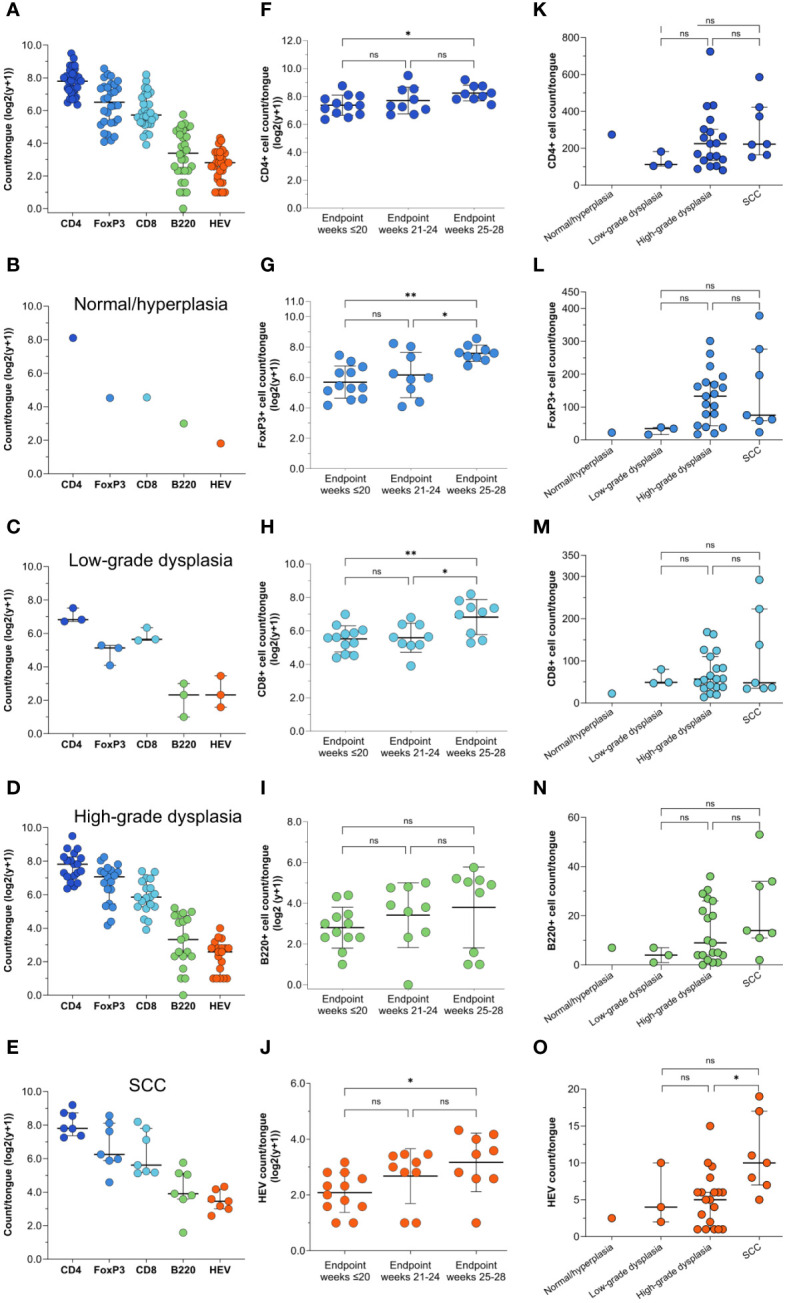
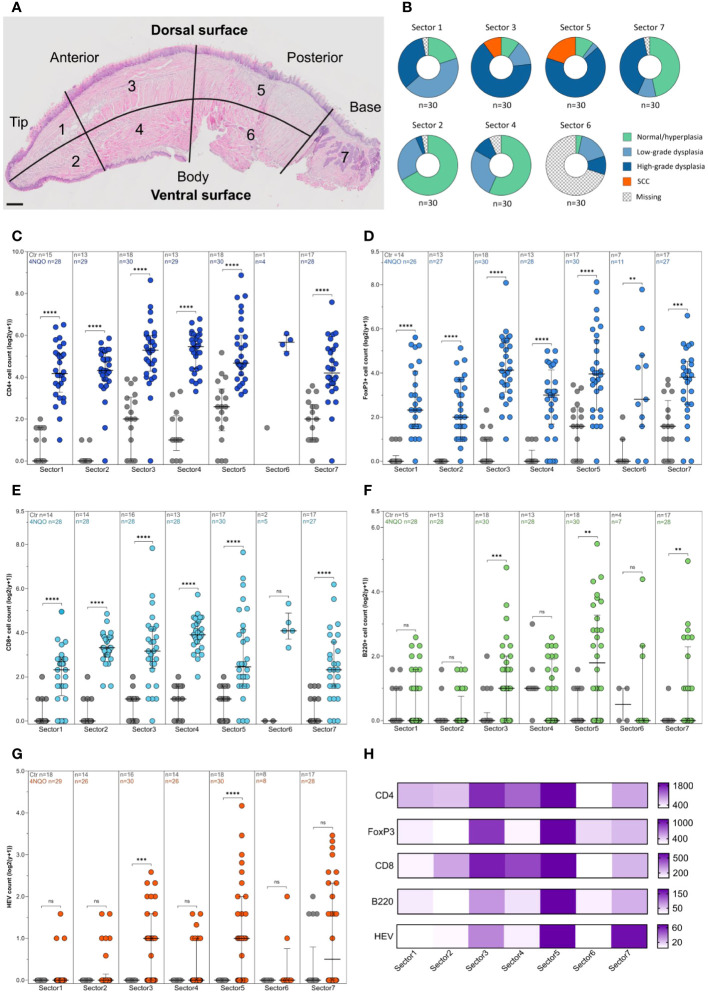
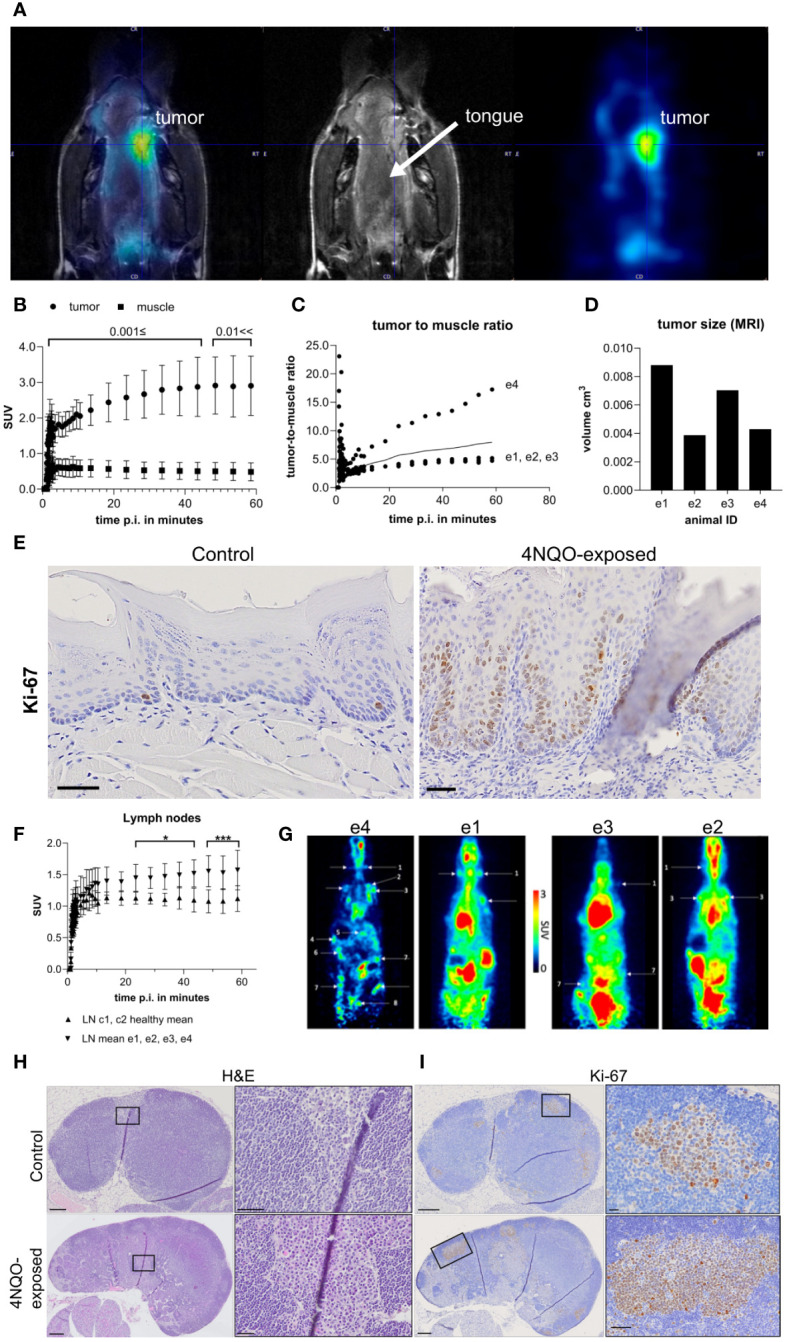
Oral tongue squamous cell carcinoma (OTSCC) is the most common cancer of the oral cavity and is associated with high morbidity due to local invasion and lymph node metastasis. Tumor infiltrating lymphocytes (TILs) are associated with good prognosis in oral cancer patients and dictate response to treatment. Ectopic sites for immune activation in tumors, known as tertiary lymphoid structures (TLS), and tumor-associated high-endothelial venules (TA-HEVs), which are specialized lymphocyte recruiting vessels, are associated with a favorable prognosis in OSCC. Why only some tumors support the development of TLS and HEVs is poorly understood. In the current study we explored the infiltration of lymphocyte subsets and the development of TLS and HEVs in oral epithelial lesions using the 4-nitroquinoline 1-oxide (4NQO)-induced mouse model of oral carcinogenesis. We found that the immune response to 4NQO-induced oral epithelial lesions was dominated by T cell subsets. The number of T cells (CD4+, FoxP3+, and CD8+), B cells (B220+) and PNAd+ HEVs increased from the earliest to the latest endpoints. All the immune markers increased with the severity of the dysplasia, while the number of HEVs and B cells further increased in SCCs. HEVs were present already in early-stage lesions, while TLS did not develop at any timepoint. This suggests that the 4NQO model is applicable to study the dynamics of the tumor immune microenvironment at early phases of oral cancer development, including the regulation of TA-HEVs in OTSCC.
Keywords: 4-nitroquinoline 1-oxide (4NQO); high endothelial venules (HEVs); oral carcinogenesis; tertiary lymphoid structures (TLS); tumor infiltrating lymphocytes (TILs); tumor microenvironment.
Copyright © 2024 Sellæg, Schwienbacher, Kranz, Aamodt, Wirsing, Berge, Hadler-Olsen and Magnussen.
Conflict of interest statement
The authors declare that the research was conducted in the absence of any commercial or financial relationships that could be construed as a potential conflict of interest.
Figures
Similar articles
-
High endothelial venules in intracranial germinomas: Implications for lymphocytes infiltration.Cancer Med. 2023 Mar;12(5):5450-5460. doi: 10.1002/cam4.5367. Epub 2022 Oct 19. Cancer Med. 2023. PMID: 36259639 Free PMC article.
-
Immune checkpoint ligands expressed on mature high endothelial venules predict poor prognosis of NSCLC: have a relationship with CD8+ T lymphocytes infiltration.Front Immunol. 2024 Feb 8;15:1302761. doi: 10.3389/fimmu.2024.1302761. eCollection 2024. Front Immunol. 2024. PMID: 38390332 Free PMC article.
-
High endothelial venules (HEVs) in human melanoma lesions: Major gateways for tumor-infiltrating lymphocytes.Oncoimmunology. 2012 Sep 1;1(6):829-839. doi: 10.4161/onci.20492. Oncoimmunology. 2012. PMID: 23162750 Free PMC article.
-
High endothelial venules (HEVs) in immunity, inflammation and cancer.Angiogenesis. 2021 Nov;24(4):719-753. doi: 10.1007/s10456-021-09792-8. Epub 2021 May 6. Angiogenesis. 2021. PMID: 33956259 Free PMC article. Review.
-
Tertiary lymphoid structures in colorectal cancer - organization and immune cell interactions.Am J Clin Exp Immunol. 2024 Dec 25;13(6):236-245. doi: 10.62347/GRYY2849. eCollection 2024. Am J Clin Exp Immunol. 2024. PMID: 39839346 Free PMC article. Review.
Cited by
-
Chemopreventive effects of chitosan nanogel with thiocolchicoside and lauric acid in chemically induced oral carcinogenesis, in a rodent model.Naunyn Schmiedebergs Arch Pharmacol. 2025 May 2. doi: 10.1007/s00210-025-04185-w. Online ahead of print. Naunyn Schmiedebergs Arch Pharmacol. 2025. PMID: 40314765
References
-
- Bjerkli IH, Jetlund O, Karevold G, Karlsdottir A, Jaatun E, Uhlin-Hansen L, et al. . Characteristics and prognosis of primary treatment-naive oral cavity squamous cell carcinoma in Norway, a descriptive retrospective study. PloS One. (2020) 15:e0227738. doi: 10.1371/journal.pone.0227738 - DOI - PMC - PubMed
-
- Sales de Sá R, Miranda Galvis M, Mariz B, Leite AA, Schultz L, Almeida OP, et al. . Increased tumor immune microenvironment CD3+ and CD20+ Lymphocytes predict a better prognosis in oral tongue squamous cell carcinoma. Front Cell Dev Biol. (2020) 8:622161. doi: 10.3389/fcell.2020.622161 - DOI - PMC - PubMed
LinkOut - more resources
Full Text Sources
Research Materials