. 2024 May 15:15:1379784.
doi: 10.3389/fgene.2024.1379784. eCollection 2024.

Genome-wide identification analysis in wild-type Solanum pinnatisectum reveals some genes defending against Phytophthora infestans

Affiliations

Genome-wide identification analysis in wild-type Solanum pinnatisectum reveals some genes defending against Phytophthora infestans

Chunxiu Shen et al. Front Genet. .

Abstract

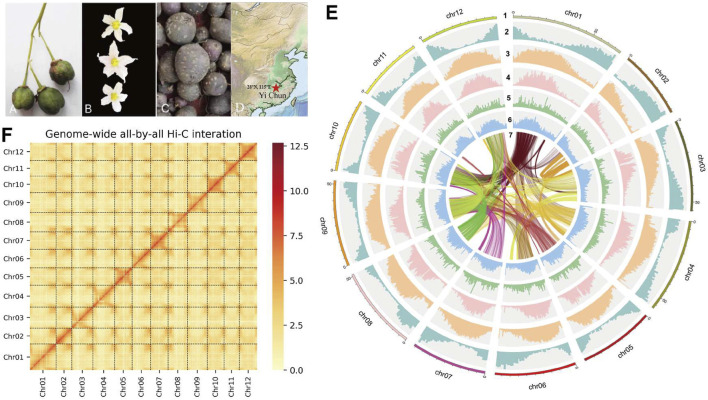
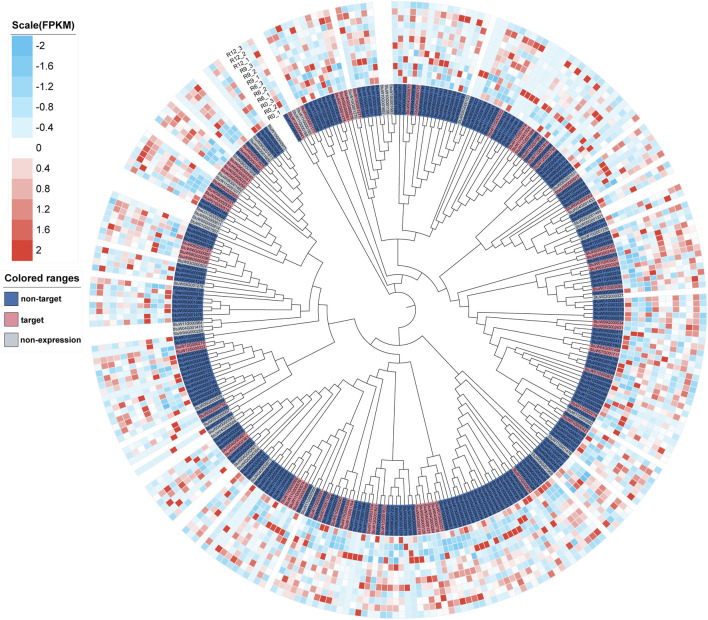
Solanum pinnatisectum exhibits strong resistance to late blight caused by Phytophthora infestans but only an incomplete genome assembly based on short Illumina reads has been published. In this study, we generated the first chromosome-level draft genome for the wild-type potato species S. pinnatisectum in China using Oxford Nanopore technology sequencing and Hi-C technology. The high-quality assembled genome size is 664 Mb with a scaffold N50 value of 49.17 Mb, of which 65.87% was occupied by repetitive sequences, and predominant long terminal repeats (42.51% of the entire genome). The genome of S. pinnatisectum was predicted to contain 34,245 genes, of which 99.34% were functionally annotated. Moreover, 303 NBS-coding disease resistance (R) genes were predicted in the S. pinnatisectum genome to investigate the potential mechanisms of resistance to late blight disease. The high-quality chromosome-level reference genome of S. pinnatisectum is expected to provide potential valuable resources for intensively and effectively investigating molecular breeding and genetic research in the future.

Keywords: Hi-C technology; assembly; ont; potatoes; resistance gene.


Conflict of interest statement

Authors XZ and XH are employed by Grandomics Biosciences, Wuhan, China. The remaining authors declare that the research was conducted in the absence of any commercial or financial relationships that could be construed as a potential conflict of interest.

Figures

FIGURE 1
FIGURE 1
(A) The fruit of S. Pinnatisectum. (B) The flower of S. Pinnatisectum. (C) The tuber of S. Pinnatisectum. (D) The Red five-pointed star is the sampling site (28°N 115°E). The location is Yichun. (E) The S. Pinnatisectum’s genome information in circos. The scale of 5 Mb in the outermost circos and the chromosome was cut into 0.5 Mb to stat the density of different type among 2-6 circos. The contents represented by the circles from the outside to the inside are displayed as follows: 1: The length of chromosome; 2: The density of gene; 3: The density of total repeat sequences; 4: The density of Gypsy; 5: The density of Copia; 6: The distribution of GC base content; 7: The colinearity of gene block and the number of gene in each block is more than 40. F: The Hi-C heatmap of S. Pinnatisectum.
FIGURE 2
FIGURE 2
Results of the gene family. (A) Numbers of gene families and genes among S. tuberosum L. (blue), S. chacoense (orange), and S. pinnatisectum (purple). The species-specific genes are denoted in yellow words. The spot size represents the number of gene families or genes. (B) Top-20 significant KEGG pathways in the enrichment analysis. The spot size represents the number of each enriched pathway (see the count bar), and the color is the degree of enrichment (see p.adj bar). (C) Top-20 significantly enriched GO terms in the enrichment analysis. The spot and color are analyzed in the same manner as in (B).
FIGURE 3
FIGURE 3
Clustering of the differential expressions and enrichment of the specific cluster genes. (A) Gene classification into four clusters, where blue indicates low expression and red indicates high expression. (B) Gene classification into two clusters. (C) Gene belonging to Cluster 1 in (A) with significant enrichment of the KEGG pathway in the enrichment analysis. (D) Gene belonging to Cluster 1 in (A) with significant enrichment of the GO terms in the enrichment analysis.
FIGURE 4
FIGURE 4
Tree and expressive heatmap of the resistance genes. The color light blue indicates low expression, and red shows high expression. The non-expression label is indicated by the gray genes, which are not expressed in 12 RNAseq. The non-target label shown in dark blue indicates the expression pattern of the gene, which is not from low to high with time lapse in the 12 RNAseq. The target label shown in pink indicates the expression pattern of the gene from low to high with time lapse in 12 RNAseq.
FIGURE 5
FIGURE 5
Locations of the R genes in each chromosome. The different colored bars represent different chromosomes, with the name of the chromosome shown at the top. The black lines in the colored bars show the locations of the R genes. The lengths of the colored bars represent the lengths of the corresponding chromosomes. The scale of length is shown along the left axis.

Similar articles

References

    1. Abramovitch R. B., Martin G. B. (2004). Strategies used by bacterial pathogens to suppress plant defenses. Curr. Opin. plant Biol. 7 (4), 356–364. 10.1016/j.pbi.2004.05.002 - DOI - PubMed
    1. Albert I., BöHM H., Albert M., Feiler C. E., Imkampe J., Wallmeroth N., et al. (2015). An RLP23–SOBIR1–BAK1 complex mediates NLP-triggered immunity. Nat. Plants 1 (10), 15140. 10.1038/nplants.2015.140 - DOI - PubMed
    1. Ashburner M., Ball C. A., Blake J. A., Botstein D., Butler H., Cherry J. M., et al. (2000). Gene ontology: tool for the unification of biology. The Gene Ontology Consortium. Nat. Genet. 25 (1), 25–29. 10.1038/75556 - DOI - PMC - PubMed
    1. Ausubel F. M. (2005). Are innate immune signaling pathways in plants and animals conserved? Nat. Immunol. 6 (10), 973–979. 10.1038/ni1253 - DOI - PubMed
    1. Bac Resource Consortium T., Cheung V. G., Nowak N., Kirsch I. R., Zhao S., Chen X. N., et al. (2001). Integration of cytogenetic landmarks into the draft sequence of the human genome. Nature 409 (6822), 953–958. 10.1038/35057192 - DOI - PMC - PubMed