. 2024 May 15:17:1347540.
doi: 10.3389/fnmol.2024.1347540. eCollection 2024.

Horizontal-cell like Dm9 neurons in Drosophila modulate photoreceptor output to supply multiple functions in early visual processing

Affiliations

Horizontal-cell like Dm9 neurons in Drosophila modulate photoreceptor output to supply multiple functions in early visual processing

Christopher Schnaitmann et al. Front Mol Neurosci. .

Abstract

Dm9 neurons in Drosophila have been proposed as functional homologs of horizontal cells in the outer retina of vertebrates. Here we combine genetic dissection of neuronal circuit function, two-photon calcium imaging in Dm9 and inner photoreceptors, and immunohistochemical analysis to reveal novel insights into the functional role of Dm9 in early visual processing. Our experiments show that Dm9 receive input from all four types of inner photoreceptor R7p, R7y, R8p, and R8y. Histamine released from all types R7/R8 directly inhibits Dm9 via the histamine receptor Ort, and outweighs simultaneous histamine-independent excitation of Dm9 by UV-sensitive R7. Dm9 in turn provides inhibitory feedback to all R7/R8, which is sufficient for color-opponent processing in R7 but not R8. Color opponent processing in R8 requires additional synaptic inhibition by R7 of the same ommatidium via axo-axonal synapses and the second Drosophila histamine receptor HisCl1. Notably, optogenetic inhibition of Dm9 prohibits color opponent processing in all types of R7/R8 and decreases intracellular calcium in photoreceptor terminals. The latter likely results from reduced release of excitatory glutamate from Dm9 and shifts overall photoreceptor sensitivity toward higher light intensities. In summary, our results underscore a key role of Dm9 in color opponent processing in Drosophila and suggest a second role of Dm9 in regulating light adaptation in inner photoreceptors. These novel findings on Dm9 are indeed reminiscent of the versatile functions of horizontal cells in the vertebrate retina.

Keywords: color opponency; color vision; feedback inhibition; histamine receptor; horizontal cell; insect; photoreceptor; presynaptic calcium.


Conflict of interest statement

The authors declare that the research was conducted in the absence of any commercial or financial relationships that could be construed as a potential conflict of interest.

Figures
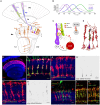
Figure 1
Figure 1
Dm9 neurons of the Drosophila visual system. (A) Schematic of the Drosophila optic lobe. The multicolumnar Dm9 cell and selected medulla projection and local interneurons postsynaptic to inner photoreceptors R7/R8 are shown in orange. R1–R6 outer photoreceptors (gray) project from the retina (Re) to the lamina (La). Yellow (y) and pale (p) inner photoreceptor tandems R7y/R8y (dark purple/green) and R7p/R8p (light purple/blue) project to the distal layers M1–M6 of the medulla (Me). R7p/R8p express rhodopsin rh3/rh5; R7y/R8y express rh4/rh6; R1–R6 express rh1 [Lo, lobula; Lop, lobula plate; adapted from Fischbach and Dittrich (1989)]. (B) Spectral sensitivity of the Rhodopsins expressed in the five major photoreceptor types (same color code as in (A); data based on Salcedo et al., 1999). (C) Schematic of circuit interactions that shape the responses in R7/R8. Histamine release and HisCl1 receptors mediate mutual synaptic inhibition between R7 and R8 (Schnaitmann et al., 2018). Dm9 medulla neurons were proposed to mediate feedback inhibition to all R7/R8 photoreceptors (Heath et al., 2020). Based on serial EM analysis, R1–R6 transmit information to Dm9 via L3 lamina monopolar cells (Takemura et al., ; Davis et al., ; Kind et al., 2021). Demonstrated (black) and suggested (gray) excitatory and inhibitory synaptic connections indicated by (+) and (–), respectively. (D) Serial EM reconstruction of the neurites of Dm9 in four neighboring medulla column (red) and the terminals of a single R7/R8 pair (purple/green). Data from Takemura et al. (2015). (E–K) Confocal images of Dm9 cells in the optic lobe and the distal medulla layers M1–M6. Neuropil in blue (anti-Dlg or anti-CadN). Scale bars 5 μm, if not stated otherwise. (E) Dm9 neurons in the medulla expressing membrane tagged GFP (see methods, mCD8::GFP, anti-GFP, red), scale bar 30 μm. (F) Co-staining of Dm9 expressing Twitch-2C (anti-GFP, red) and R7/R8 terminals expressing DsRed (anti-RFP, green). (G–H') Activity-dependent, directional GRASP (nSyb::GRASP, anti-GRASP, green) highlights synaptic input from (G, G') R7yto Dm9 in M3-M6, and from (H, H') R8y to Dm9 in M1-M3. (G', H') Display the nSyb::GRASP signals alone. (I) Intersection of the ort-promoter-hemidriver (ortC1 − 3) and 64H01-GAL4 labels a single Dm9 cell expressing mCD8::GFP (anti-GFP, green) within the population of Dm9 expressing mCD8::RFP (anti-RFP, red). (J) Dm9 coexpressing the presynaptic vesicle marker nSyb::mRed (anti-RFP, green) and mCD8::GFP (anti-GFP, red).(K) Cell-specific expression of multi-epitope tagged vGluT (anti-FLAG, green) from a conditional allele highlights glutamatergic synaptic vesicles in Dm9 coexpressing mCD8::mCherry (anti-RFP, red).
Figure 2
Figure 2
Genetic dissection reveals inhibitory and excitatory photoreceptor inputs to Dm9. (A) Calcium responses (ΔR/R) measured with the genetically encoded ratiometric calcium sensor Twitch-2C indicate a reduction in intracellular calcium in Dm9 neurons when visual stimuli are presented to the eyes of flies. (Left) Time course of responses to different isoluminant spectral stimuli, corresponding to maximum intensity stimuli. Responses to green, cyan, blue, UVlong (dark purple), and UVshort (light purple) are depicted with the respective color; gray box indicates stimulus period. (Middle) Quantification of the responses, *p < 0.05, Wilcoxon test. (Right) Median responses to color stimuli presented at four different intensities (100-103 a.u.). (B) Visually evoked responses in Dm9 in flies with only a single functional type of photoreceptor (norpA rescue), *p < 0.05, one-sample t-test. The wavelength of the presented visual stimulus always matched the maximum sensitivity of the rhodopsin expressed in the rescued photoreceptor type. (C) Dm9 responses in ort mutant flies, *p < 0.05, Wilcoxon test. (D) Dm9 responses in ort mutant flies with ort rescue in Dm9 (Dm9 > ort, ort) and UAS-control flies that lack the Gal4-driver (UAS-ort, ort, no GAL4), *p < 0.05, Wilcoxon test. Responses to the same light stimuli were significantly different between both genotypes, p < 0.05, Mann-Whitney U-test. (E) Dm9 responses in ort mutant flies with only a single functional photoreceptor type (norpA rescue, ort ), *p < 0.05, Mann-Whitney U-test. (F) Dm9 responses in Hdc mutant flies, *p < 0.05, Wilcoxon test. (G) Schematic of the input signals to Dm9 (based on results in the Figure). (+) and (–) denote excitatory and inhibitory input, respectively. Dashed pathway indicates unknown histamine-independent excitatory input. Data are represented as median (solid line), 10%/90% quantiles (whiskers), and 25%/75% quantiles (box/error bands). Asterisks indicate responses significantly different from zero. If not stated otherwise, stimuli were shown at maximum intensity (103 a.u.). For precise genotypes and number n recordings, see Supplementary Table S1. See also Supplementary Figure S1.
Figure 3
Figure 3
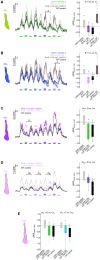
Dm9 mediates color opponent processing in all R7 and R8 photoreceptor types. (A) Responses of R8y photoreceptor terminals to opponent monochromatic stimuli in four different genotypes: flies with restored ort expression in Dm9 in ort mutant (colored line/box plot) or ort, hisCl1 double mutant flies (dark gray) harboring UAS-ort and Dm9-GAL4 driver, positive control flies (WT background; black), and negative UAS-control flies (ort mutants harboring UAS-ort but no GAL4; light gray). Stimulation consists of alternating presentation of photoreceptor type-specific preferred monochromatic stimuli and spectrally composite stimuli that additionally contain another monochromatic stimulus (stimulus protocols are shown below the recording traces; for intensities see methods). (Left) Time course of responses. (Right) Comparison of responses to preferred monochromatic and composite stimuli with UVl (ΔR/Rcomp – ΔR/Rpref; indicated with the greek letter Δ in the left plot). Additive and subtractive (opponent) processing of the two wavelengths of composite stimuli is indicated by positive and negative values, respectively. ΔR/R(comp−pref) of Dm9 > Ort (ort) flies was significantly different from UAS-control (ort) and Dm9 > Ort (ort, hisCl1) (statistical results and tests shown below). (B) Same as in (A) for R8p photoreceptor terminals. (Right) Comparison of responses to preferred monochromatic and composite stimuli with Uvs. ΔR/R(comp−pref) of Dm9 > Ort (ort) flies was significantly different from UAS-control (ort) and Dm9 > Ort (ort, hisCl1) flies. (C) Responses of R7y photoreceptor terminals to opponent monochromatic stimuli in three different genotypes: flies with restored ort expression in Dm9 in hisCl1, ort double mutants (colored line/box plot) harboring UAS-ort and Dm9-GAL4 driver, positive control flies (WT background; black), and negative UAS-control flies (hisCl1, ort mutants harboring UAS-ort but no GAL4; light gray). (Right) Comparison of responses to preferred monochromatic and composite stimuli with green light. ΔR/R(comp−pref) of Dm9 > Ort (hisCl1, ort) flies was significantly different from UAS-control (hisCl1, ort). (D) Same as in (C) for R7p photoreceptor terminals. (Right) Comparison of responses to preferred monochromatic and composite stimuli with blue light (indicated with the greek letter ΔB in the left plot). ΔR/R(comp−pref) of Dm9 > Ort (hisCl1, ort) flies was significantly different from UAS-control (hisCl1, ort) flies. (E) Comparison of responses to preferred monochromatic and composite stimuli with green or cyan light from data in [(D) left; indicated with the greek letter ΔG and ΔC, respectively]. ΔR/R(comp−pref) of Dm9 > Ort (hisCl1, ort) flies were significantly different from UAS-control (hisCl1, ort) flies. Asterisks indicate significant inhibition or additional excitation, *p < 0.05, Wilcoxon test. Significant difference between groups: p < 0.05, KruskalWallis H-test; p < 0.05, post-hoc Mann-Whitney U-tests. For genotypes and n recordings, see Supplementary Table S1.
Figure 4
Figure 4
Optogenetic inhibition of Dm9 abolishes color opponent processing in R7/R8 photoreceptors. (A) Sketch of the experimental procedure to optogenetically inhibit Dm9 neurons during calcium imaging in inner photoreceptor terminals. Dm9 neurons expressed the light-gated chloride channel GTACR1 that we found to be activatable by the 823 nm two-photon laser [see (C)]. Note that R7/R8 input to Dm9 similarly causes chloride influx into Dm9 via Ort. Twitch-2C was expressed in single R7/R8 types. (B) Two-photon laser scanning image of R8p photoreceptors expressing Twitch-2C (green) and Dm9 neurons expressing EYFP-tagged GTACR1 (red) in the medulla (excited with 825 and 970 nm, respectively). (C) Laser scanning inhibits Dm9 neurons expressing GTACR1 and Twitch-2C. (Upper) Responses in Dm9 expressing GTACR1 after two-photon scanning onset (arrow head) and during presentation of color stimuli at maximum intensity (gray box). Note the strong activity decrease after scanning onset. (Lower) Responses in Dm9 lacking GTACR1 expression with same stimuli and scanning conditions. For quantification see Supplementary Figure S2A. (D) Responses of R8y photoreceptor terminals to opponent monochromatic stimuli in flies with GTACR1 expression in Dm9 (colored line/box plot) and UAS-control flies (harboring UAS-GTACR1 but no GAL4; black). Stimulation as in Figure 3. (Left) Time course of responses. (Right) Comparison of responses to preferred monochromatic and composite stimuli with UVl (ΔR/Rcomp – ΔR/Rpref; indicated with Δ in the left plot). Additive and subtractive (opponent) processing of the two wavelengths of composite stimuli is indicated by positive and negative values, respectively. Asterisks indicate significant inhibition or additional excitation, *p < 0.05, Wilcoxon test. ΔR/R(comp−pref) of Dm9 > GTACR1 flies was significantly different from UAS-control flies (p < 0.05, Mann-Whitney U-tests). (E) Same as in (D) for R8p photoreceptor terminals. (Right) Comparison of responses to preferred monochromatic and composite stimuli with UVs, *p < 0.05, Wilcoxon test. ΔR/R(comp−pref) of Dm9 > GTACR1 flies was significantly different from UAS-control flies (p < 0.05, Mann-Whitney U-tests). (F) Same as in (D) for R7y photoreceptor terminals. (Right) Comparison of responses to preferred monochromatic and composite stimuli with green light, *p < 0.05, Wilcoxon test. ΔR/R(comp−pref) of Dm9 > GTACR1 flies was significantly different from UAS-control flies (p < 0.05, Mann-Whitney U-tests). (G) Same as in (D) for R7p photoreceptor terminals. (Right) Comparison of responses to preferred monochromatic and composite stimuli with blue light, *p < 0.05, Wilcoxon test. ΔR/R(comp−pref) of Dm9 > GTACR1 flies was significantly different from UAS-control flies (p < 0.05, p < 0.05, Mann-Whitney U-tests). For genotypes and n recordings, see Supplementary Table S1.
Figure 5
Figure 5
Optogenetic inhibition of Dm9 decreases calcium activity in R7/R8 photoreceptor terminals and shifts sensitivity toward higher stimulus intensities. (A) Responses in R8y to different intensities of green stimuli (100-103 a.u.) in flies expressing GTACR1 in Dm9. In one set of experiments, the onset of calcium imaging and optogenetic stimulation (elicited by the two-photon laser used for calcium imaging) precedes visual stimulus presentation (red; “preceding optogenetic stimulation”, POS; onset of laser scanning indicated by red arrow head). In the second set of experiments, the visual stimulation precedes the onset of calcium imaging and optogenetic stimulation [green; “preceding visual stimulation”, PVS; onset of laser scanning indicated by colored (green) arrow head]. Gray box indicates visual stimulation period. The magnitude of the responses correlates with stimulus intensity. (Left) Time course of responses. (Right) R8y average responses to the color stimuli presented at four different intensities (100-103 a.u.) calculated between 2 s and 3 s after visual stimulus onset (responses with and approx. without Dm9 inhibition). (B) Same as in (A) for R8p with blue stimuli. (C) Same as in (A) for R7y with UVl stimuli. (D) Same as in (A) for Ryp with UVs stimuli. Responses to the same intensity stimuli differed between the two experimental groups in (A–D), p < 0.05, KruskalWallis H-test; p < 0.05, post-hoc Mann-Whitney U-tests. For genotypes and n recordings, see Supplementary Table S1. See also Supplementary Figure S2.
Figure 6
Figure 6
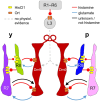
Proposed circuit diagram for the multiple interactions between R7, R8, and Dm9. Light depolarizes R7/R8 photoreceptors and increases the release of histamine. R7/R8 of the same ommatidium and medulla column mutually inhibit each other via histamine and HisCl1 receptors. In parallel, all four types of inner photoreceptors R7/R8 convey inhibitory input to Dm9 cells (only two columns shown) via histamine and its receptor Ort. R7 photoreceptors also provide excitatory input to Dm9, which is outweighed by inhibition. Dm9 cells then reduce the release of glutamate thereby decreasing excitatory input to the photoreceptors. Because single Dm9 cells receive p and y input in several neighboring columns, this processing establishes feedback inhibition that goes beyond purely p and y interactions, and is supposed to provide an inhibitory surround to individual presynaptic photoreceptors. Additionally, Dm9's feedback inhibition provides an important contribution to the regulation of the overall light sensitivity in inner photoreceptors R7 and R8. Physiological evidence for synaptic input to Dm9 from R1–R6 photoreceptor signal-transmitting L3 lamina neurons, revealed by EM, has not yet been shown. Arrows and oval arrows indicate excitatory and inhibitory signaling.

Similar articles

References

    1. Alejevski F., Saint-Charles A., Michard-Vanhée C., Martin B., Galant S., Vasiliauskas D., et al. . (2019). The HisCl1 histamine receptor acts in photoreceptors to synchronize Drosophila behavioral rhythms with light-dark cycles. Nat. Commun. 10:252. 10.1038/s41467-018-08116-7 - DOI - PMC - PubMed
    1. Barth M., Schultze M., Schuster C. M., Strauss R. (2010). Circadian plasticity in photoreceptor cells controls visual coding efficiency in drosophila melanogaster. PLoS ONE 5:e9217. 10.1371/journal.pone.0009217 - DOI - PMC - PubMed
    1. Baylor D. A., Fuortes M. G. F., O'Bryan P. M. (1971). Receptive fields of cones in the retina of the turtle. J. Physiol. 214, 265–294.1. 10.1113/jphysiol.1971.sp009432 - DOI - PMC - PubMed
    1. Borst A., Groschner L. N. (2023). How flies see motion. Annu. Rev. Neurosci. 46, 17–37. 10.1146/annurev-neuro-080422-111929 - DOI - PubMed
    1. Burg M. G., Sarthy P. V., Koliantz G., Pak W. L. (1993). Genetic and molecular identification of a Drosophila histidine decarboxylase gene required in photoreceptor transmitter synthesis. EMBO J. 12, 911–919. 10.1002/j.1460-2075.1993.tb05732.x - DOI - PMC - PubMed

LinkOut - more resources