. 2024 Jul 1;137(1):145-153.
doi: 10.1152/japplphysiol.00117.2024. Epub 2024 May 30.

Critical environmental core temperature limits and heart rate thresholds across the adult age span (PSU HEAT Project)

Affiliations

Critical environmental core temperature limits and heart rate thresholds across the adult age span (PSU HEAT Project)

Rachel M Cottle et al. J Appl Physiol (1985). .

Abstract

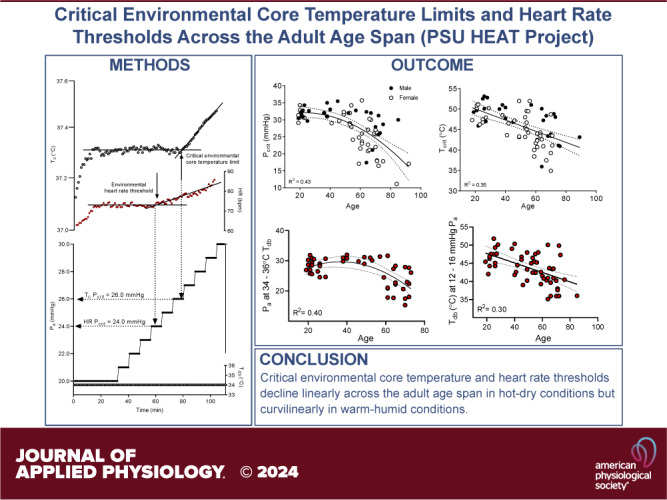
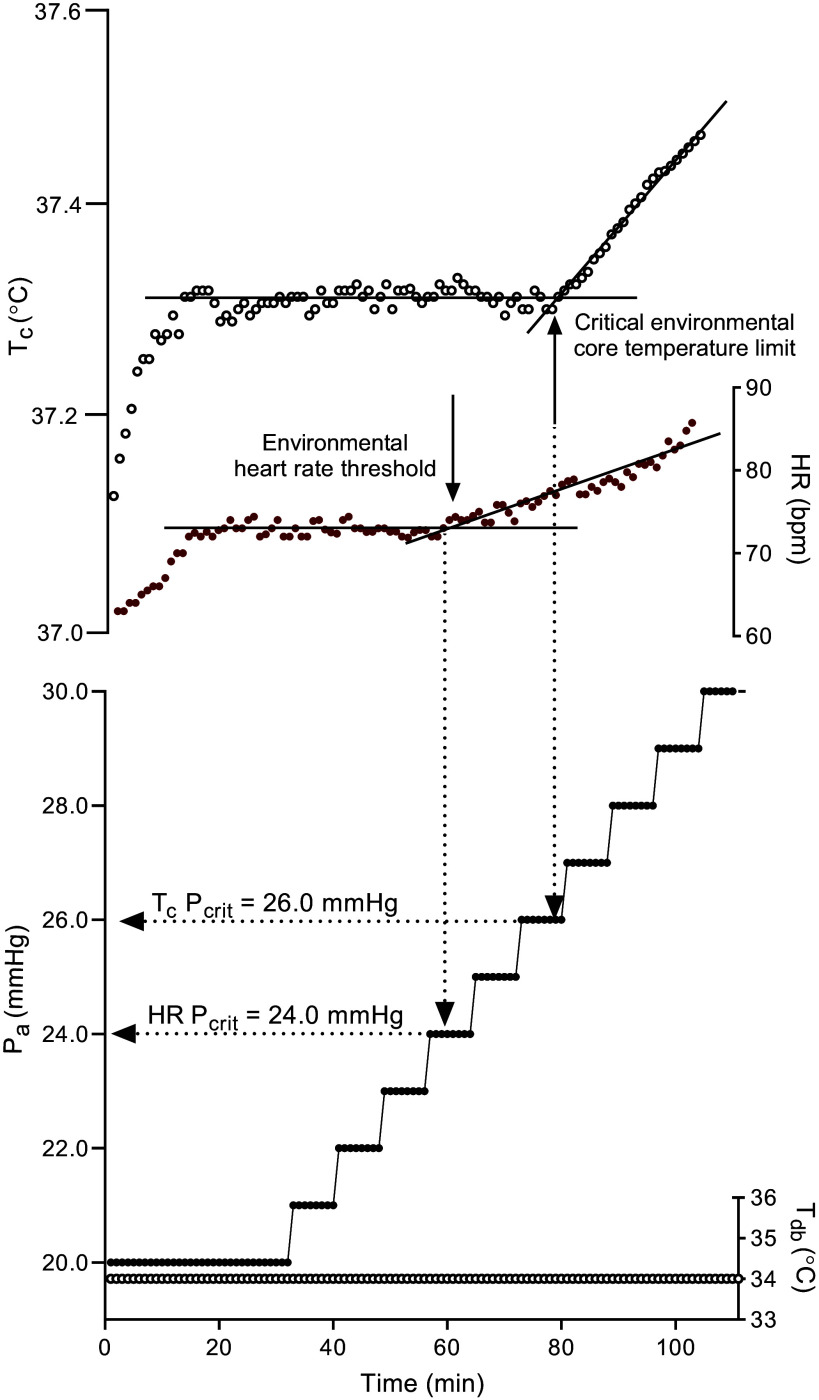
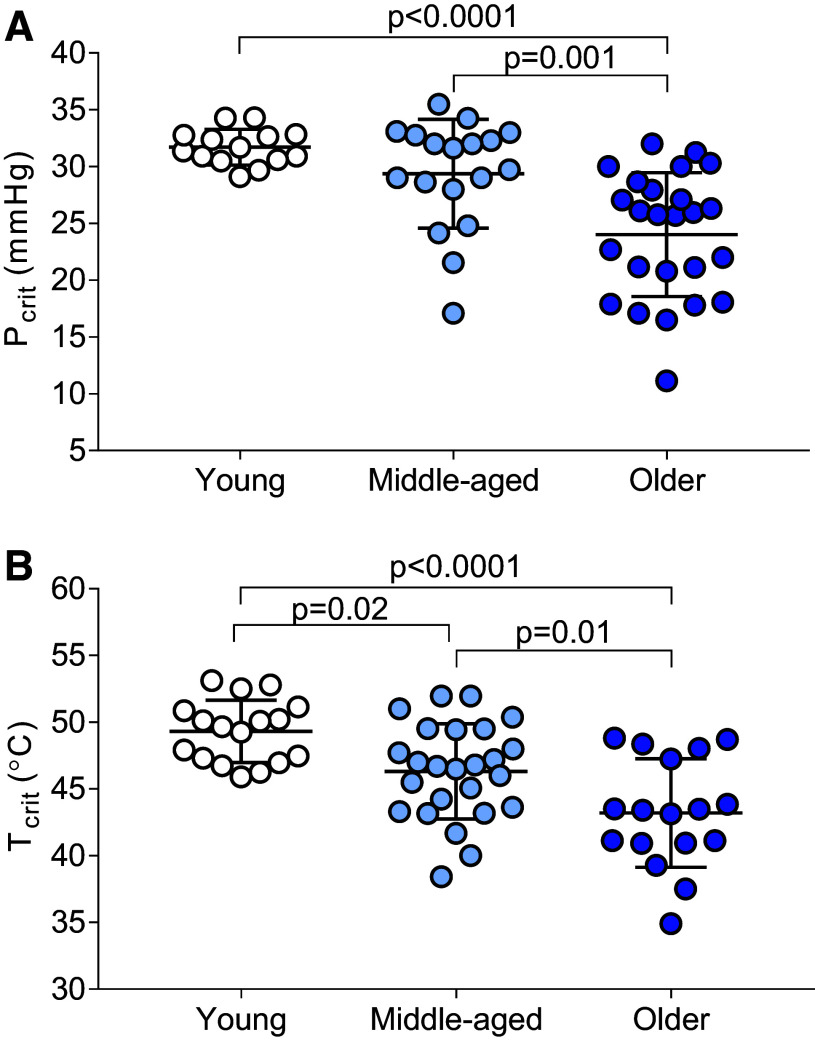
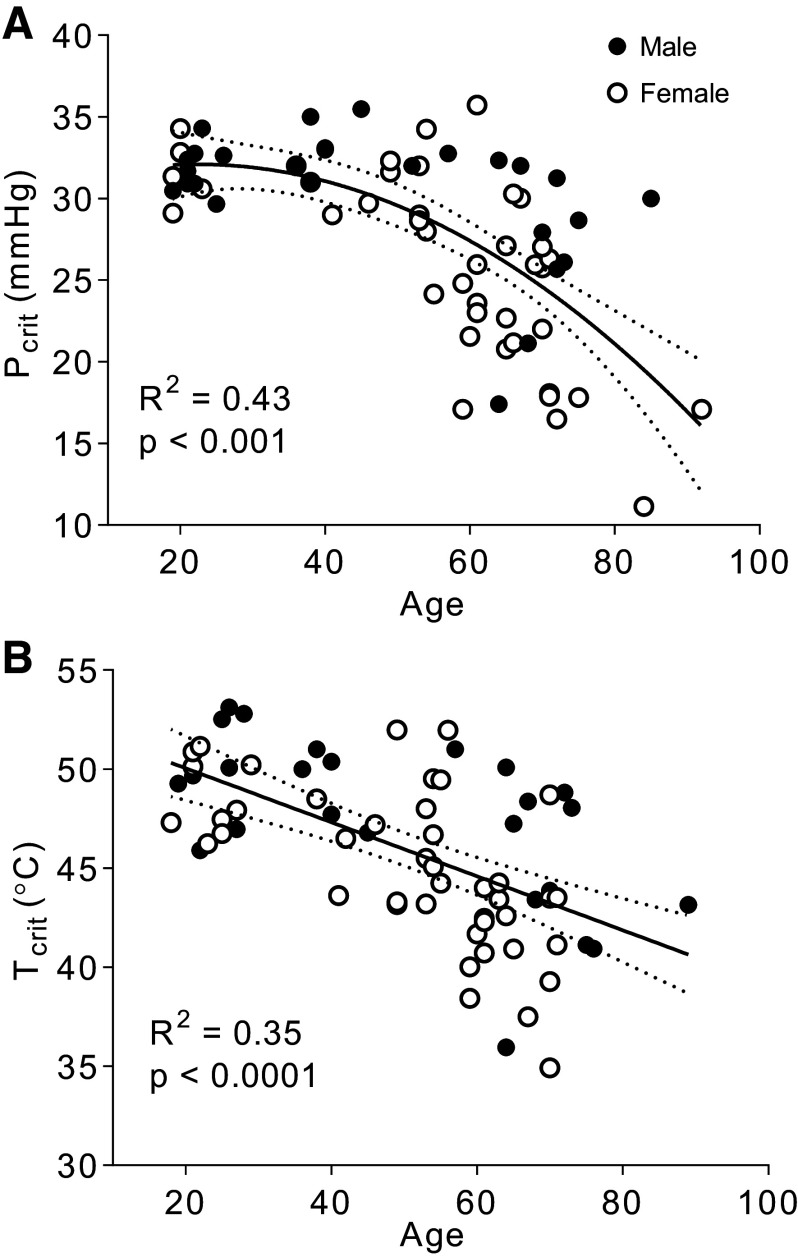
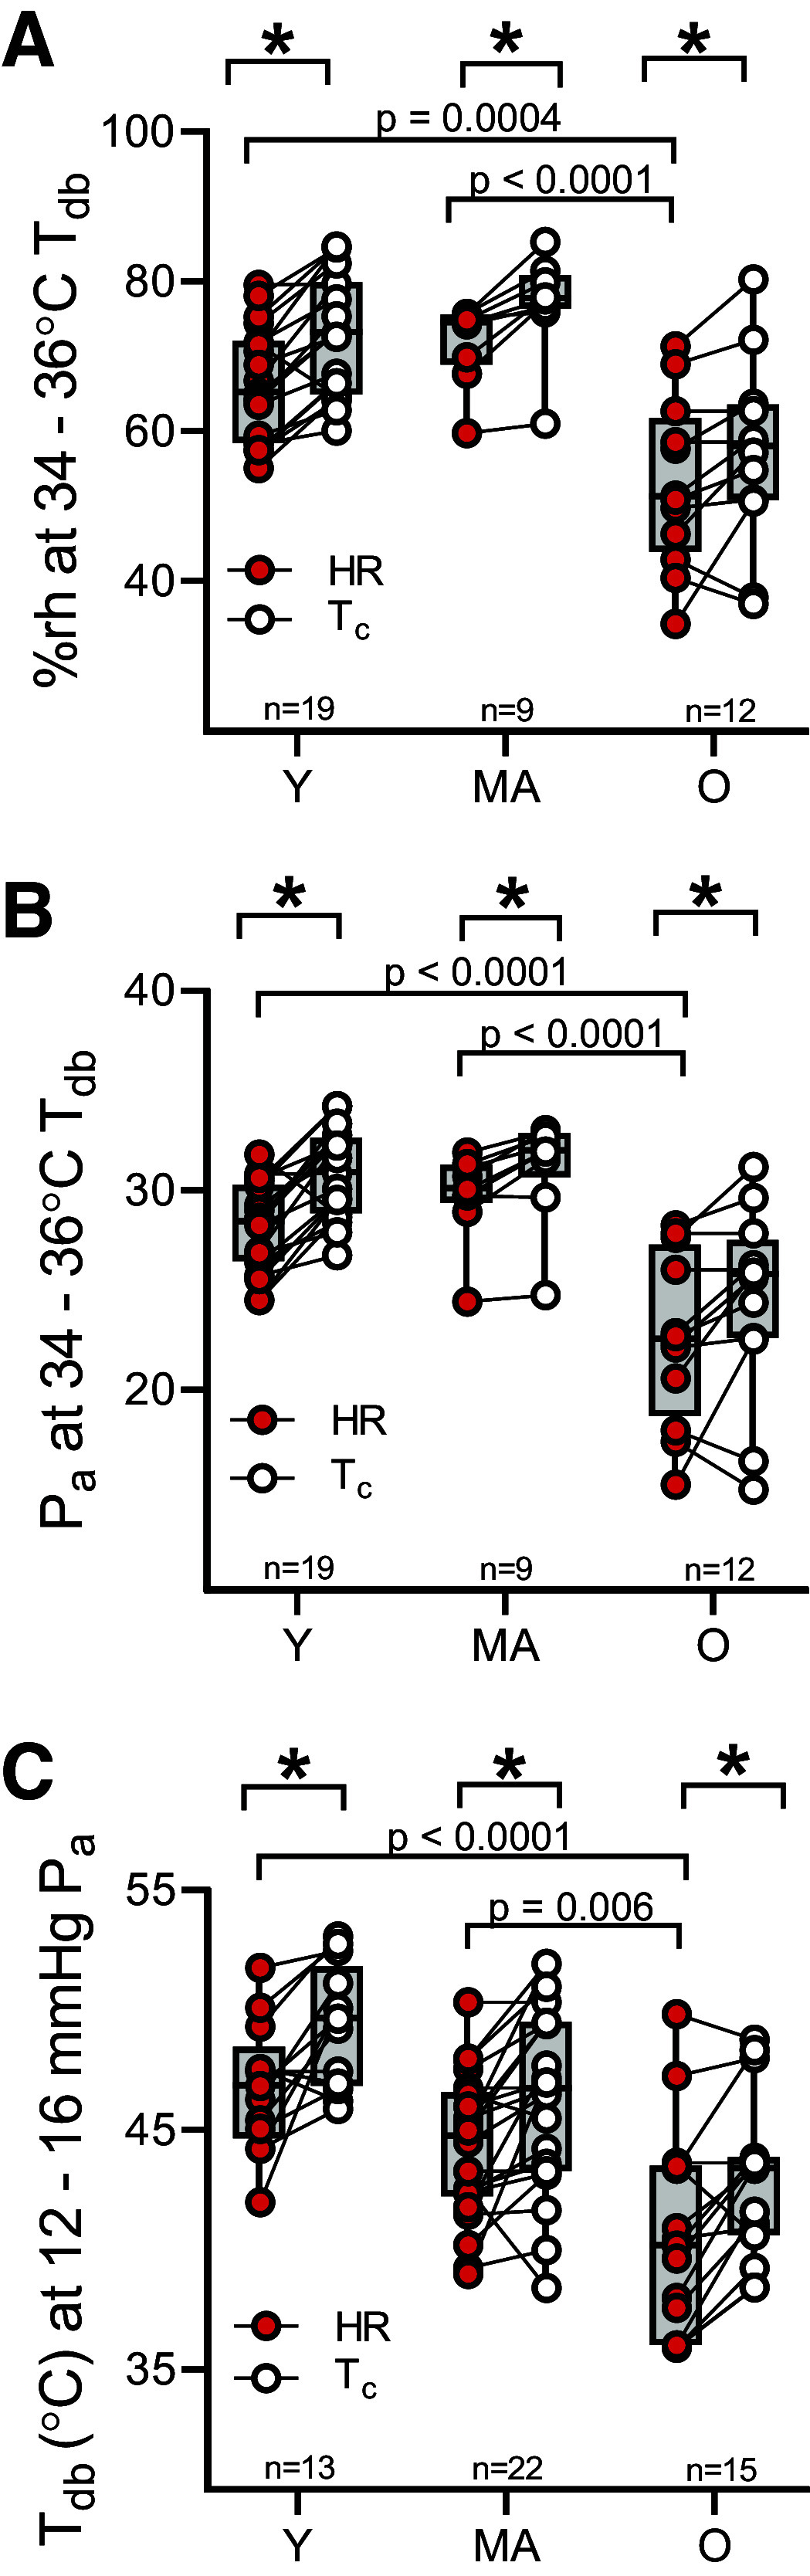
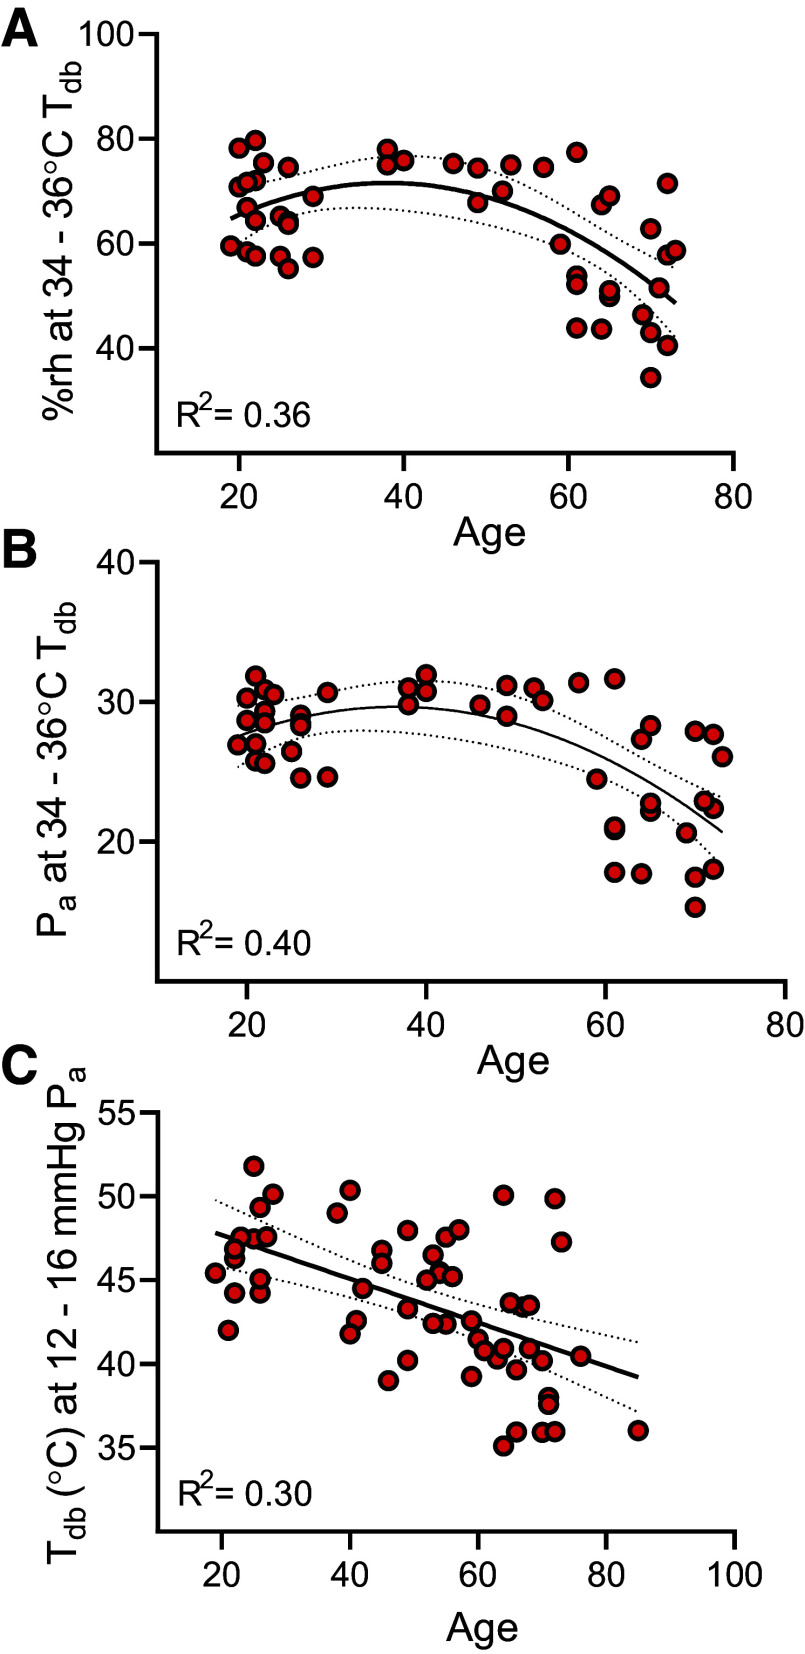
The frequency, duration, and severity of extreme heat events have increased and are projected to continue to increase throughout the next century. As a result, there is an increased risk of excessive heat- and cardiovascular-related morbidity and mortality during these extreme heat events. Therefore, the purposes of this investigation were to establish 1) critical environmental core temperature (Tc) limits for middle-aged adults (MA), 2) environmental thresholds that cause heart rate (HR) to progressively rise in MA and older (O) adults, and 3) examine critical environmental Tc limits and HR environmental thresholds across the adult age span. Thirty-three young (Y) (15 F; 23 ± 3 yr), 28 MA (17 F; 51 ± 6 yr), and 31 O (16 F; 70 ± 3 yr) subjects were exposed to progressive heat stress in an environmental chamber in a warm-humid (WH, 34-36°C, 50-90% rh) and a hot-dry (HD, 38°C-52°C, <30% rh) environment while exercising at a low metabolic rate reflecting activities of daily living (∼1.8 METs). In both environments, there was a main effect of age on the critical environmental Tc limit and environmental HR thresholds (main effect of age all P < 0.001). Across the lifespan, critical environmental Tc and HR thresholds decline linearly with age in HD environments (R2 ≥ 0.3) and curvilinearly in WH environments (R2 ≥ 0.4). These data support an age-associated shift in critical environmental Tc limits and HR thresholds toward lower environmental conditions and can be used to develop evidence-based safety guidelines to minimize future heat-related morbidity and mortality across the adult age span.NEW & NOTEWORTHY This study is the first to identify critical environmental core temperature and heart rate thresholds across the adult age spectrum. In addition, our data demonstrate that the rate of decline in Tc and HR limits with age is environmental-dependent. These findings provide strong empirical data for the development of safety guidelines and policy decisions to mitigate excessive heat- and cardiovascular-related morbidity and mortality for impending heat events.

Keywords: aging; cardiovascular responses; climate change; heat balance; heat wave.


Conflict of interest statement

W. L.K. is an associate editor of Journal of Applied Physiology and was not involved and did not have access to information regarding the peer-review process or final disposition of this article. An alternate editor oversaw the peer-review and decision-making process for this article. None of the other authors has any conflicts of interest, financial or otherwise, to disclose.

Figures

None
Graphical abstract
Figure 1.
Figure 1.
Representative tracing of one participant of the time course of core (gastrointestinal) temperature (Tc; open circles), heart rate (HR; red circles), dry-bulb temperature (Tdb), and ambient water vapor pressure (Pa) for one subject during a progressive heat stress protocol. Lines are drawn through the data points to represent the equilibration and postinflection phases. The bottom demonstrates the stepwise progression of Pa in a trial with constant Tdb (34°C). The point at which the lines intersect for Tc represents the critical environmental limit (i.e., the point at which heat stress becomes uncompensable). The point at which the lines intersect for HR represents the initiation of the progressive rise in HR (i.e., environmental HR threshold).
Figure 2.
Figure 2.
Age comparisons of critical environmental limits in warm-humid (A) and hot-dry (B) environments. Group comparisons were made using one-way ANOVA with Tukey’s post hoc pairwise comparisons. In warm-humid n = 14 for young, n = 18 for middle-aged, and n = 25 older. In hot-dry, n = 17 for young, n = 25 for middle-aged, and n = 17 for older.
Figure 3.
Figure 3.
Associations between critical water vapor pressure (Pa) in the warm-humid condition (A) and critical dry-bulb temperature (Tdb) in the hot-dry condition (B) with age. Data were analyzed using curvilinear regression (A) and simple linear regression analyses (B). For A and B, n = 68.
Figure 4.
Figure 4.
Environmental loci for HR (red circles) and Tc (open circles) inflection points for young (Y), middle-aged (MA), and older (O) adults during warm-humid (A and B) and hot-dry (C) trials. Each individual’s response is illustrated by connecting lines. Paired samples t -test were used to compare envionrmental conditions between HR and Tc inflections points. A one-way ANOVA was used to examine the difference in Tdb, Pa, and rh at the HR threshold between age groups for both environmental conditions. *P < 0.05 between HR and Tc critical environmental loci. HR, heart rate; Tc core temperature; rh, relative humidity; Pa, ambient water vapor pressure; Tdb, ambient dry-bulb temperature.
Figure 5.
Figure 5.
Environmental loci for HR inflection points for warm-humid (A and B) and hot-dry (C) environments for each participant across the age span. A nonlinear regression with a curvilinear curve fit best described the data for warm-humid environments, whereas a linear regression best described the data for the hot-dry environments. HR, heart rate. n = 49 in A and B. n = 59 in C.

Similar articles

Cited by

References

    1. Meehl GA, Tebaldi C. More intense, more frequent, and longer lasting heat waves in the 21st century. Science 305: 994–997, 2004. doi: 10.1126/science.1098704. - DOI - PubMed
    1. Fischer E, Sippel S, Knutti R. Increasing probability of record-shattering climate extremes. Nat Clim Chang 11: 689–695, 2021. doi: 10.1038/s41558-021-01092-9. - DOI
    1. Weinberger KR, Harris D, Spangler KR, Zanobetti A, Wellenius GA. Estimating the number of excess deaths attributable to heat in 297 United States counties. Environ Epidemiol 4: e096, 2020. doi: 10.1097/EE9.0000000000000096. - DOI - PMC - PubMed
    1. Vaidyanathan A, Malilay J, Schramm P, Saha S. Heat-related deaths - United States, 2004–2018. MMWR Morb Mortal Wkly Rep 69: 729–734, 2020. doi: 10.15585/mmwr.mm6924a1. - DOI - PMC - PubMed
    1. Ballester J, Quijal-Zamorano M, Méndez Turrubiates RF, Pegenaute F, Herrmann FR, Robine JM, Basagaña X, Tonne C, Antó JM, Achebak H. Heat-related mortality in Europe during the summer of 2022. Nat Med 29: 1857–1866, 2023. [Erratum in Nat Med 30: 603, 2024]. doi: 10.1038/s41591-023-02419-z. - DOI - PMC - PubMed

LinkOut - more resources