. 2024 Jun;18(3):103-117.
doi: 10.1049/syb2.12092. Epub 2024 May 30.

Gene signatures of endoplasmic reticulum stress and mitophagy for prognostic risk prediction in lung adenocarcinoma

Affiliations

Gene signatures of endoplasmic reticulum stress and mitophagy for prognostic risk prediction in lung adenocarcinoma

Xiong Lin et al. IET Syst Biol. 2024 Jun.

Abstract

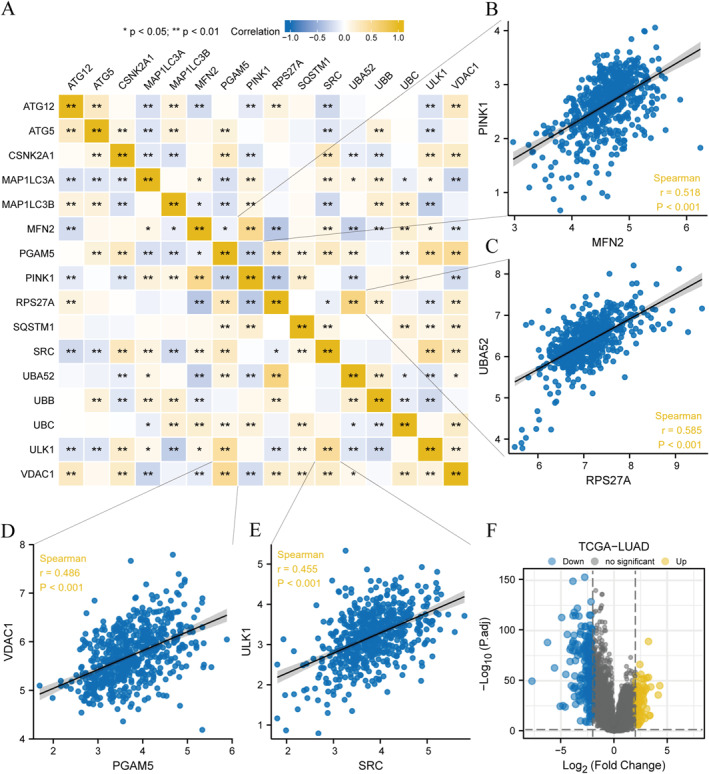
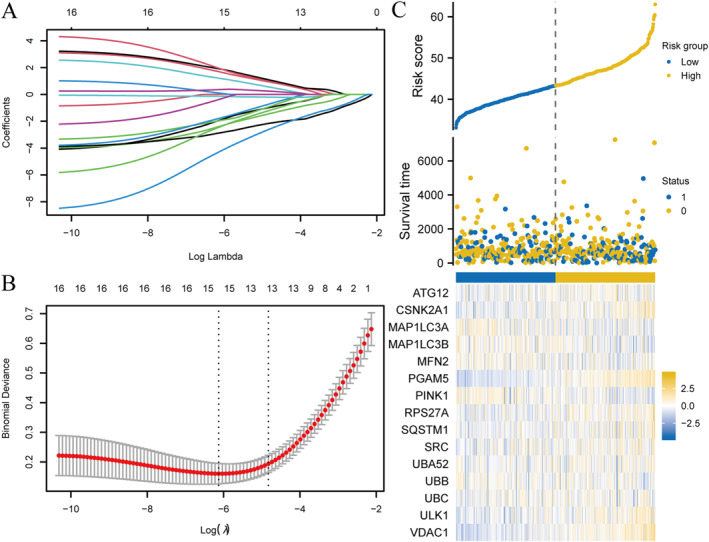
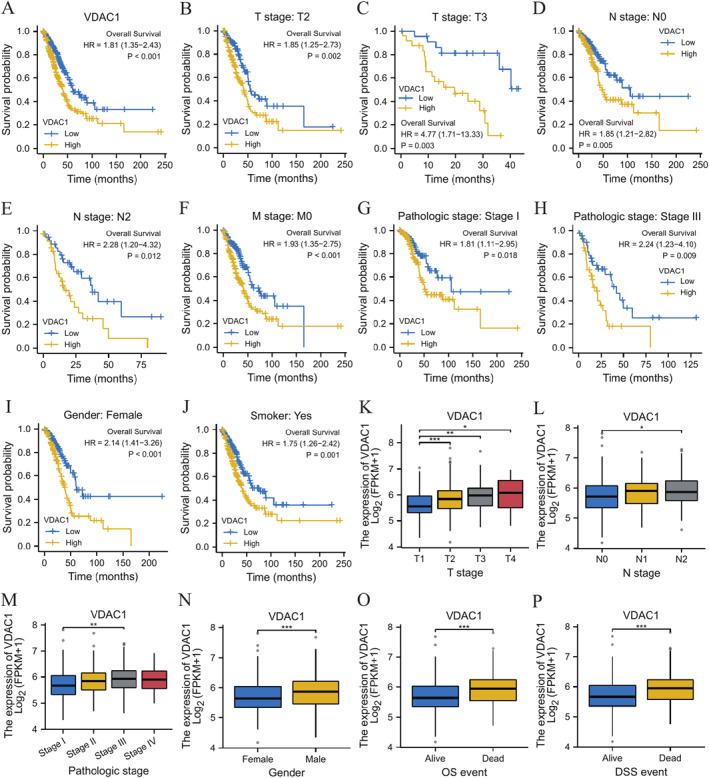
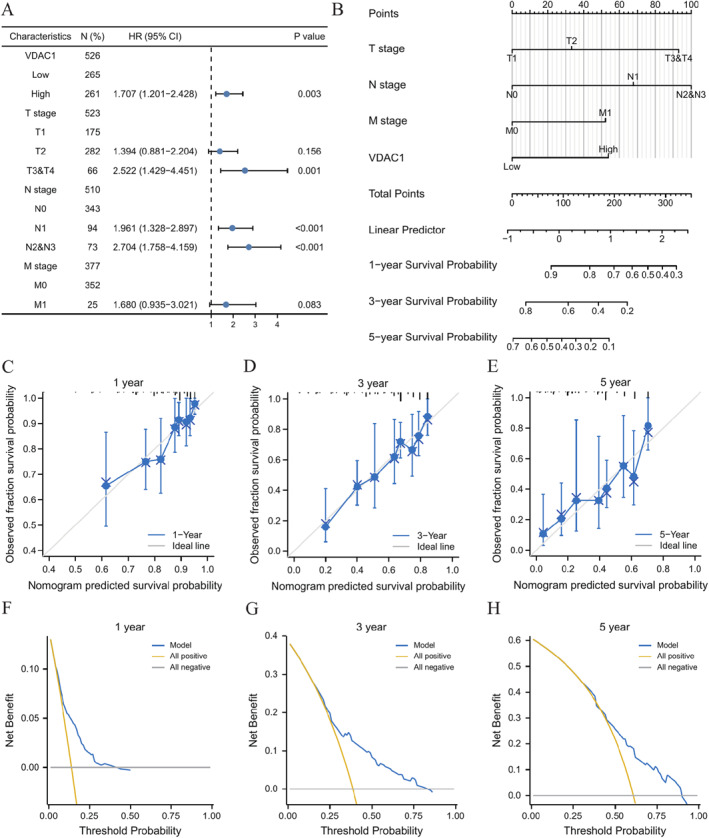
Genes associated with endoplasmic reticulum stress (ERS) and mitophagy can be conducive to predicting solid tumour prognosis. The authors aimed to develop a prognosis prediction model for these genes in lung adenocarcinoma (LUAD). Relevant gene expression and clinical information were collected from public databases including Gene Expression Omnibus (GEO) and The Cancer Genome Atlas (TCGA). A total of 265 differentially expressed genes was finally selected (71 up-regulated and 194 downregulated) in the LUAD dataset. Among these, 15 candidate ERS and mitophagy genes (ATG12, CSNK2A1, MAP1LC3A, MAP1LC3B, MFN2, PGAM5, PINK1, RPS27A, SQSTM1, SRC, UBA52, UBB, UBC, ULK1, and VDAC1) might be critical to LUAD based on the expression analysis after crossing with the ERS and mitochondrial autophagy genes. The prediction model demonstrated the ability to effectively predict the 5-, 3-, and 1-year prognoses of LUAD patients in both GEO and TCGA databases. Moreover, high VDAC1 expression was associated with poor overall survival in LUAD (p < 0.001), suggesting it might be a critical gene for LUAD prognosis prediction. Overall, the prognosis model based on ERS and mitophagy genes in LUAD can be useful for evaluating the prognosis of patients with LUAD, and VDAC1 may serve as a promising biomarker for LUAD prognosis.

Keywords: bioinformatics; genomics; lung; tumours.


Conflict of interest statement

The authors declare that they have no conflict of interest.

Figures

FIGURE 1
FIGURE 1
Relationship analysis of ERS and mitophagy genes in the TCGA‐LUAD dataset and differential analysis. (a) The relationship heat map results of ERS and mitophagy genes within the dataset of TCGA‐LUAD. (b) The relationship scatter plot display of MFN2 and PINK1. (c) The relationship scatter plot display of RPS27A with UBA52. (d) The relationship scatter plot display of PGAM5 and VDAC. (e) The relationship scatter plot display of PGAM5 and VDAC1. (f) The volcano plot of the differential expression gene investigation of samples of cancer and normal group within the dataset of TCGA‐LUAD. ns is p ≥ 0.05; * is p < 0.05; ** is p < 0.01; *** is p < 0.001. ERS, endoplasmic reticulum stress; LUAD, lung adenocarcinoma; TCGA, the cancer genome Atlas.
FIGURE 2
FIGURE 2
Construction of the prognosis model on ERS and mitophagy genes. (a) Prognosis model plot of LASSO regression for ERS and mitophagy genes. Variable trajectory map (b) and risk factor map (c) of the LASSO regression prognosis model. The ordinate of the LASSO regression prognosis model diagram (a) can represent the likelihood deviation value of the LASSO regression, and the lower x‐axis log (λ) value by default can represent the case after the log made by the lambda coefficient of the penalty term in the LASSO regression; variables' number with a non‐0 coefficient under the respective lambda can be represented by the number of the upper x‐axis. Blue dots in the scatter section of the risk factor chart (c) represent deceased patients, and yellow dots represent surviving patients. Least absolute shrinkage and selection operator abbreviated as LASSO. ERS, endoplasmic reticulum stress.
FIGURE 3
FIGURE 3
Functional Enrichment analysis (GO) and pathway Enrichment analysis (KEGG) for ERS and mitophagy genes. (a) Bar graph presentation of GO and KEGG enrichment analysis results. (b) Circular network plot presentation of the GO enrichment analysis results. (c) Divergence network plot presentation of the KEGG enrichment analysis results. The bubble chart (d) and circle chart (e) of GO and KEGG enrichment analysis results of the combined logFC for ERS and mitophagy genes. Yellow dots in the network plot (b, c) represent specific genes, and blue circles represent specific pathways. Yellow dots in the circle chart (d) represent increased genes (logFC >0), and brown dots represent down‐regulated genes (logFC <0). BP, Biological process. CC, Cellular component. ERS, endoplasmic reticulum stress; GO, gene ontology; KEGG, Kyoto encyclopaedia of genes and genomes; MF, molecular function.
FIGURE 4
FIGURE 4
The GSEA. (a) The main seven biological characteristics of GSEA in TCGA‐LUAD datasets. (b–h) Genes in TCGA‐LUAD datasets were notably enriched in the above‐mentioned pathways, such as dectin 1 mediated noncanonical NF кB signalling (b), negative regulation of NOTCH4 signalling (c), TNFR2 non canonical NF кB pathway (d), signalling by NOTCH (e), HEDGEHOG ligand biogenesis (f), MAPK6 MAPK4 signalling (g), TCF dependent signalling in response to WNT (h). GSEA, gene set enrichment analysis; LUAD, lung adenocarcinoma; TCGA, the cancer genome Atlas.
FIGURE 5
FIGURE 5
The GSVA. (a, b) The heatmap (a) displays of functional scores in GSVA of the dataset of TCGA‐LUAD and the group comparison diagram of representative enriched pathways of the LUAD cancer group and the normal group. (b) With the horizontal axis of the heat map (a) as a sample, the vertical axis can represent a biological function, the colour of the node can represent the activation or inhibition of the corresponding function, blue can represent inhibition, and yellow can represent activation. * is p < 0.05; *** is p < 0.001. GSVA, gene set variation analysis; LUAD, lung adenocarcinoma; TCGA, the cancer genome Atlas.
FIGURE 6
FIGURE 6
ERS and mitophagy‐related gene (EMRG) scores were built. (a, b) The group comparison diagram of EMRG scores within the dataset of TCGA‐LUAD (a), and the ROC curve display (b). The group comparison diagram of EMRG scores in the GSE40791 dataset (c) and the ROC curve display (d). The prognosis KM curve (e) and the group comparison Fig. (f) of mitophagy score of high and low EMRG scores within the dataset of TCGA‐LUAD. EMRG: ERS and mitophagy‐related genes. ERS, endoplasmic reticulum stress; KM, Kaplan–Meier; LUAD, lung adenocarcinoma; ROC, receiver operating characteristic curve; TCGA, the cancer genome Atlas.
FIGURE 7
FIGURE 7
Prognosis analysis and clinical relevance analysis. (a) The KM curve of the prognosis analysis of gene VDAC1. The KM curve of the prognosis analysis of VDAC1‐T stage (T2) (b), VDAC1‐T stage (T3) (c), VDAC1‐N stage (N0) (d), VDAC1‐N stage (N2) (e), VDAC1–M stage (M0) (f), VDAC1‐Pathologic stage (stage I) (g), VDAC1‐Pathologic stage (stage III) (h), VDAC1‐gender (female) (i), VDAC1‐smoker (yes) (j). The KM curve, and the Kaplan–Meier curve. The clinical relationship analysis of gene VDAC1 at T stage (k), N stage (l), Pathologic stage (m), Gender (n), OS event (o), and DSS event (p). The ns is p ≥ 0.05; *p < 0.05; **p < 0.01; ***p < 0.001. KM, Kaplan–Meier.
FIGURE 8
FIGURE 8
Clinical relationship analysis of the prognosis. The forest graph (a) and nomogram (b) of the multivariate Cox regression analysis. The calibration curve of the nomogram analysis of the multivariate Cox regression model for 1‐year (c), 3‐year (d), and 5‐year (e). The DCA diagram of the LASSO‐Cox regression prognosis model for 1‐year (f), 3‐year (g), and 5‐year (h). The probability threshold or threshold probability can be represented by the DCA figure's x‐axis, and the net gain can be represented by the y‐axis. DCA, decision curve analysis. LASSO, the least absolute shrinkage and selection operator.

Similar articles

Cited by

References

    1. Sung, H. , et al.: Global cancer statistics 2020: GLOBOCAN estimates of incidence and mortality worldwide for 36 cancers in 185 countries. CA. Cancer J. Clin. 71(3), 209–249 (2021). 10.3322/caac.21660 - DOI - PubMed
    1. Molina, J.R. , et al.: Non‐small cell lung cancer: epidemiology, risk factors, treatment, and survivorship. Mayo Clin. Proc. 83(5), 584–594 (2008). 10.4065/83.5.584 - DOI - PMC - PubMed
    1. Chiba, R. , et al.: Elemental and mutational analysis of lung tissue in lung adenocarcinoma patients. Transl. Lung Cancer Res. 8(Suppl 3), S224–S234 (2019). 10.21037/tlcr.2019.08.18 - DOI - PMC - PubMed
    1. Chen, Z. , et al.: Non‐small‐cell lung cancers: a heterogeneous set of diseases. Nat. Rev. Cancer 14(8), 535–546 (2014). 10.1038/nrc3775 - DOI - PMC - PubMed
    1. Siegel, R.L. , et al.: Cancer statistics, 2022. CA Cancer J Clin 72(1), 7–33 (2022). 10.3322/caac.21708 - DOI - PubMed

MeSH terms

Substances