. 2024 Nov 1;109(11):3650-3669.
doi: 10.3324/haematol.2024.285099.

LILRB4 represents a promising target for immunotherapy by dual targeting tumor cells and myeloid-derived suppressive cells in multiple myeloma

Affiliations

LILRB4 represents a promising target for immunotherapy by dual targeting tumor cells and myeloid-derived suppressive cells in multiple myeloma

Lixin Gong et al. Haematologica. .

Abstract

Multiple myeloma (MM) remains an incurable hematologic malignancy. Despite tremendous advances in the treatment of this disease, about 10% of patients still have very poor outcomes with a median overall survival of less than 24 months. Our study aimed to underscore the critical mechanisms pertaining to rapid disease progression and provide novel therapeutic choices for these ultrahigh-risk patients. We utilized single-cell transcriptomic sequencing to dissect the characteristic bone marrow niche of patients who survived less than 2 years (EM24). Notably, enrichment of a LILRB4high pre-mature plasma-cell cluster was observed in EM24 patients compared to patients with durable remission. This cluster exhibited aggressive proliferation and a drug-resistance phenotype. High levels of LILRB4 promoted MM clonogenicity and progression. Clinically, high expression of LILRB4 was correlated with poor prognosis in both newly diagnosed MM patients and relapsed/ refractory MM patients. ATAC-sequencing analysis identified that pronounced chromosomal accessibility caused the elevation of LILRB4 on MM cells. CRISPR-Cas9 deletion of LILRB4 alleviated the growth of MM cells, inhibited the immunosuppressive function of myeloid-derived suppressive cells (MDSC), and further rescued T-cell dysfunction in the MM microenvironment. Greater infiltration of MDSC was observed in EM24 patients. We therefore generated an innovative T-cell receptor-based chimeric antigen receptor T cell, LILRB4-STAR-T. Cytotoxicity experiments demonstrated that LILRB4-STAR-T cells efficaciously eliminated tumor cells and impeded MDSC function. In conclusion, our study elucidates that LILRB4 is an ideal biomarker and promising immunotherapy target for high-risk MM. LILRB4-STAR-T-cell immunotherapy is promising against both tumor cells and the immunosuppressive tumor microenvironment in MM.


Figures
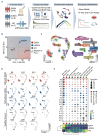
Figure 1.
Figure 1.
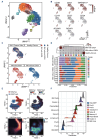
Single-cell transcriptomics profiling of the bone marrow ecosystem in patients with multiple myeloma. (A) Schematic representation of the experimental strategy based on in-house and outsourced data. Bone marrow mononuclear cells from seven healthy donors (HD), four patients with multiple myeloma who died within 24 months (EM24), and eight who did not die within 24 months (nEM24) were measured by 10× Genomics-based single-cell RNA sequencing. Multi-omics data and biological assays were applied to validate our findings. (B) Two-dimensional plots showing the distribution of each sample. The small circles represent individual patients, the color indicates the patients’ group. Triangles represent the median of the principal component analysis. (C) Uniform manifold approximation and projection (UMAP) plots showing cell clusters (left panel) and cell annotation (right panel) by color. (D) UMAP projections of cells from each sample. Sample names and sample groups are labeled in the figure. (E) Top. Bubble plots showing the proportion of each cell type in each sample. Samples were divided into EM24 MM patients (red), nEM24 MM patients (blue), and HD (gray). Bottom. Heatmap plot illustrating the odds ratio (OR) for each cell in each sample group based on a Fisher exact test. A high OR with an asterisk indicates that the cell is more likely to distribute in the group, while a low OR with an asterisk indicates that the cell is less likely to distribute in the group. scRNAseq: single-cell RNA sequencing; BMNC: bone marrow mononuclear cells; BCR: B-cell receptor; WES: whole-exome sequencing; Dim: dimension; PCA: principal component analysis; MM: multiple myeloma; NK: natural killer; HSC: hematopoietic stem cells.
Figure 2.
Figure 2.
Characteristics of plasma cells in EM24 multiple myeloma patients. (A) Uniform manifold approximation and projection (UMAP) plot showing ten plasma cell clusters from all samples. (B) UMAP plots showing the expression of marker genes in plasma cells. (C) UMAP plots showing data for plasma cells from healthy donors, from multiple myeloma (MM) patients who died within 24 months (EM24), and from MM patients who did not die within 24 months (nEM24). (D) Top. Heatmap plot illustrating the odds ratio of each cluster in each sample group based on a Fisher exact test. Bottom. Bar plot showing the proportion of each cluster in each MM sample and healthy donor. (E) Top. T-distributed stochastic neighbor embedding point and density plots showing the distribution of epigenetically controlled genes. Bottom. Fitted density plot illustrating the H3K27ac-regulated and H3K27me3-regulated gene signal from chromatin immunoprecipitation sequencing data. (F) Density line plot showing the distribution of cells of plasma-cell lineage along with the pseudotime. HD: healthy donor; OR: odds ratio; TSNE: T-distributed stochastic neighbor embedded; HSC: hematopoietic stem cells cells; MPP: multipotent blood progenitors.
Figure 3.
Figure 3.
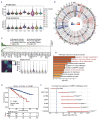
Genomic alterations and high-risk gene identification in sub-C4 plasma cells. (A) Violin plots showing the cell scores for proliferation and drug resistance in multiple myeloma (MM) cell clusters. (B) Circular genomic map illustrating copy number variations in MM cell clusters. Each lane indicates one cell cluster and the outmost lane indicates chromosome structure. Red represents amplification and blue represents deletion. (C) Top. Waterfall plot displaying 63 mutational driver genes in 947 MM patients of the MMRF-CoMMpass cohort. Bottom left. Fitted density plot showing mutational scores of driver genes in plasma cells. Bottom right. Violin plot showing the mutational score in MM cell clusters. (D) Bar chart showing enriched pathways in gene modules specific to sub-C4. The analysis was performed by Metascape. (E) Kaplan-Meier curves showing the overall survival of 414 MM patients with a high or low proportion of sub-C4 in the GSE2658. A log-rank test was applied for the comparison between groups. (F) Forest plot showing the hazard ratios (blue dots) and 95% confidence intervals (red lines), as determined by univariate Cox regression, for seven genes in the MMRF-CoMMpass cohort. *P<0.05, **P<0.01, ***P<0.001.
Figure 4.
Figure 4.
The expression pattern of the top gene, LILRB4, in multiple myeloma cells. (A) Fitted density plots illustrating the expression of seven specific genes in plasma cells selected by the lasso regression. algorithm. (B) Bar chart showing the expression of LILRB4 in UAMS-7. (C) Bar plot illustrating LILRB4 expression in healthy individuals and patients with monoclonal gammopathy of undetermined significance, smoldering multiple myeloma or multiple myeloma (MM). (D) Kaplan-Meier curve showing the overall survival of newly diagnosed MM (NDMM) patients (left panel, GSE2658) and relapsed/refractory MM (RRMM) patients (right panel, GSE57317) with high or low expression of LILRB4. A log-rank test was applied in the comparison between groups. (E) Left and middle. Density dot plots and line charts of flow cytometry analysis displaying the expression of LILRB4 protein in the population of plasma cells, malignant plasma cells, pre-plasma cells, and normal plasma cells from bone marrow aspirates of NDMM and RRMM patients. Right. Bar plot showing the statistical differences between different plasma-cell populations. Unpaired t test, ***P<0.001. (F) Left. Bar plot showing the percentage LILRB4 expression, detected by flow cytometry, in MM cells in NDMM patients (N=49), in MM patients after treatment (N=31), and in RRMM patients (N=12). Right. Dot plot showing mRNA expression of LILRB4 in NDMM and RRMM patients. Unpaired t test, *P<0.05, ****P<0.0001. (G) Density dot plots of flow cytometry analysis displaying LILRB4+ and LILRB4- MM cells. Optical microscope images showing the colony formation assay of LILRB4+ and LILRB4-cells (5X magnification). Unpaired t test, *P<0.05, **P<0.01. UAMS: University of Arkansas Medical School; MM: multiple myeloma; HY: hyperdiploid; CD1: spiked CCND1/CCND3 expression; MS: spiked MMSET expression; CD2: spiked CCND1/CCND3 expression; LB: low bone disease; PR: proliferation; MF: MAF/MAFB spikes; HD: healthy donors; MGUS: monoclonal gammopathy of undetermined significance; SMM: smoldering multiple myeloma; MPC: malignant plasma cells; NPC: normal plasma cells; pre-PC: pre-plasma cells; WT: wild-type.
Figure 5.
Figure 5.
LILRB4 plays faceted roles in the progression of multiple myeloma. (A) Left. Flow cytometry detection of LILRB4 in non-target (NT) and LILRB4 knock-out (KO) multiple myeloma (MM) cells. Right. Growth of LILRB4-KO cells relative to NT MM cells. (B) Colony formation assay of LILRB4-KO cells relative to NT MM cells (5X magnification). (C) Transwell invasion assay of LILRB4-KO cells relative to NT MM cells. (D) Cellular apoptosis detection of NT cells and LILRB4-KO MM cells. (E) Bar chart showing cytotoxicity towards NT cells and LILRB4-KO MM cells by carfilzomib at 48 h. (F) The H929-NT and H929-KO cells were injected subcutaneously into the left and right flank of the same mouse. A line plot showing the measurement of tumor volume every other day between H929-NT and H929-KO groups. Bar graphs showing the statistical difference of tumor weight between animals in the H929-NT and H929-KO groups. Unpaired t test, *P<0.05, **P<0.01, ***P<0.001, ****P<0.0001.
Figure 6.
Figure 6.
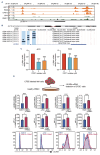
The regulated mechanisms underlying LILRB4 expression in multiple myeloma cells. (A) ATAC-sequencing unveiling a significant increase in chromatin accessibility within the promoter region of the LILRB4 gene in multiple myeloma (MM) cell lines exhibiting elevated expression levels of LILRB4. (B) STAT1 ChIP-sequencing reads enriched in the LILRB4 promoter region. (C) LILRB4 mRNA expression in MM cells treated with the STAT1 inhibitor, fludarabine, for 48 h. (D) Top. Schematic diagram showing the experimental process of MM cells co-cultured with healthy peripheral blood mononuclear cells for 72 h. Middle. The bar charts show LILRB4 mRNA expression and LILRB4 mean fluorescence intensity in MM cells after co-culture. Bottom. The histograms show the flow cytometry examination of LILRB4 in MM cells after co-culture. CFSE: carboxyfluorescein succinimidyl ester; PBMC: peripheral blood mononuclear cells; MFI: mean fluorescence intensity.
Figure 7.
Figure 7.
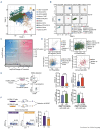
High infiltration of immunosuppressive myeloid cells in EM24 multiple myeloma patients. (A) T-distributed stochastic neighbor embedding (TSNE) plots showing the distribution of annotated myeloid cells. Cell annotations are labeled by colors. (B) TSNE plots showing the marker gene expression of each cell cluster. (C) Point plot displaying changes in myeloid cell composition between patients who died early (early mortality within 24 months; EM24) and patients without early death (nEM24). For each cell type, two axes indicate the log fold change in mean cell fraction between the two groups, with -log10 two-sided Wilcoxon rank sum P values. (D) Scatterplots showing dendritic cell migratory and activated scores (top left), pro- and anti-inflammatory scores (top right), M1 and M2 polarization scores (bottom left), and immune activation and suppression scores (bottom right) for colored myeloid cell types. Triangles represent the median of the cell scores. (E) Left. Schematic diagram showing the experimental procedure. Multiple myeloma (MM) cells were co-cultured with peripheral blood mononuclear cells (PBMC) from healthy donors and then the differentiation of myeloid-derived suppressive cells (MDSC) and T-cell proportion were measured. Right. Bar charts showing the proportion of MDSC and CD3+ T cells in PBMC after co-culture with H929 MM cells with different LILRB4 levels. Statistical analysis using a two-tailed unpaired Student t test, *P<0.05, ****P<0.0001. (F) Top left. Schematic diagram of the experimental procedure. Non-target (NT) and LILRB4 knock-out (KO) H929 cells were injected subcutaneously into the mice, followed by detection of infiltrated MDSC in tumor samples. Bottom left. Density dot plots displaying the MDSC population in the NT and KO groups. Right. Bar chart showing the proportion of MDSC in myeloid cells between the NT and LILRB4-KO groups. Statistical analysis using a two-tailed unpaired Student t test, *P<0.05.
Figure 8.
Figure 8.
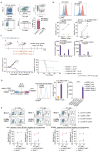
LILRB4 is a promising target for immunotherapy of multiple myeloma. (A) Density dot plots of flow cytometry analysis displaying the expression of LILRB4 protein in the population of monocytic myeloid-derived suppressive cells (M-MDSC) and granulocytic myeloid-derived suppressive cells (G-MDSC) from patients with multiple myeloma (MM). Strategies for gating are shown in the figure. Bottom right. Bar chart showing the expression of LILRB4 protein in M-MDSC and G-MDSC. (B) Top. Density line charts of the flow cytometry analysis displaying the expression of LILRB4 protein in NCI-H929 and U266 MM cells. Middle. Point plots showing the percentages of cell lysis of NCI-H929 and U266 MM cells co-cultured with mock-T cells (yellow) or LILRB4-targeted synthetic T-cell receptor and antigen receptor (STAR)-T cells (purple) under different effector:target (E:T) ratios and for different periods of incubation (middle panel). Bottom. Bar charts showing the concentration of interferon-g, interleukin-2, and tumor necrosis factor-a secreted by T cells after co-culture. (C) Top. Schematic of the monitoring of the anti-tumor function of LILRB4 STAR-T cells in a xenograft tumor model. Bottom left. Line charts illustrating the subcutaneous tumor volume in MM xenograft mice after treating mock-T cells or LILRB4-targeted STAR-T cells. The mean tumor volumes with standard error bars were calculated on specific days. Bottom right. Kaplan-Meier curve showing the survival of the MM xenografted mice. (D) Left. Experimental design. Middle. Density line charts of flow cytometry analysis displaying the expression of LILRB4 protein in M-MDSC. Right. Bar charts showing the percentage of cell lysis M-MDSC co-cultured with mock-T cells or LILRB4-targeted STAR-T cells and the concentration of interferon-g, IL-2 after co-culture. (E) Exemplary dot plots obtained in the flow cytometry-based LILRB4 STAR-T cell cytotoxicity assay. Bone marrow mononuclear cells from MM patients (N=9) were co-cultured with LILRB4 STAR-T or mock-transduced T cells at different E:T ratios. After 4 hours of incubation, specific lysis of CD38+LILRB4+ cells and CD11b+LILRB4+ immunosuppressive myeloid cells by LILRB4 STAR-T or mock-transduced T cells was quantified and calculated by flow cytometry using counting beads.

References

    1. Bazarbachi AH, Al Hamed R, Malard F, et al. . Relapsed refractory multiple myeloma: a comprehensive overview. Leukemia. 2019;33(10):2343-2357. - PubMed
    1. Kumar S, Baizer L, Callander NS, et al. . Gaps and opportunities in the treatment of relapsed-refractory multiple myeloma: consensus recommendations of the NCI Multiple Myeloma Steering Committee. Blood Cancer J. 2022;12(6):98. - PMC - PubMed
    1. Cowan AJ, Green DJ, Kwok M, et al. . Diagnosis and management of multiple myeloma: a review. JAMA. 2022;327(5):464-477. - PubMed
    1. Sonneveld P, Avet-Loiseau H, Lonial S, et al. . Treatment of multiple myeloma with high-risk cytogenetics: a consensus of the International Myeloma Working Group. Blood. 2016;127(24):2955-2962. - PMC - PubMed
    1. Ríos-Tamayo R, Sáinz J, Martínez-López J, et al. . Early mortality in multiple myeloma: the time-dependent impact of comorbidity: a population-based study in 621 real-life patients. Am J Hematol. 2016;91(7):700-704. - PubMed

MeSH terms

LinkOut - more resources