. 2024 Nov 1;109(11):3505-3519.
doi: 10.3324/haematol.2023.283471.

The glutamate/aspartate transporter EAAT1 is crucial for T-cell acute lymphoblastic leukemia proliferation and survival

Affiliations

The glutamate/aspartate transporter EAAT1 is crucial for T-cell acute lymphoblastic leukemia proliferation and survival

Vesna S Stanulović et al. Haematologica. .

Abstract

T-cell acute lymphoblastic leukemia (T-ALL) is a cancer of the immune system. Approximately 20% of pediatric and 50% of adult T-ALL patients have refractory disease or relapse and die from the disease. To improve patient outcome new therapeutics are needed. With the aim to identify new therapeutic targets, we combined the analysis of T-ALL gene expression and metabolism to identify the metabolic adaptations that T-ALL cells exhibit. We found that glutamine uptake is essential for T-ALL proliferation. Isotope tracing experiments showed that glutamine fuels aspartate synthesis through the tricarboxylic acid cycle and that glutamine and glutamine-derived aspartate together supply three nitrogen atoms in purines and all but one atom in pyrimidine rings. We show that the glutamate-aspartate transporter EAAT1 (SLC1A3), which is normally expressed in the central nervous system, is crucial for glutamine conversion to aspartate and nucleotides and that T-ALL cell proliferation depends on EAAT1 function. Through this work, we identify EAAT1 as a novel therapeutic target for T-ALL treatment.


Figures

Figure 1.
Figure 1.
Differential gene expression and gene ontology analysis for T-cell acute lymphoblastic leukemia cell lines. (A) Heat map showing hierarchical clustering of the significantly differentially expressed genes between the T-cell acute lymphoblastic leukemia (T-ALL) cell lines (ARR, DU.528, HSB2 and CCRF-CEM), healthy CD34+ cells isolated from umbilical cord blood and T-cell progenitors (CD7+ CD5- CD1a-, CD7+ CD5+ CD1a-, and CD7+ CD5+ CD1a+ CD3-) derived from the differentiation of CD34+ progenitors on OP9-DL4 stromal cells. RNA-sequencing (RNAseq) gene expression data are gene-normalized counts clustered based on Pearson correlation with average linkage clustering. Two clusters are marked by blue triangles and numbered 1 and 2. Scale bar represents gene normalized counts from 0 to 50. (B) Gene functional annotation clustering for clusters 1 and 2. Terms are ordered based on their enrichment score. Modified Fisher extract P value and gene count are shown. Further details are available in Online Supplementary Table S4.
Figure 2.
Figure 2.
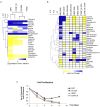
Metabolite levels in T-cell acute lymphoblastic leukemia cells are dynamic. (A) Heat map showing hierarchical clustering of the growth medium metabolites after 24 hours (h). Data are the average of 4 independent experiments ± standard deviation (SD). Scale bar represents log2 relative metabolite concentration. Metabolites with significantly different levels are shown. (B) Abundance of intracellular metabolites at 8 h or 24 h, relative to the time of medium change (0 h). Fold change was presented only for metabolites with significantly different relative levels with P<0.05. GPC: L-a glycerylphosphorylcholine; GalNAc: acetylgalactosamine; GlcNAc: N-acetylglucosamine. (C) Glutamine deprivation inhibits T-cell acute lymphoblastic leukemia (T-ALL) cell proliferation. T-ALL cell lines were cultured in medium with 10% fetal bovine serum, with or without 2 mM GlutaMax. Four independent cell cultures were assayed per cell line and each point represents the mean ± SD. Statistically significant differences were found when ARR was compared to any of the other cell lines at day 6 and 8 (P<0.05).
Figure 3.
Figure 3.
T-cell acute lymphoblastic leukemia cells utilize glutamine-derived nitrogen for de novo nucleotide synthesis. Metabolite tracing experiments using T-cell acute lymphoblastic leukemia (T-ALL) cell lines that were grown in the presence of 2 mM [,5-N]glutamine. (A) Overlay of 1D 1H-nuclear magnetic resonance (NMR) spectra showing the Hb-aspartate resonance after 0, 8 and 24 hours (h) and schematic representations of [,5-N]glutamine and the observed [2-N]aspartate. N are in red and shading indicates the observed J scalar couplings between the aspartate Hb and glutamine-derived N. The X-axis shows the chemical shift relative to TMSP in ppm and the Y-axis indicates TSA scaled intensity. (B) Resonances observed in H-N-HSQC for [U-N]ATP, [U-N]GTP, [U-N]UTP standards and for T-ALL cells extracts grown for 24 h in the presence of [,5-N]glutamine. Resonances are marked by letters a-e. Schematics show ATP, GTP and UTP with color-coded atoms based on the substrate of their origin (glutamine-purple, aspartate-orange, glycine-green, carbonate-black and N-red). Blue shaded lines indicate observed couplings annotated a-e. Asp: aspartate; Gln: glutamine; ATP: adenosine triphosphate; GTP: guanosine-5’-triphosphate; UTP: uridine-5′-triphosphate.
Figure 4.
Figure 4.
T-cell acute lymphoblastic leukemia cells utilize glutamine-derived carbon for de novo nucleotide synthesis. (A) Resonances observed in H-C-HSQC for T-cell acute lymphoblastic leukemia (T-ALL) cells grown for 24 hours (h) in the presence of [3-C]glutamine. Resonances are marked by letters a-e. Schematics on the right show glutamine, aspartate and uridine-5'-triphosphate (UTP) with color-coded atoms based on the substrate of their origin. Blue shaded lines indicate observed couplings annotated a-e. (B) Quantification of glutamine (Gln)-derived aspartate (Asp) and uridine diphosphate (UDP). Bar graphs show C signal intensity acquired from the cells grown in the presence of [3-C]glutamine for 24 h, relative to the signal acquired from the naturally occurring C observed in the extracts from cells grown without the label. Each bar represents one of the interactions shown in the schematics in (A). Data are the average of at least 3 independent experimental measurements ± standard deviation.
Figure 5.
Figure 5.
EAAT1 is expressed in T-cell acute lymphoblastic leukemia and localized in mitochondria. (A) Patient-derived T-cell acute lymphoblastic leukemia (T-ALL) cells have similar metabolic uptake to T-ALL cell lines. Only metabolites with changing concentration are illustrated. (B) Summary of the SLC1A3 expression levels as assessed by FPKM values from the RNA sequencing of 265 patient samples. Data are grouped by the level of expression. (C) SLC1A3 mRNA expression level in T-ALL cell lines and acute myeloid leukemia (AML) cell line Kasumi-1, relative to rRNA level assessed by quantitative polymerase chain reaction. (D) Western blot analysis of EAAT1 protein level using 150 µg total cell extract. PonceauS shows equal loading. (E) SLC1A3 mRNA expression level in ARR and in unstimulated or stimulated CD4+ or CD8+ human T cells, relative to rRNA expression. CD4+ and CD8+ thymocytes data represent the average ± standard deviation of 6 independent samples. (F) Immuno-fluorescent imaging shows that EAAT1 (green) co-localizes with MitoTracker Red CMXRos (magenta) in T-ALL but not Kasumi-1. Magnification 250X.
Figure 6.
Figure 6.
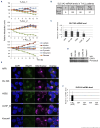
EAAT1 is essential for T-cell acute lymphoblastic leukemia proliferation and survival. (A) Protein level of EAAT1 and the reporter GFP protein upon the suppression of SLC1A3-IRES-GFP mRNA by short hairpin (sh)FF3 (negative control), shGFP (positive control) and 5 different shSLC1A3_1-5. Experiment was performed in duplicate. PonceauS staining illustrates equal loading. (B) Knock-down of the SLC1A3 gene by shSLC1A3_1 and shSLC1A3_2 leads to ARR, DU.528 and CCRF_M cell death. (C) To test the effect of EAAT1 inhibition, T-cell acute lymphoblastic leukemia (T-ALL) and acute myeloid leukemia (AML) cells were cultured for 6 days in the presence of vehicle (dimethyl sulfoxide [DMSO]), 25 µM UCPH-101, or 25 µM UCPH-102. Each data point is an average of 3 independent measurements ± standard deviation. (D) EAAT1 inhibition leads to a loss of aspartate and UTP production from glutamine. T-ALL cells were grown for 24 hours in culture media containing [3-C]glutamine in the presence of 25 µM UCPH-101 or vehicle (DMSO). Bar graphs show C signal intensity relative to the DMSO control. Each bar represents one of the interactions shown in the schematics in Figure 4A. Data are the average of 3 independent experiments ± standard deviation. UTP: uridine-5'-triphosphate.
Figure 7.
Figure 7.
EAAT1 is required for T-cell acute lymphoblastic leukemia xenograft development. (A) Mice were injected (iv) with 3x10⁵ CCRF-CEM cells carrying doxycycline-inducible short hairpin (sh)SLC1A3_2 or shGFP. At day 16, the food was supplemented with doxycycline. The bar graph shows the expansion of human CD45+ cells in the 2 cohorts of mice (N=5) during 6 days of doxycycline treatment. Two-tailed t test identified the difference between the 2 cohorts as significantly different (P<0.01). (B) Kaplan- Meier curve comparing the survival of mice injected with CCRF-CEM cells carrying doxycycline-inducible shSLC1A3 or shGFP. The induction of shRNA expression through addition of doxycycline in the food on day 16 is indicated. Log-rank test (right-tailed) identified the difference between the 2 cohorts as significantly different (P<0.05). (C) The number of TdTomato-positive cells relative to the total number of hCD45+ cells at day 6. Two-tailed t test identified the difference between the 2 cohorts as significantly different (P<0.01).
Figure 8.
Figure 8.
Model illustrating the function of mitochondrial EAAT1.

References

    1. Homminga I, Pieters R, Langerak AW, et al. . Integrated transcript and genome analyses reveal NKX2-1 and MEF2C as potential oncogenes in T cell acute lymphoblastic leukemia. Cancer Cell. 2011;19(4):484-497. - PubMed
    1. Liu Y, Easton J, Shao Y, et al. . The genomic landscape of pediatric and young adult T-lineage acute lymphoblastic leukemia. Nat Genet. 2017;49(8):1211-1218. - PMC - PubMed
    1. Chessells JM, Veys P, Kempski H, et al. . Long-term follow-up of relapsed childhood acute lymphoblastic leukaemia. Br J Haematol. 2003;123(3):396-405. - PubMed
    1. Vora A, Wade R, Mitchell CD, Goulden N, Richards S. Improved outcome for children and young adults with T-cell acute lymphoblastic leukaemia (ALL): results of the United Kingdom Medical Research Council (MRC) Trial UKALL 2003. Blood. 2008; 112(11):908.
    1. Hastings C, Gaynon PS, Nachman JB, et al. . Increased post-induction intensification improves outcome in children and adolescents with a markedly elevated white blood cell count (>/=200 x 10(9) /l) with T cell acute lymphoblastic leukaemia but not B cell disease: a report from the Children’s Oncology Group. Br J Haematol. 2015;168(4):533-546. - PMC - PubMed

MeSH terms

LinkOut - more resources