. 2024 Jun 11;96(23):9676-9683.
doi: 10.1021/acs.analchem.4c01615. Epub 2024 May 30.

Surface Acoustic Wave-Driven Enhancement of Enzyme-Linked Immunosorbent Assays: ELISAW

Affiliations

Surface Acoustic Wave-Driven Enhancement of Enzyme-Linked Immunosorbent Assays: ELISAW

Lei Zhang et al. Anal Chem. .

Abstract

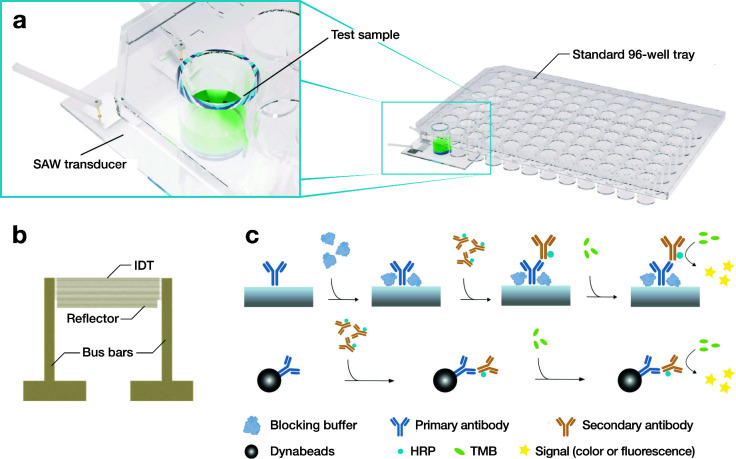
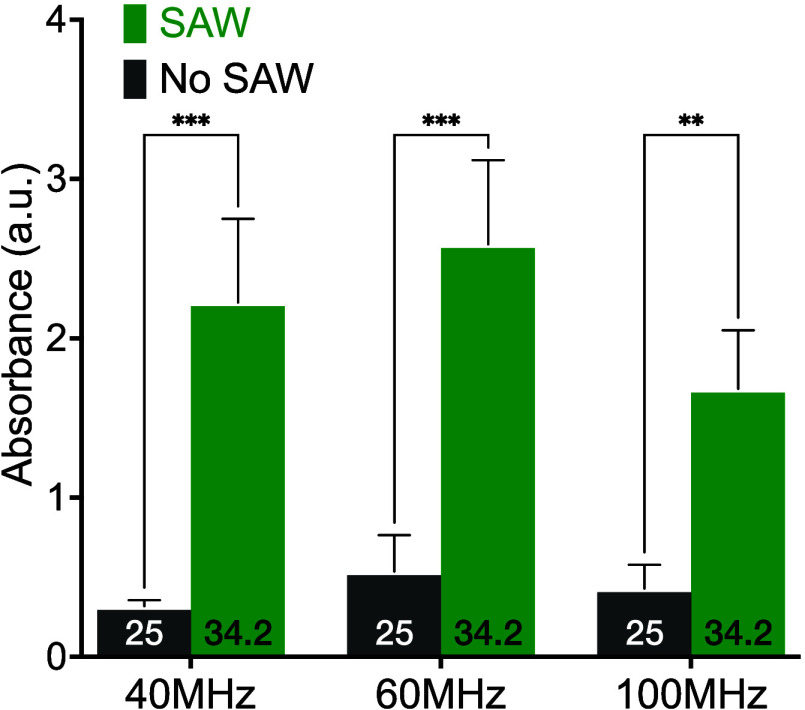
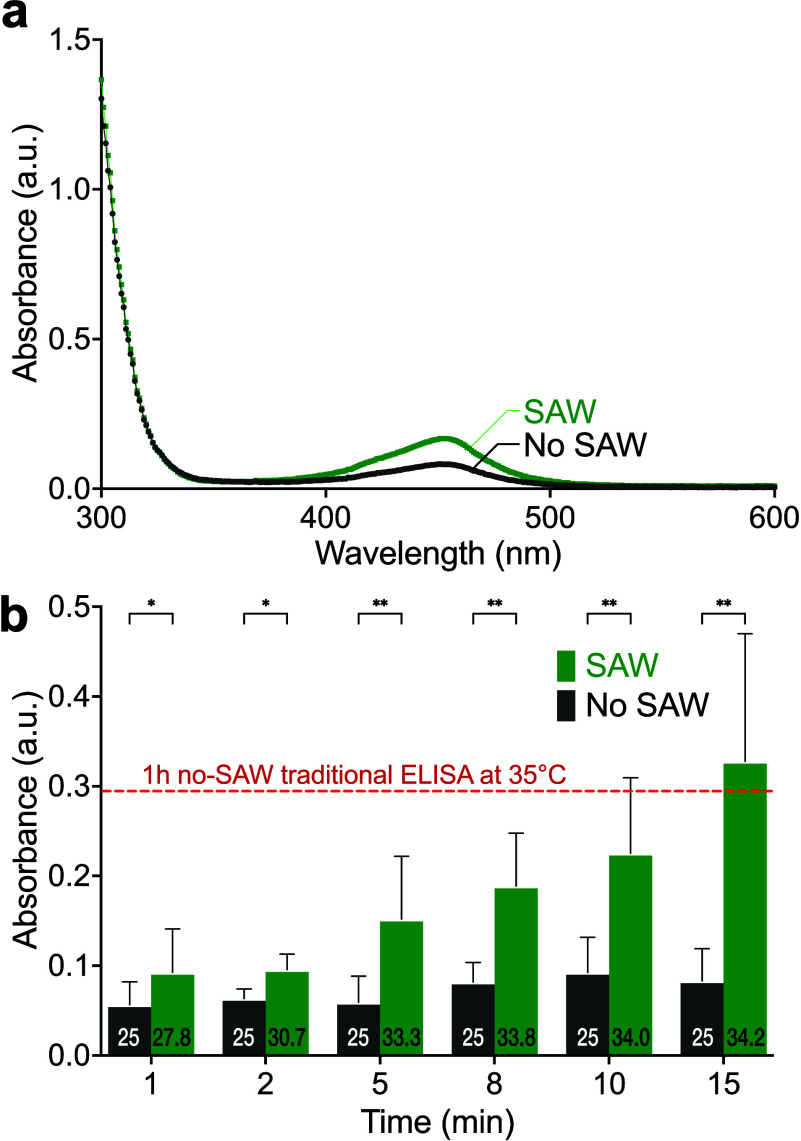
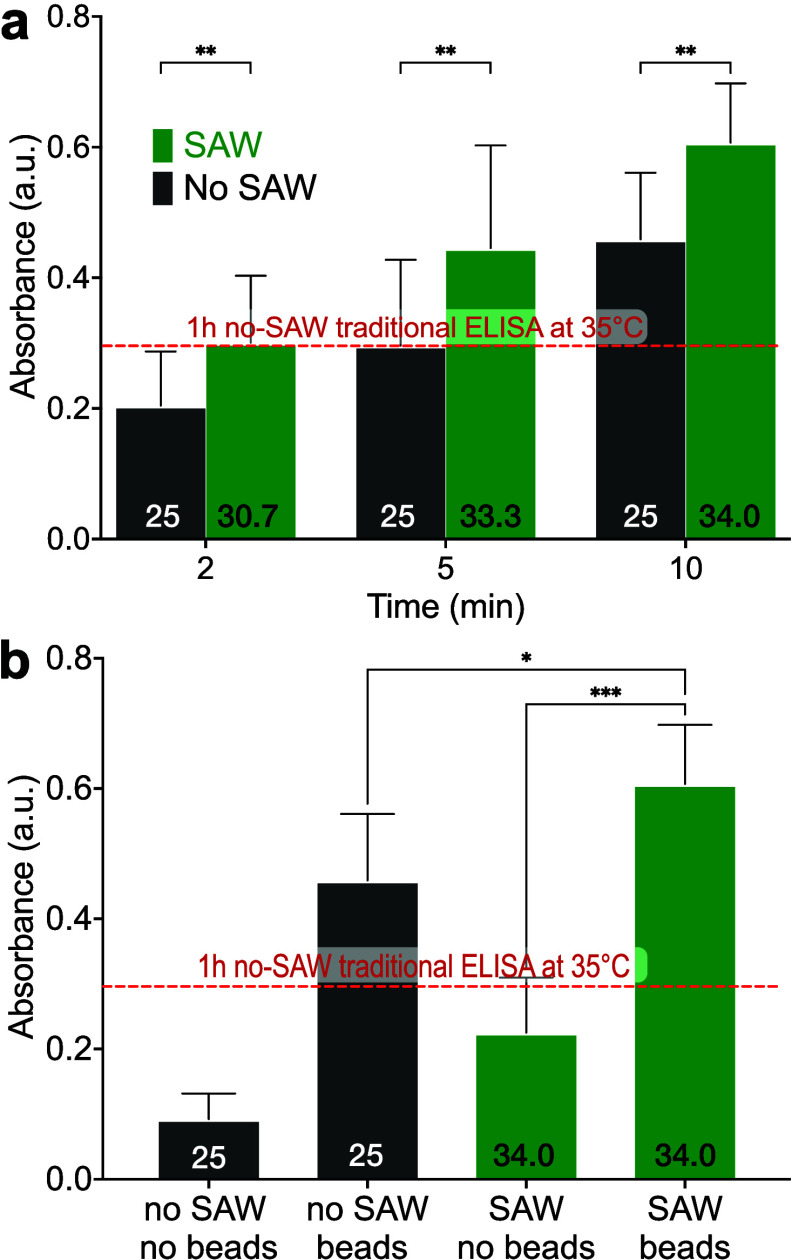
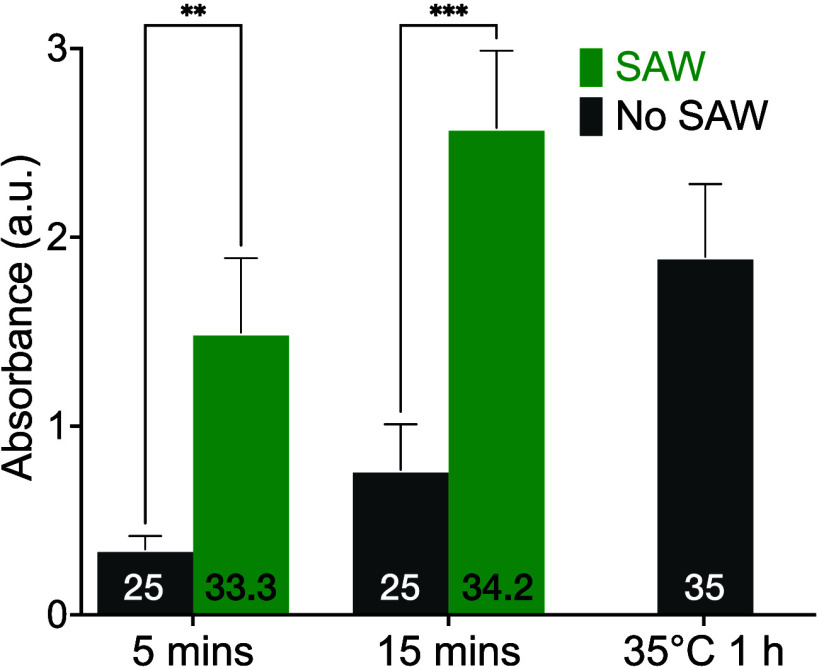
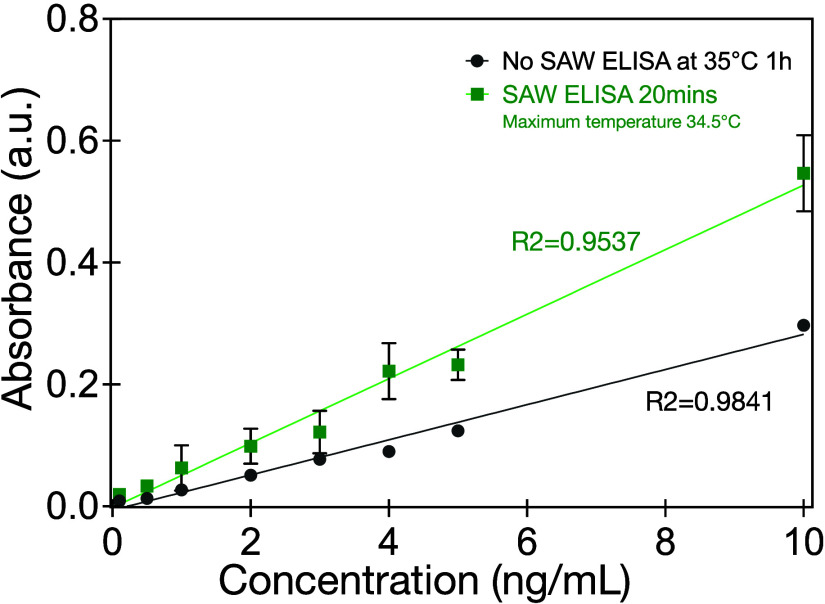
Enzyme-linked immunosorbent assays (ELISAs) are widely used in biology and clinical diagnosis. Relying on antigen-antibody interaction through diffusion, the standard ELISA protocol can be time-consuming, preventing its use in rapid diagnostics. We present a time-saving and more sensitive ELISA without changing the standard setup and protocol, using surface acoustic waves (SAWs) to enhance performance. Each step of the assay, from the initial antibody binding onto the walls of the well plate to the target analyte molecules' binding for detection─except, notably, for the blocking step─is improved principally via acoustic streaming-driven advection. Using SAWs, the time required for one step of an example ELISA is reduced from 60 to 15 min to achieve the same binding amount. By extending the duration of SAW exposure to 20 min, the sensitivity can be significantly improved over the 60 min, 35 °C ELISA without SAWs. It is also possible to confer beneficial improvements to bead-based ELISA by combining it with SAWs to further reduce the time required for binding to 2 min. By significantly increasing the speed of ELISA, its utility may be improved for a wide range of point-of-care diagnostics applications.


Conflict of interest statement

The authors declare no competing financial interest.

Figures

Figure 1
Figure 1
a) Overview of the experimental setup. The test well is 6 mm in diameter containing 200 μL of reagent solution, filling the well to a 6 mm depth. b) Top view of the IDT structure with 24 finger pairs for the IDT and 48 fingers for the reflector distant from the well side one side (here working at 60 MHz). c) The complete ELISA protocol used in this study; the SAW was used in the introduction of the primary antibody, secondary antibody, and analyte. The reason it was not used for the introduction of the blocking buffer is explained in the results.
Figure 2
Figure 2
Binding efficiency in terms of light absorbance plotted with respect to the application of 40, 60, and 100 MHz SAW at a particle velocity of 96 mm/s (see Experimental Section: Device Design, Fabrication, Testing, and Assays). The 96-well plates were coated with 200 μL of the goat antichicken IgY-HRP (250 ng/mL) in PBS with SAW for 15 min. Subsequently, TMB was incubated in the well for 5 min without SAW. The numbers at the bottom of each bar are the maximum temperature in the sample, in Celsius, during each run; with SAW, the temperature increased from 25 to 34.2 °C in 15 min. For the no-SAW condition, the ELISA was run at 25 °C from the start. Error bars represent the standard deviation of 6 independent trials. All data was confirmed to be normally distributed via the Shapiro-Wilk test; **p < 0.01, ***p < 0.001.
Figure 3
Figure 3
a) Absorbance plotted with respect to wavelength after 1 min with and without SAW already indicates a difference at about 450 nm, with the SAW producing a greater absorbance value. Repeating the (60 MHz, 0.8 W, 192 mm/s) SAW and no-SAW (control) protocols six times for 1 to 15 min describes b) the effect of time on the ELISA protocol. For these cases, there was no externally applied heating, and the temperature of the samples was at the lab temperature of 25 °C, initially for the SAW-driven samples, and throughout for the no-SAW (control) samples. The application of SAW also heats the samples, as indicated by the temperature values provided at the bottom of each bar. However, the heating is generally less than the standard protocol: heating of the sample to 35 °C. As a basis for comparison, the dotted red line represents the absorbance via the standard ELISA protocol of 1 h at 35 °C without SAW. Error bars represent the standard deviation of 6 independent trials. All data was confirmed to be normally distributed via the Shapiro-Wilk test; *p < 0.05, **p < 0.01.
Figure 4
Figure 4
Using a bead-based ELISA a) vastly improves the speed to produce an absorbance comparable to the standard 1-h, no-SAW, 35 °C ELISA protocol (red dashed line) after only 5 min, with 2.5 μL of Dynabeads (30 mg/mL) coated with 200 μL antiprotein A antibody (5 μg/mL) and dilution of the goat antichicken IgY-HRP stock solution to 10 ng/mL in PBS for this experiment. Adding 60 MHz, 192 mm/s, 0.8 W SAW to the bead-based ELISA significantly improves the speed to obtain the same results as the traditional protocol after only 2 min. Comparing the results after 10 min incubation, b) either introducing beads into the system or introducing SAW into the bead-based system significantly improves the absorbance. As before, the maximum temperature of the samples in Celsius is provided at the bottom of each bar. There was no externally applied heating, and the temperature of the samples was at the lab temperature of 25 °C, initially for the SAW-driven samples, and throughout for the no-SAW (control) samples. Error bars represent the standard deviation of 6 independent trials. All data was confirmed to be normally distributed via the Shapiro-Wilk test; *p < 0.05, **p < 0.01, ***p < 0.001.
Figure 5
Figure 5
Time course of antibody-well binding with and without 60 MHz, 0.8 W SAW control. 96-well plates were coated with 200 μL of the goat antichicken IgY-HRP (250 ng/mL) in PBS at 35 °C for 1 h, room temperature for 5, 15 min and SAW was applied for the indicated time as 5 and 15 min; TMB was then introduced and incubated without SAW for 5 min. Error bars represent a standard deviation of 5 independent trials; *p < 0.05, **p < 0.01, ***p < 0.001. The maximum temperature of the samples in Celsius is provided at the bottom of each bar. There was no externally applied heating, and the temperature of the samples was at the lab temperature of 25 °C, initially for the SAW-driven samples, and throughout for the no-SAW (control) samples. Comparing the traditional 35 °C, 1-h ELISA protocol shows that the improvement of the ELISA due to SAW is not due solely to heating.
Figure 6
Figure 6
Absorbance indicated binding versus target antigen concentration with and without 60 MHz, 0.8 W SAW. SAW improves the absorbance for the same concentration of the target antigen. Error bars represent the standard deviation of 3 independent trials.

Similar articles

Cited by

References

    1. Shan S.; Lai W.; Xiong Y.; Wei H.; Xu H. Novel strategies to enhance lateral flow immunoassay sensitivity for detecting foodborne pathogens. J. Agric. Food Chem. 2015, 63, 745–753. 10.1021/jf5046415. - DOI - PubMed
    1. Udenfriend S.Fluorescence assay in biology and medicine; Academic Press: London UK, 2014; Vol. 2.
    1. Sagot M.-A.; Heutte F.; Renard P.-Y.; Dollé F.; Pradelles P.; Ezan E. Detection of chemicals by a reporter immunoassay: application to fluoride. Anal. Chem. 2004, 76, 4286–4291. 10.1021/ac030395f. - DOI - PubMed
    1. Zhang Q.; Lian M.; Liu L.; Cui H. High-performance liquid chromatographic assay of parabens in wash-off cosmetic products and foods using chemiluminescence detection. Anal. Chim. Acta 2005, 537, 31–39. 10.1016/j.aca.2005.01.027. - DOI
    1. Di Nardo F.; Chiarello M.; Cavalera S.; Baggiani C.; Anfossi L. Ten years of lateral flow immunoassay technique applications: Trends, challenges and future perspectives. Sensors 2021, 21, 5185.10.3390/s21155185. - DOI - PMC - PubMed

Publication types