. 2024 Jun 27;262(2):e240051.
doi: 10.1530/JOE-24-0051. Print 2024 Aug 1.

Glucagon infusion alters the circulating metabolome and urine amino acid excretion in dogs

Affiliations

Glucagon infusion alters the circulating metabolome and urine amino acid excretion in dogs

Michael Merkhassine et al. J Endocrinol. .

Abstract

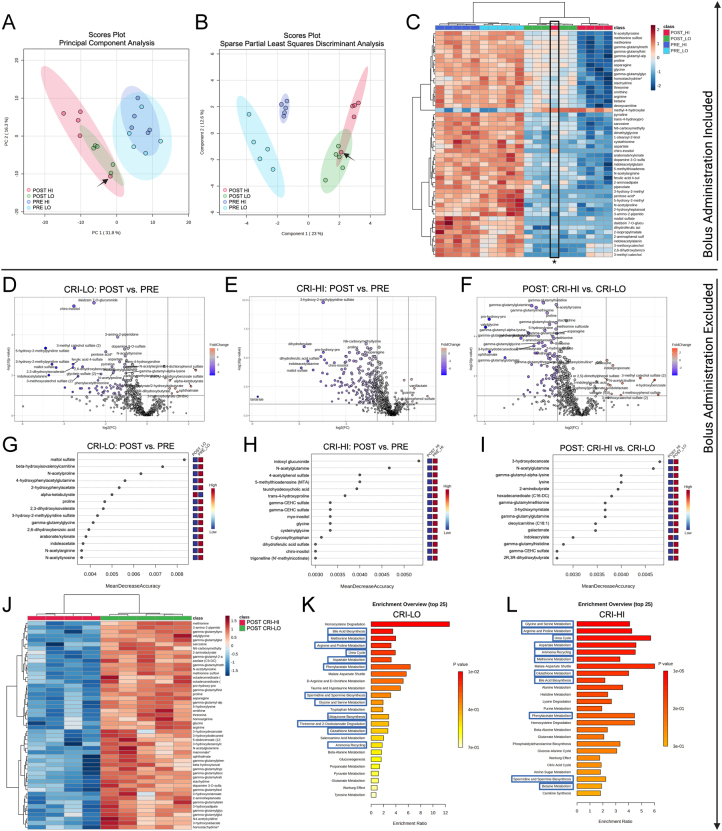
Glucagon plays a central role in amino acid (AA) homeostasis. The dog is an established model of glucagon biology, and recently, metabolomic changes in people associated with glucagon infusions have been reported. Glucagon also has effects on the kidney; however, changes in urinary AA concentrations associated with glucagon remain under investigation. Therefore, we aimed to fill these gaps in the canine model by determining the effects of glucagon on the canine plasma metabolome and measuring urine AA concentrations. Employing two constant rate glucagon infusions (CRI) - low-dose (CRI-LO: 3 ng/kg/min) and high-dose (CRI-HI: 50 ng/kg/min) on five research beagles, we monitored interstitial glucose and conducted untargeted liquid chromatography-tandem mass spectrometry (LC-MS/MS) on plasma samples and urine AA concentrations collected pre- and post-infusion. The CRI-HI induced a transient glucose peak (90-120 min), returning near baseline by infusion end, while only the CRI-LO resulted in 372 significantly altered plasma metabolites, primarily reductions (333). Similarly, CRI-HI affected 414 metabolites, with 369 reductions, evidenced by distinct clustering post-infusion via data reduction (PCA and sPLS-DA). CRI-HI notably decreased circulating AA levels, impacting various AA-related and energy-generating metabolic pathways. Urine analysis revealed increased 3-methyl-l-histidine and glutamine, and decreased alanine concentrations post-infusion. These findings demonstrate glucagon's glucose-independent modulation of the canine plasma metabolome and highlight the dog's relevance as a translational model for glucagon biology. Understanding these effects contributes to managing dysregulated glucagon conditions and informs treatments impacting glucagon homeostasis.

Keywords: amino acid; canine; glucagon; metabolome; metabolomics.


Conflict of interest statement

The authors declare that the research was conducted in the absence of any commercial or financial relationships that could be construed as a potential conflict of interest.

Figures

Figure 1
Figure 1
An overview of the experimental design. Five healthy purpose-bred research beagles received low-dose (3 ng/kg/min) and high-dose (50 ng/kg/min) glucagon CRIs over a 6-h period. Blood and urine samples were collected pre-infusion, hourly during the infusion, and post-infusion. Plasma and urine from pre- and post-infusion were then submitted for metabolomic profiling and amino acid analysis. Created with Biorender.com.
Figure 2
Figure 2
Serum glucagon and insulin measurements of dogs (n = 5) administered glucagon constant rate infusions. Serum glucagon (A) and insulin (B) concentrations were measured immediately before and hourly during the infusion. The dotted line in (A) indicates the upper range of the assay sensitivity, thus, values were estimated from the standard curve. Values are medians with error bars depicting the interquartile range. Statistical notations (‘a’ and ‘b’) above data points indicate significantly higher concentrations than the corresponding time-0 for the corresponding CRI group, i.e. high-dose (‘a’ = 50 ng/kg/min, CRI-HI) and low-dose (‘b’ = 3 ng/kg/min, CRI-LO) infusions.
Figure 3
Figure 3
Interstitial glucose (IG) readings via flash glucose monitoring system during glucagon constant-rate infusions. Glucose measurements from the (A) low-dose (3 ng/kg/min) and the (B) high-dose (50 ng/kg/min) glucagon infusions. Each line indicates an individual dog, corresponding to dog numbers in the legend. The shaded area indicates time points where IG was significantly greater than time-0. *P < 0.05, *P < 0.01.
Figure 4
Figure 4
Metabolomic analyses of dogs administered exogenous glucagon infusions. Global multivariate metabolomic analyses of dogs (n = 5) administered exogenous glucagon (A–C). Principal component (A) and sparse partial least squares discriminant (B) analyses of plasma metabolites before (PRE) and after (POST) glucagon infusions. (C) Heat map of the top (lowest P value) 50 metabolites PRE and after POST LO and 50 ng/kg/min (HI) glucagon infusions. The arrows (A) and asterisk (B) indicate one dog (#2) that received the 50 ng/kg glucagon infusion as an i.v. bolus over 10 min due to a pump error. Metabolomic analyses of dogs (n = 5 CRI-LO, n = 4 CRI-HI) administered glucagon as a constant rate infusion (CRI) excluding dog number 2 (D–L). Volcano plots (D–F) indicating significant metabolite changes POST glucagon CRI-LO (D) or CRI-HI (E) and POST CRI-HI compared to CRI-LO (F). Metabolites significantly (P < 0.05) increased (red) or decreased (blue) greater than two-fold, depicted by single dots. Random forest analysis (RFA) plots (G–I) identified metabolites that best fit a model for distinguishing groups. The RFA models establish metabolites for distinguishing POST glucagon CRI-LO (G) or CRI-HI (H) and POST CRI-LO to CRI-HI (I). Heat map (J) of the top (lowest P value) 50 metabolites comparing POST CRI-LO to POST CRI-HI. Pathway enrichment (over-representation) analysis (K,L). The top 25 small molecule pathway database pathways with over-represented significant plasma metabolites in CRI-LO (K) and CRI-HI (L) glucagon infusions are displayed and ranked by P value. Pathways boxed in blue indicate pathways also enriched when POST CRI-HI was compared to POST CRI-LO. Created with BioRender.com. CRI-LO/LO = 3 ng/kg/min glucagon infusion. CRI-HI/HI = 50 ng/kg/min glucagon infusion.
Figure 5
Figure 5
Changes in creatinine-normalized urine amino acid concentrations after a 6-h glucagon infusion. Violin plots indicating the effects on urine amino acid concentrations following the high-dose (50 ng/kg/min) glucagon infusion. Measured absolute amino acid concentrations (A) and concentration changes (B) in dogs before (T0, green) and after (T6, pink) the infusion. Dots indicate individual dog data points. Dashed lines indicate medians and dotted black lines indicate quartiles. Values for 1-methylhisitidine were removed from (A) for clarity. ***P < 0.001, ****P < 0.0001.

References

    1. Allenspach K Arnold P Glaus T Hauser B Wolff C Eberle C & Komminoth P. 2000Glucagon-producing neuroendocrine tumour associated with hypoaminoacidaemia and skin lesions. Journal of Small Animal Practice 41402–406. (10.1111/j.1748-5827.2000.tb03232.x) - DOI - PubMed
    1. Almdal TP Heindorff H Bardram L & Vilstrup H. 1990Increased amino acid clearance and urea synthesis in a patient with glucagonoma. Gut 31946–948. (10.1136/gut.31.8.946) - DOI - PMC - PubMed
    1. Assan R Attali JR Ballerio G Boillot J & Girard JR. 1977Glucagon secretion induced by natural and artificial amino acids in the perfused rat pancreas. Diabetes 26300–307. (10.2337/diab.26.4.300) - DOI - PubMed
    1. Bankir L Bouby N Blondeau B & Crambert G. 2016Glucagon actions on the kidney revisited: possible role in potassium homeostasis. American Journal of Physiology. Renal Physiology 311F469–F486. (10.1152/ajprenal.00560.2015) - DOI - PubMed
    1. Bertrand G Gross R Puech R Loubatières-Mariani MM & Bockaert J. 1993Glutamate stimulates glucagon secretion via an excitatory amino acid receptor of the AMPA subtype in rat pancreas. European Journal of Pharmacology 23745–50. (10.1016/0014-2999(9390091-U) - DOI - PubMed