. 2024 May 30;15(1):198.
doi: 10.1007/s12672-024-01047-4.

Identification of the biological functions and chemo-therapeutic responses of ITGB superfamily in ovarian cancer

Affiliations

Identification of the biological functions and chemo-therapeutic responses of ITGB superfamily in ovarian cancer

Jiawen Han et al. Discov Oncol. .

Abstract

Background: Patients with ovarian cancer (OC) tend to face a poor prognosis due to a lack of typical symptoms and a high rate of recurrence and chemo-resistance. Therefore, identifying representative and reliable biomarkers for early diagnosis and prediction of chemo-therapeutic responses is vital for improving the prognosis of OC.

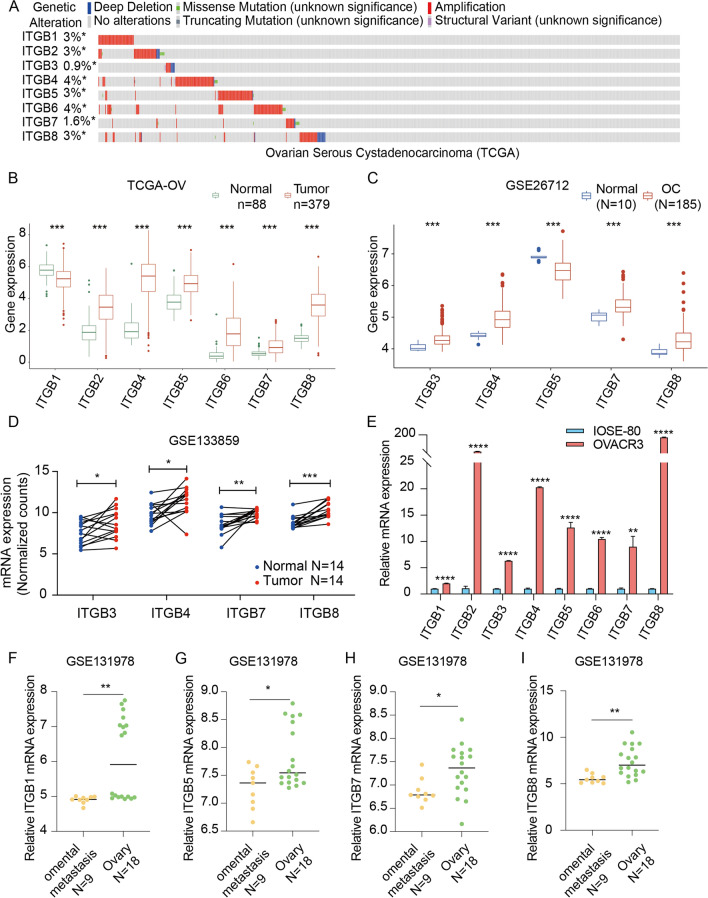
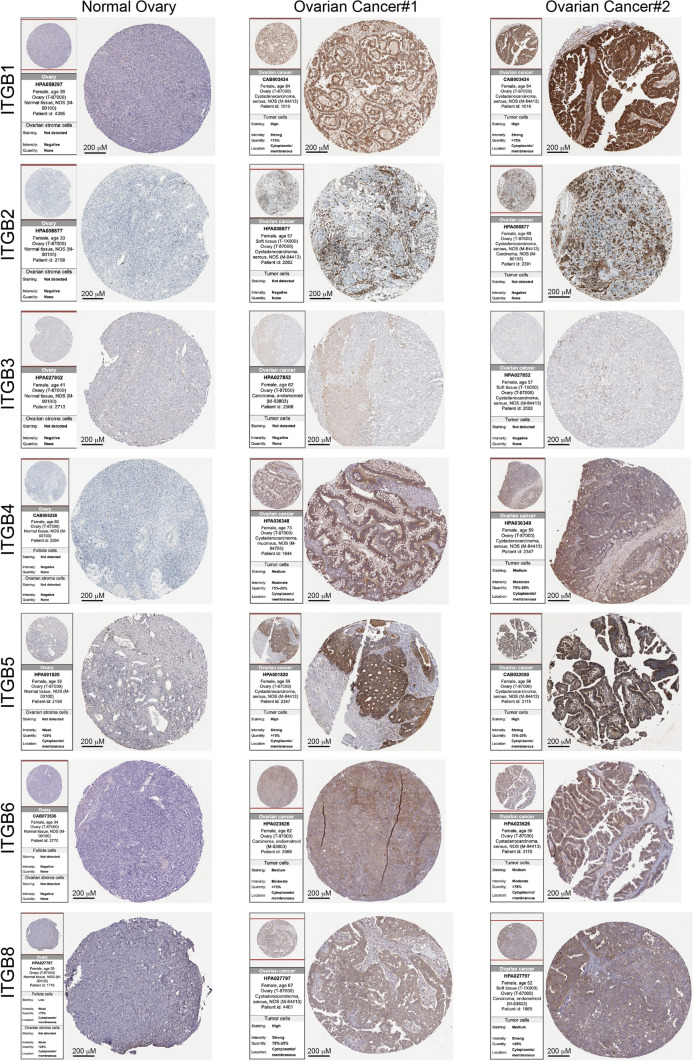
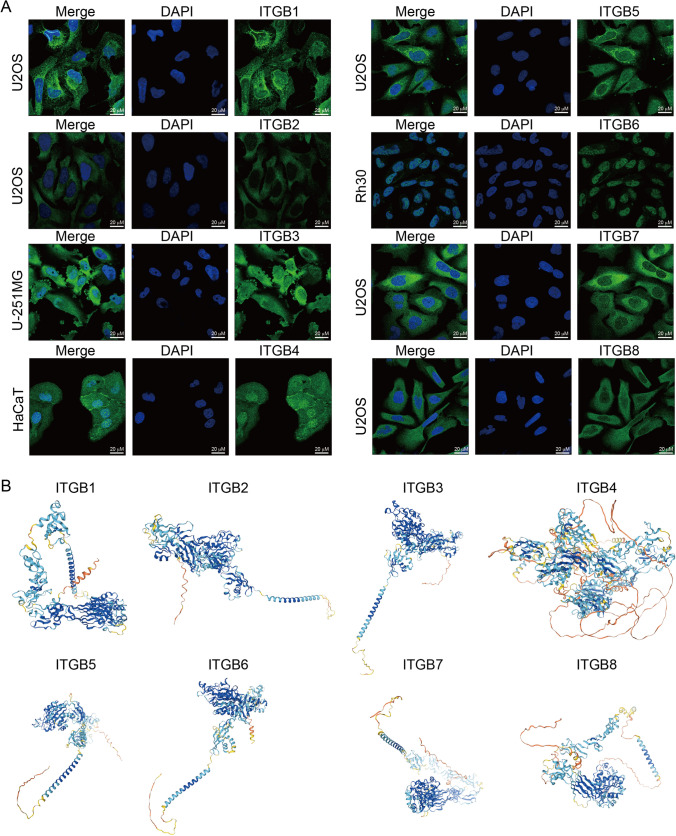
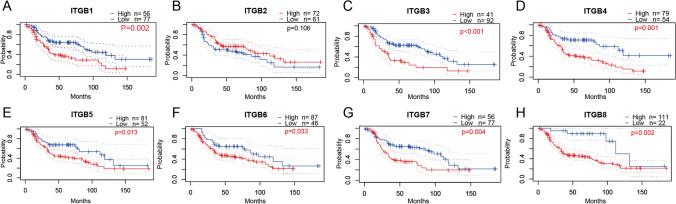
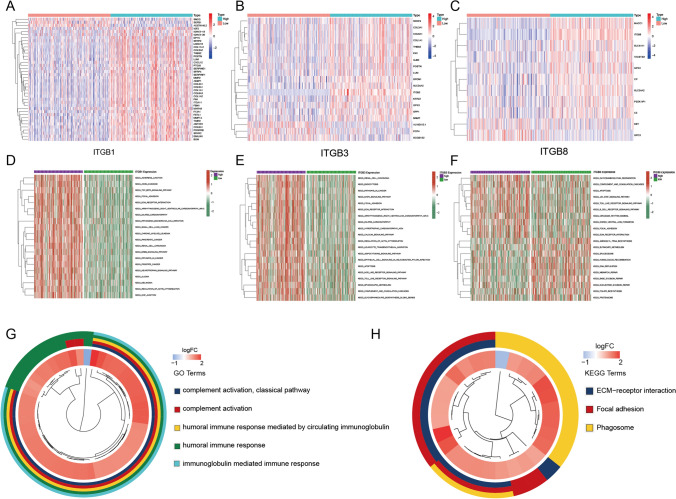
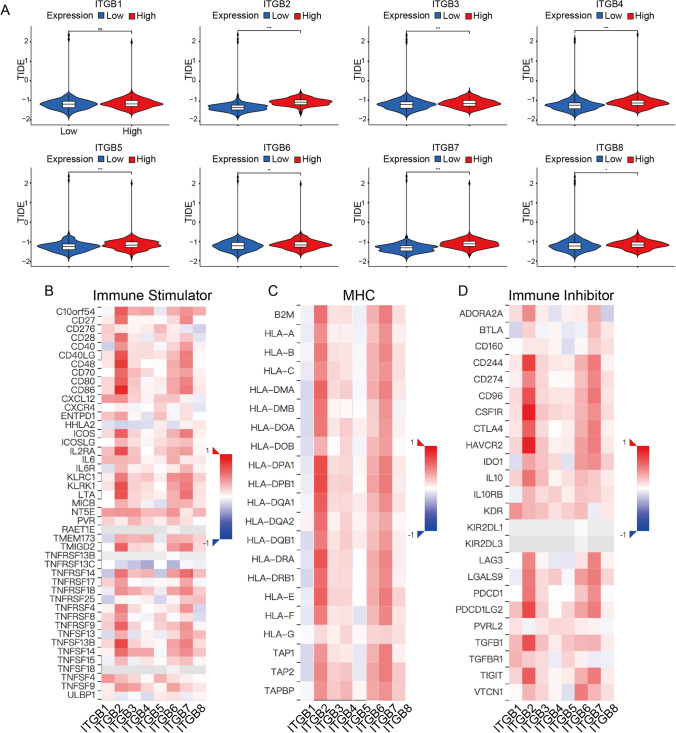
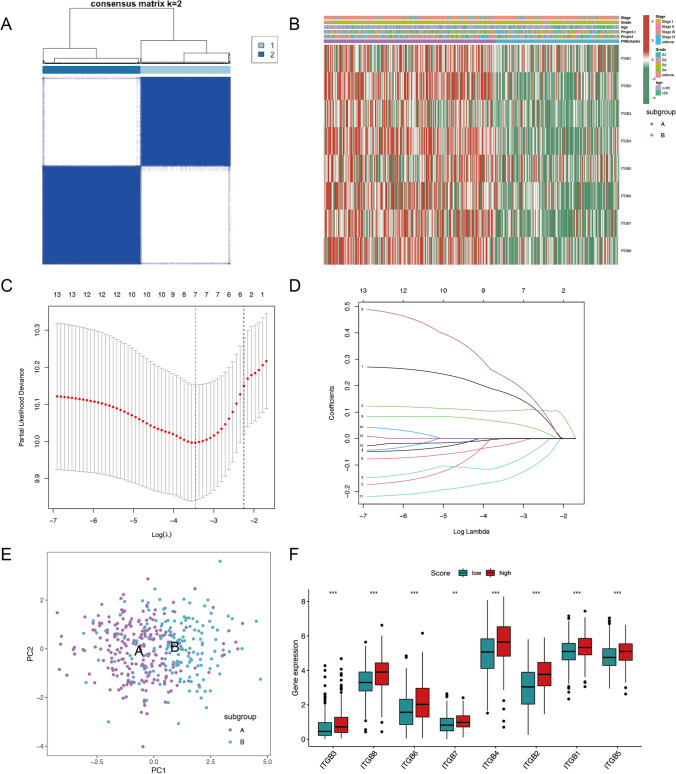
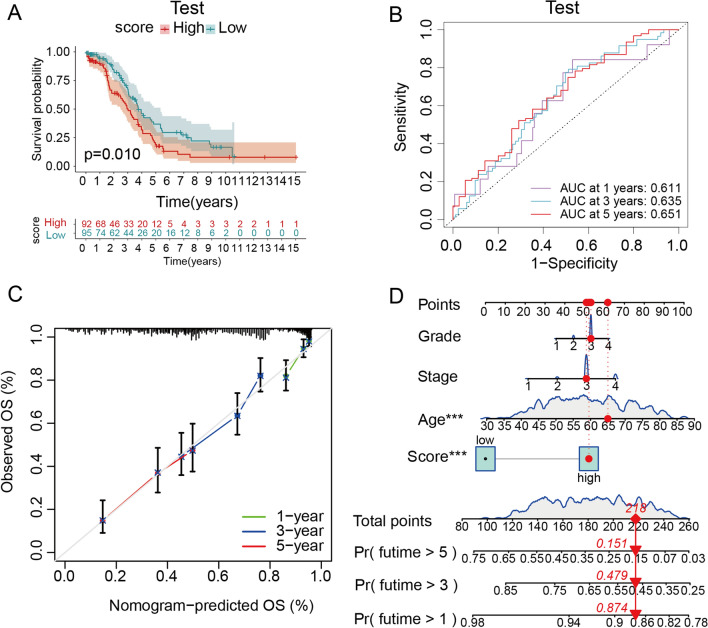
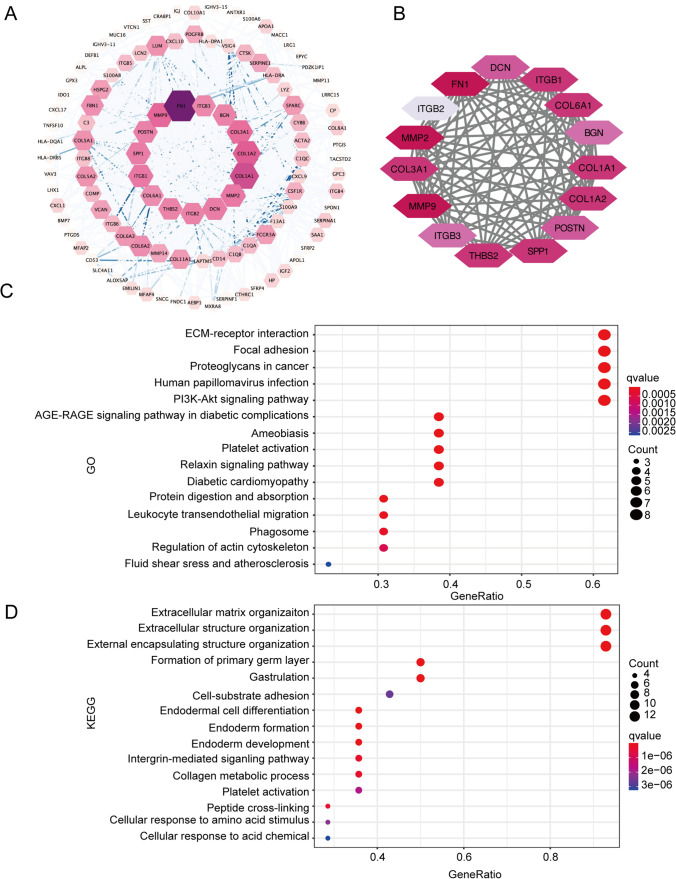
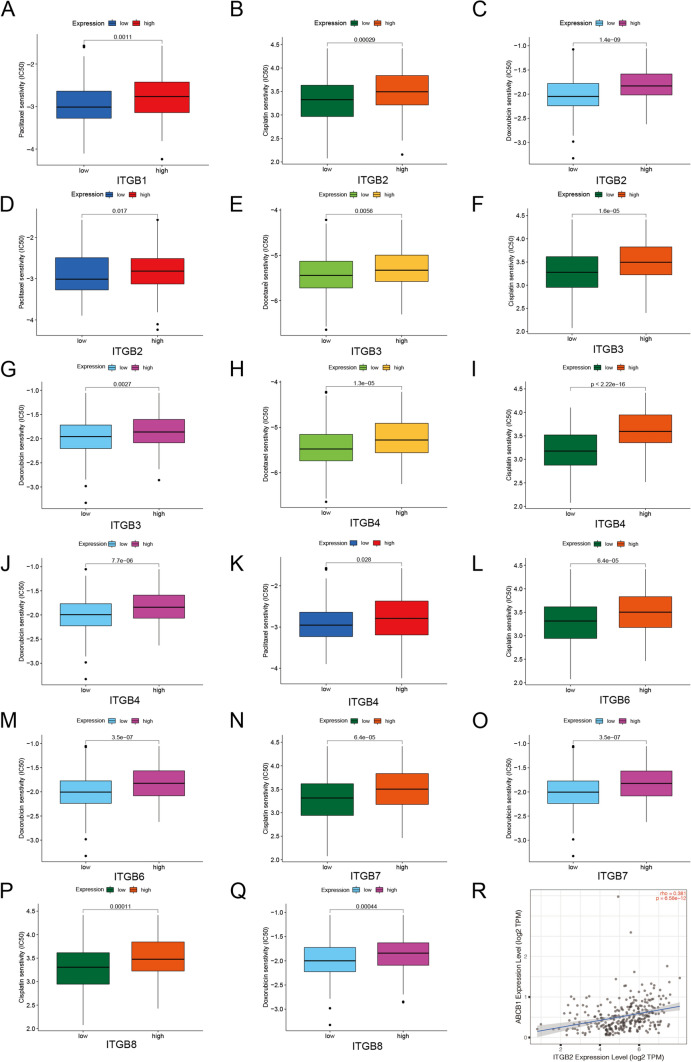
Methods: Expression levels, IHC staining, and subcellular distribution of eight ITGBs were analyzed using The Cancer Genome Atlas (TCGA)-Ovarian Serous Cystadenocarcinoma (OV) database, GEO DataSets, and the HPA website. PrognoScan and Univariate Cox were used for prognostic analysis. TIDE database, TIMER database, and GSCA database were used to analyze the correlation between immune functions and ITGBs. Consensus clustering analysis was performed to subtype OC patients in the TCGA database. LASSO regression was used to construct the predictive model. The Cytoscape software was used for identifying hub genes. The 'pRRophetic' R package was applied to predict chemo-therapeutic responses of ITGBs.

Results: ITGBs were upregulated in OC tissues except ITGB1 and ITGB3. High expression of ITGBs correlated with an unfavorable prognosis of OC except ITGB2. In OC, there was a strong correlation between immune responses and ITGB2, 6, and 7. In addition, the expression matrix of eight ITGBs divided the TCGA-OV database into two subgroups. Subgroup A showed upregulation of eight ITGBs. The predictive model distinguishes OC patients from favorable prognosis to poor prognosis. Chemo-therapeutic responses showed that ITGBs were able to predict responses of common chemo-therapeutic drugs for patients with OC.

Conclusions: This article provides evidence for predicting prognosis, immuno-, and chemo-therapeutic responses of ITGBs in OC and reveals related biological functions of ITGBs in OC.

Keywords: Biological function; Chemo-therapeutic; ITGB; Ovarian cancer; Prognostic prediction; Responses.


Conflict of interest statement

The authors have no relevant financial or non-financial interests to disclose.

Figures

Fig. 1
Fig. 1
Genomic mutant status and expression patterns of ITGBs in OC. A Genomic mutant status of ITGBs from the cBioPortal website. Amplification is the most evident genetic alteration. B Expression levels of ITGBs in 88 normal ovarian tissues and 379 OC tissues from TCGA-OV and GTEx databases. C Expression levels of ITGBs in the GSE26712 DataSet. D Paired expression levels of ITGBs in the GSE133859 DataSet. E qRT-PCR experiment of mRNA expression levels of ITGBs in IOSE-80 and OVCRA-3 cells. n = 3. Data was presented as mean ± SD. Unpaired student's t-test was used for the comparison. FI Expression levels of ITGB1, ITGB5, ITGB7, and ITGB8 in GSE131978 DataSet. P < 0.05 was considered as significant. *, P-value < 0.05; **, P-value < 0.01; ***, P-value < 0.001; ****, P-value < 0.0001
Fig. 2
Fig. 2
IHC staining images of ITGBs in OC from the HPA database. IHC staining images of seven ITGBs were downloaded from the HPA database in normal ovarian tissue and OC tissue. Origins of antibodies and tissue were presented in the left annotation beside each IHC image. Ovarian cancer#1 and Ovarian cancer#2 represent different OC samples. Scale bar, 200 µM
Fig. 3
Fig. 3
Subcellular distribution and 3D structure of eight ITGBs. A Immunofluorescence images of eight ITGBs in cell lines were downloaded from the HPA database. Scale bar, 20 µM. U-2 OS, sarcoma cell line. U-251MG, glioblastoma cell line. HaCaT, human immortalized epidermal cell line. Rh30, rhabdomyosarcoma cell line. The antibody for ITGB1 is CAB003434. The antibody for ITGB2 is HPA016894. The antibody for ITGB3 is HPA027852. The antibody for ITGB4 is HPA036348. The antibody for ITGB5 is CAB0220505. The antibody for ITGB6 is HPA023626. The antibody for ITGB7 is HPA042277. The antibody for ITGB8 is HPA027796. B The 3D structure of eight ITGBs was downloaded from AlphaFold, version 2
Fig. 4
Fig. 4
Kaplan–Meier survival analyses of ITGBs in OC. AH K-M plots of ITGBs in OC were downloaded from the PrognoScan website. Low expression of ITGB1, 3, 4, 5, 6, 7, and 8 correlated with a favorable prognosis of patients with OC. P-value < 0.05 was considered as significant
Fig. 5
Fig. 5
Biological function enrichment of ITGB1, ITGB3, and ITGB8. A Co-expression genes of ITGB1 were presented in the heatmap (FC > 1, P-value < 0.05). B Co-expression genes of ITGB3 were presented in the heatmap (FC > 1, P-value < 0.05). C Co-expression genes of ITGB8 were presented in the heatmap (FC > 1, P-value < 0.05). DF GSVA was based on the above co-expression genes of ITGB1, ITGB3, and ITGB8. The ‘limma’, ‘GSEABase’, and “GSVA’ packages were involved in GSVA. (G, H) A total of 268 co-expression genes of eight ITGBs were used for the cluster analyses of GO and KEGG enrichment. The inner circle represents the input 268 genes. Blue indicates genes that were downregulated in high-ITGBs groups and negatively correlated with ITGBs, while red indicates genes that were upregulated in high-ITGBs groups and positively correlated with ITGBS. The outer ring consists of different colors representing GO terms or KEGG pathways as the annotation presented. Genes of the inner ring correspond to the colored outer ring, indicating their involvement in these GO terms or KEGG pathways. The cluster analyses of GO and KEGG indicate the corresponding correlations between genes and terms. The ‘‘org.Hs.eg.db’, ‘enrichplot’, and ‘clusterProfiler’ R packages were used for the analyses. The ‘GOplot’ package was used for the plot. GO, Gene Ontology. KEGG, Kyoto Encyclopedia of Genes and Genomes
Fig. 6
Fig. 6
TIDE and immune regulatory analyses of ITGBs. A TIDE scores between high- and low-ITGBs groups. High-ITGBs groups had higher TIDE scores than low-ITGBs groups, indicating a high potential to evade anti-tumor immune responses. B Correlations between immune stimulators and eight ITGBs which was downloaded from the GSCA database. C Correlations between MHC and ITGBs. D Correlations between immune inhibitors and ITGBs. MHC, Major Histocompatibility Complex. *, P-value < 0.05; **, P-value < 0.01; ***, P-value < 0.001; ****, P-value < 0.0001
Fig. 7
Fig. 7
Consensus cluster of ITGBs in OC and predictive model construction. A Consensus cluster analysis was performed using the expression matrix of eight ITGBs in the TCGA-OV database. When k = 2, the expression matrix of ITGBs separated the TCGA-OV database into two distinct subgroups, A and B. B The expression patterns of eight ITGBs between two subgroups with clinical features in the heatmap. Eight ITGBs decreased in subgroup B. C A total of 144 different-expressed genes (FC > 1, P-value < 0.05) between two subgroups were used to construct the predictive model using LASSO regression analysis by the ‘glmnet’ R package. The partial likelihood deviance curve was plotted. The right dotted vertical lines were drawn at the optimal value by using the minimum criteria. D According to the optimal value of log (λ), the coefficient of each gene was plotted. E PCA distinguished subgroup A from B using the predictive model. F Each sample was calculated and scored by the predictive model. Therefore, the predictive model divided the TCGA-OV database into high- and low-score groups. Expression levels of eight ITGBs between high-score and low-score groups which were calculated by the predictive model. *, P-value < 0.05; **, P-value < 0.01; ***, P-value < 0.001
Fig. 8
Fig. 8
Validation of the predictive model in the test group and nomogram. A K-M plot between high- and low-score groups in the test group. B The Receiver Operating Characteristics (ROC) curve of the predictive model in the test group showed that the Area Under the Curve (AUC) at 1-, 3-, and 5-year are 0.611, 0.635, and 0.651 respectively. C Calibration for nomogram shows the consistency of the 1-, 3-, and 5-year overall survival (OS) rates which were predicted by the predictive model. D The nomogram shows an example of how the points were calculated in a representative patient. The survival time over 1-, 3-, and 5-year was predicted using the age, grade, stage, and predictive scores of the TCGA-OV database. The red dots represent points of an OC patient with grade III, stage III, 65-year-old, and high-score status. The total point of the above factors is 218, and the probability of over 5-, 3-, and 1-year survival is 0.151, 0.479, and 0.874, respectively, for this patient. P-value < 0.05 was considered as significant
Fig. 9
Fig. 9
PPI network and hub genes analysis. A A total of 268 co-expression genes of eight ITGBs were uploaded onto the STRING database to get the PPI network of eight ITGBs. The PPI network was visualized by the Cytoscape software. The color and size of each gene represent the degree of the corresponding gene. The minimum degree is 1 and the maximum degree is 67. Colored edges represent the co-expression values between genes. Only edges with co-expression value > 0.5 were colored with continuously deepened blue. B The top 15 hub genes were identified by degree parameter in the Cytoscape software. C GO analysis of the top 15 hub genes. D KEGG analysis of the top 15 hub genes
Fig. 10
Fig. 10
Chemo-therapeutic drug responses of ITGBs. AQ Box plot of the IC50 of paclitaxel, doxorubicin, docetaxel, and cisplatin between high- and low-ITGB1, ITGB2, ITGB3, ITGB4, ITGB6, ITGB7, and ITGB8 groups. The correlations between ITGBs and IC50 chemo-therapeutic drugs were analyzed using the ‘pRRophetic’ R package. R Spearman correlation between ABCB1 and ITGB2 was downloaded from the TIMER database. P-value < 0.05 was considered as significant

Similar articles

Cited by

References

    1. Sambasivan S. Epithelial ovarian cancer: review article. Cancer Treat Res Commun. 2022;33:100629. doi: 10.1016/j.ctarc.2022.100629. - DOI - PubMed
    1. Siegel RL, et al. Cancer statistics, 2023. CA Cancer J Clin. 2023;73(1):17–48. doi: 10.3322/caac.21763. - DOI - PubMed
    1. González-Martín A, et al. Newly diagnosed and relapsed epithelial ovarian cancer: ESMO Clinical Practice Guideline for diagnosis, treatment and follow-up. Ann Oncol. 2023;34(10):833–848. doi: 10.1016/j.annonc.2023.07.011. - DOI - PubMed
    1. Eisenhauer EA. Real-world evidence in the treatment of ovarian cancer. Ann Oncol, 2017. 28(suppl_8): p. viii61-viii65. - PubMed
    1. Marchetti C, et al. Chemotherapy resistance in epithelial ovarian cancer: Mechanisms and emerging treatments. Semin Cancer Biol. 2021;77:144–166. doi: 10.1016/j.semcancer.2021.08.011. - DOI - PubMed

LinkOut - more resources