. 2024 Jun 15;151(12):dev202870.
doi: 10.1242/dev.202870. Epub 2024 Jun 24.

An updated model of shoot apical meristem regulation by ERECTA family and CLAVATA3 signaling pathways in Arabidopsis

Affiliations

An updated model of shoot apical meristem regulation by ERECTA family and CLAVATA3 signaling pathways in Arabidopsis

Muhammad Uzair et al. Development. .

Abstract

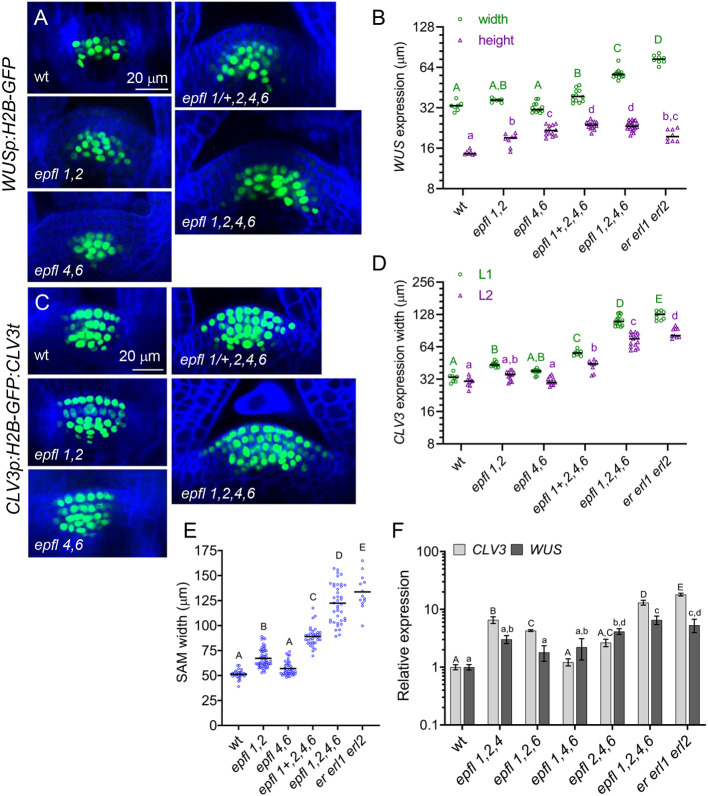
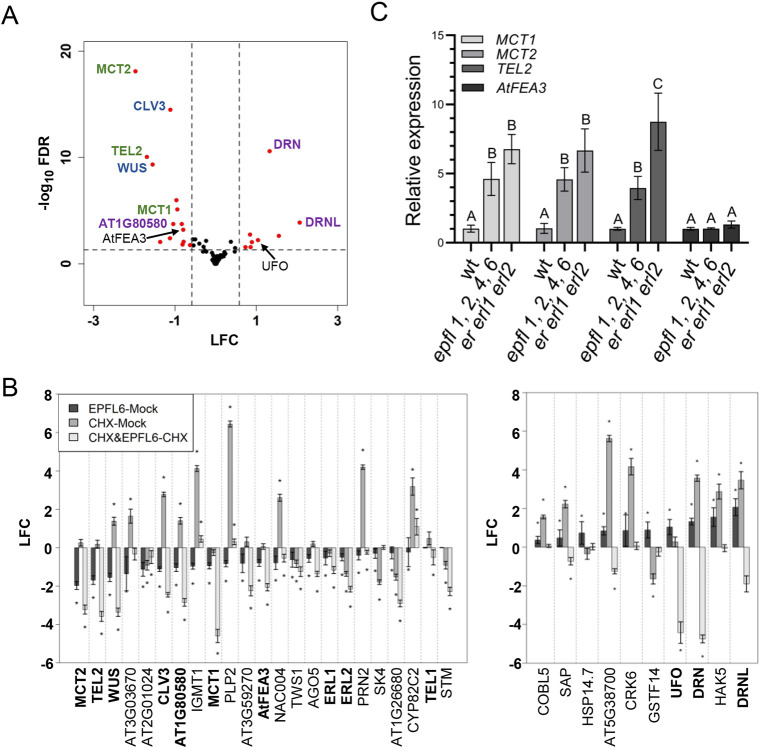
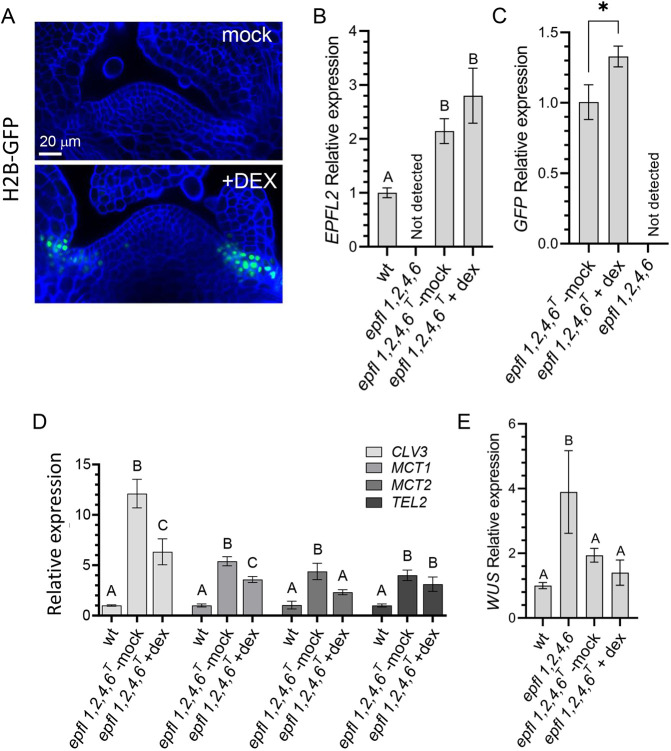
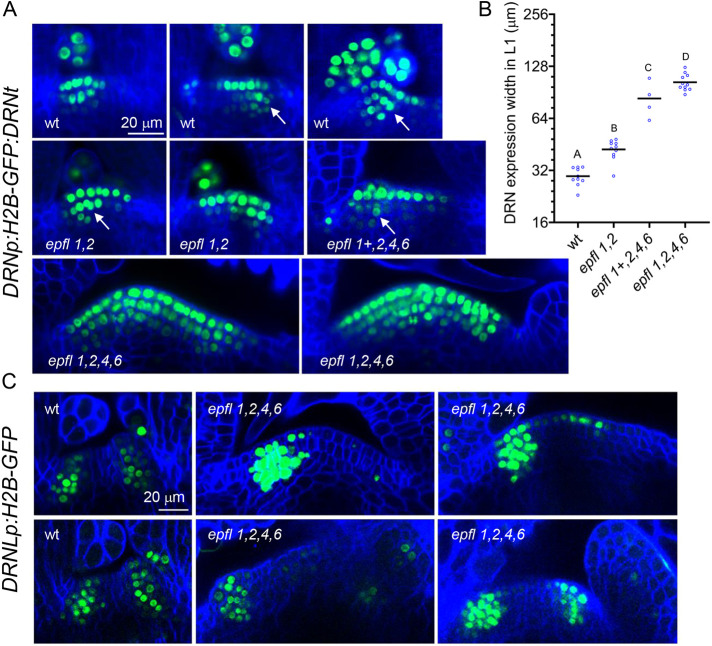
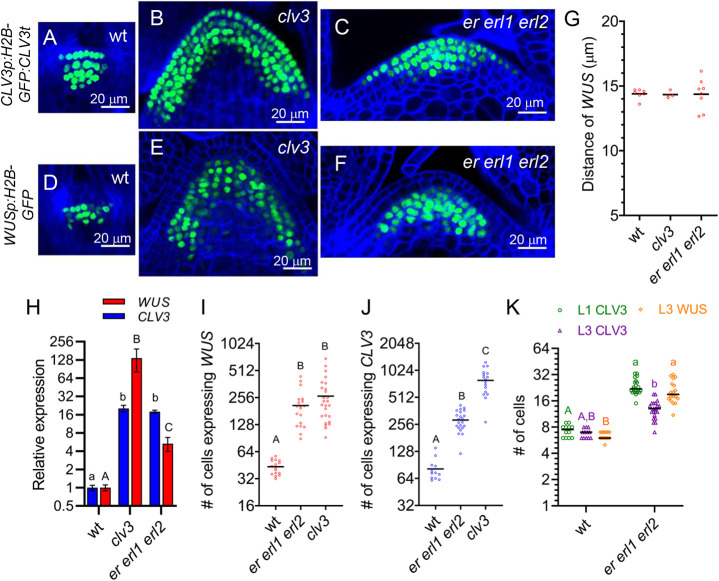
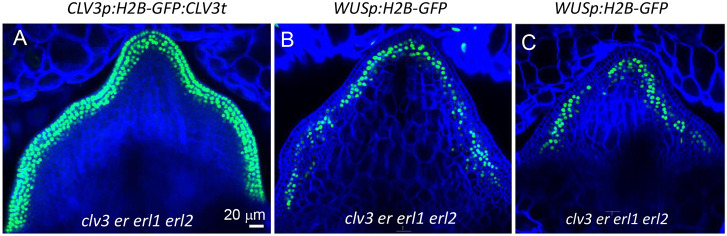
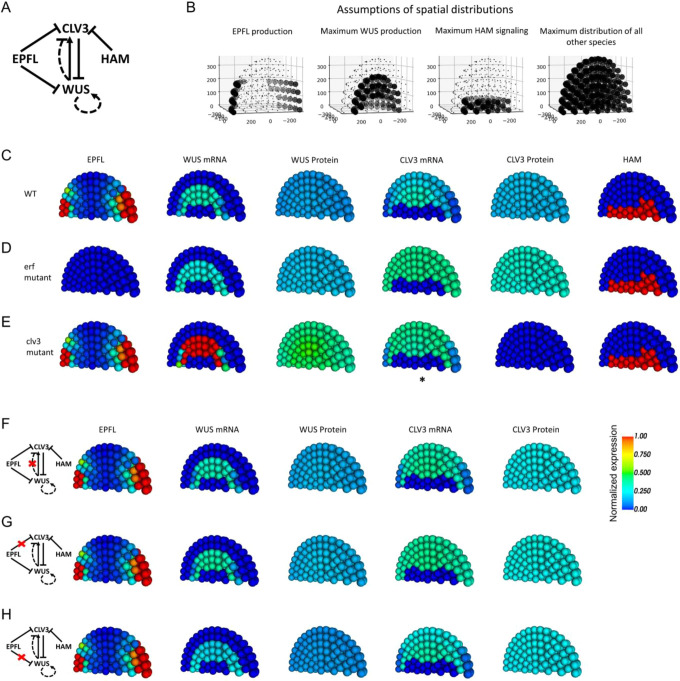
The shoot apical meristem (SAM) gives rise to the aboveground organs of plants. The size of the SAM is relatively constant due to the balance between stem cell replenishment and cell recruitment into new organs. In angiosperms, the transcription factor WUSCHEL (WUS) promotes stem cell proliferation in the central zone of the SAM. WUS forms a negative feedback loop with a signaling pathway activated by CLAVATA3 (CLV3). In the periphery of the SAM, the ERECTA family receptors (ERfs) constrain WUS and CLV3 expression. Here, we show that four ligands of ERfs redundantly inhibit the expression of these two genes. Transcriptome analysis confirmed that WUS and CLV3 are the main targets of ERf signaling and uncovered new ones. Analysis of promoter reporters indicated that the WUS expression domain mostly overlaps with the CLV3 domain and does not shift along the apical-basal axis in clv3 mutants. Our three-dimensional mathematical model captured gene expression distributions at the single-cell level under various perturbed conditions. Based on our findings, CLV3 regulates cellular levels of WUS mostly through autocrine signaling, and ERfs regulate the spatial expression of WUS, preventing its encroachment into the peripheral zone.

Keywords: Arabidopsis; EPFL; ERECTA; Shoot apical meristem; Stem cells; WUSCHEL.


Conflict of interest statement

Competing interests The authors declare no competing or financial interests.

Figures

Fig. 1.
Fig. 1.
Genes encoding EFPLs synergistically regulate the expression of CLV3 and WUS. (A,C) Representative confocal images of the SAM region of 3DPG seedlings of the indicated genotypes (wt, wild type) transformed with promoter reporters for (A) WUS (WUSp:H2B-GFP; green) or (C) CLV3 (CLV3p:H2B-GFP:CLV3t; green). All images are in the same panel are shown at the same magnification. The cell walls were stained with SR2200 (blue). (B) The width and height of the WUS expression region in seedlings of the indicated genotype, as shown by the H2B-GFP promoter reporter. n=7-20. (D) The width of CLV3 expression in the L1 and L2 layers for the indicated genotypes, as shown by the H2B-GFP promoter reporter. n=8-15. (E) Comparison of the SAM width at 3DPG for the indicated genotypes. n=13-54. Measurements in B, D and E were taken from confocal images. (F) RT-qPCR analysis of WUS and CLV3 in 3DPG seedlings of the indicated genotypes. n=3. Bars in B, D and E show the mean. Data in F are shown as the mean±s.d. Statistical differences were detected using a one-way ANOVA followed by a Tukey post-hoc test with P<0.05; letters denote statistically significance differences, with no statistically significant difference between groups marked by the same upper- or lower-case letter.
Fig. 2.
Fig. 2.
Downstream targets of EPFL6 based on RNAseq analysis. (A) A volcano plot shows changes in gene expression in 3DPG clv3 epfl1,2,4,6 seedlings after treatment with 10 µM EPFL6. Vertical dashed lines indicate an LFC cutoff of ±0.585; horizontal dashed lines mark the FDR cutoff of 0.05. Selected genes that are discussed in the manuscript are indicated. Blue indicates genes studied previously. Two groups of paralog genes are indicated by green and purple. (B) Comparison of changes in gene expression in response to 10 µM EPFL6 (versus mock treatment; EPFL6-Mock), 10 µM CHX (versus mock treatment; CHX-mock) and CHX+EPFL6 cotreatment versus only CHX treatment (CHX&EPFL6-CHX). Most genes downregulated in response to EPFL6 are also downregulated in response to CHX+EPFL6 (left panel). None of the genes upregulated in response to EPFL6 are upregulated in response to CHX+EPFL6 (right panel), suggesting that their upregulation is indirect. Genes discussed in the text are in bold. *FDR<0.05. Data are presented as the mean±s.e.m. of n=3 replicates. (C) RT-qPCR analysis of selected gene expression in 3DPG seedlings of the indicated genotypes (wt, wild type). Data are presented as the mean±s.d. of n=3. Statistical differences were detected using a one-way ANOVA followed by a Tukey post-hoc test with P<0.05; letters denote statistically significance differences, with no statistically significant difference between groups marked by the same letter.
Fig. 3.
Fig. 3.
Induction of EPFL2 in the SAM boundary leads to decreased expression of CLV3, MCT1 and MCT2. (A) Confocal images of 3DPG epfl1,2,4,6T seedlings following mock treatment or DEX treatment for 7 h. The seedlings express H2B-GFP (green) under the EPFL2 promoter in response to DEX. Both images were acquired with the same magnification, and the same settings were used for confocal microscopy. The cell walls were stained with SR2200 (blue). Images are representative of ten seedlings. (B-E) RT-qPCR analysis of (B) EPFL2; (C) H2B-GFP; (D) CLV3, MCT1, MCT2 and TEL2; and (E) WUS expression in (B,D,E) 3DPG wild-type (wt) seedlings, (B,C,E) 3DPG epfl1,2,4,6 seedlings and (B-E) 3DPG epfl1,2,4,6T seedlings expressing inducible EPFL2 and H2B-GFP under the EPFL2 promoter, with either mock treatment or DEX treatment as indicated. Data are presented as the mean±s.d. of n=3. Statistical differences were detected using a one-way ANOVA followed by a Tukey post-hoc test with P<0.05; letters denote statistically significance differences, with no statistically significant difference between groups marked by the same letter. *P<0.05 in C.
Fig. 4.
Fig. 4.
Broader expression of DRN and DRNL in the SAM of epfl mutants. (A,C) Representative confocal images of the SAM region of 3DPG seedlings of the indicated genotypes (wt, wild type) expressing a promoter reporter construct for (A) DRN (DRNp:H2B-GFP:DRNt; green) or (C) DRNL (DRNLp:H2B-GFP; green). White arrows in A indicate the induction of DRN in incipient leaf primordia. All images in the same panel are shown at the same magnification. The cell walls were stained with SR2200 (blue). Images are representative of 20 seedlings. (B) The average width of DRN expression in the L1 layer of the SAM was measured on the confocal images. Bars indicate the mean; n=4-11 seedlings. Statistical differences were detected using a one-way ANOVA followed by a Tukey post-hoc test with P<0.05; letters denote statistically significant differences.
Fig. 5.
Fig. 5.
CLV3 regulates the level of WUS expression but not its apical-basal pattern. (A-F) Confocal images of the SAM in 3DPG seedlings of the indicated genotypes (wt, wild type) expressing a promoter reporter construct for (A-C) CLV3 (CLV3p:H2B-GFP:CLV3t; green) or (D-F) WUS (WUSp:H2B-GFP; green). The cell walls were stained with SR2200 (blue). All images are shown at the same magnification. (G) The distance of the WUS domain from the top of the SAM in 3DPG seedlings of the indicated genotypes, measured using the H2B-GFP reporter as shown in D-F. n=4-8. (H) RT-qPCR of CLV3 and WUS in 3DPG seedlings of the indicated genotypes. n=15. (I,J) The number of cells expressing (I) WUS or (J) CLV3 in 3DPG seedlings of the indicated genotypes, as assessed using the promoter reporters shown in A-F. WUS, n=16-26; CLV3, n=12-22. (K) The number of cells expressing WUS or CLV3 in the L1 and L3 layers of the SAM of wild-type and er erl1 erl2 seedlings, determined as described in I and J. n=12-21. Bars in G and I-K indicate the mean. Data in H are presented as the mean±s.d. For H-K, statistical differences were detected using a one-way ANOVA followed by a Tukey post-hoc test with P<0.05; letters denote statistically significance differences, with no statistically significant difference between groups marked by the same upper- or lower-case letter. In I-K, horizontal lines represent the mean and points represent individual seedlings.
Fig. 6.
Fig. 6.
In the clv3 er erl1 erl2 mutant, cells that express WUS also express CLV3. (A-C) Representative confocal images of the SAM region of 3DPG clv3 er erl1 erl2 seedlings transformed with a promoter reporter construct for either (A) CLV3 (CLV3p:H2B-GFP:CLV3t; green) or (B,C) WUS (WUSp:H2B-GFP; green). All images are shown at the same magnification. The cell walls were stained with SR2200 (blue). Images are representative of ten seedlings for A and 20 for B and C.
Fig. 7.
Fig. 7.
A mathematical model of SAM patterning. (A) General gene regulatory network describing transcriptional regulation in the SAM. For CLV3 and WUS, both mRNA and protein are explicitly described, whereas only proteins were explicitly described for EPFLs and HAM. (B) Assumptions of maximum spatial distributions of regulatory factors in the absence of the regulations shown in A. Dots show the positions of simulated cells. Small dots indicate the absence of the factor from the regulatory network in A. Each length unit represents approximately 0.025 μm. (C-E) Model simulations under experimental conditions included in this study. The colors of the balls, which represent cells within the SAM, show normalized expression levels of the indicated factors (see Materials and Methods). CLV3 mRNA in the clv3 mutant (asterisk) is nonfunctional and is not translated. Because ERF mutants cannot perceive EPFL signals, in D the loss of ERF function (erf mutants) is represented as loss of EPFL expression. (F-H) Additional model conditions for predictions of the roles of specific transcriptional regulations. The specific transcriptional regulation perturbed in each panel is indicated by a red X.

Similar articles

References

    1. Abrash, E. B., Davies, K. A. and Bergmann, D. C. (2011). Generation of signaling specificity in Arabidopsis by spatially restricted buffering of ligand−receptor interactions. Plant Cell 23, 2864-2879. 10.1105/tpc.111.086637 - DOI - PMC - PubMed
    1. Anderson, G. H., Alvarez, N. D. G., Gilman, C., Jeffares, D. C., Trainor, V. C. W., Hanson, M. R. and Veit, B. (2004). Diversification of genes encoding Mei2-like RNA binding proteins in plants. Plant Mol. Biol. 54, 653-670. 10.1023/B:PLAN.0000040819.33383.b6 - DOI - PubMed
    1. Bäurle, I. and Laux, T. (2005). Regulation of WUSCHEL transcription in the stem cell niche of the Arabidopsis shoot meristem. Plant Cell 17, 2271-2280. 10.1105/tpc.105.032623 - DOI - PMC - PubMed
    1. Brand, U., Fletcher, J. C., Hobe, M., Meyerowitz, E. M. and Simon, R. (2000). Dependence of stem cell fate in Arabidopsis on a feedback loop regulated by CLV3 activity. Science 289, 617-619. 10.1126/science.289.5479.617 - DOI - PubMed
    1. Capua, Y. and Eshed, Y. (2017). Coordination of auxin-triggered leaf initiation by tomato LEAFLESS. Proc. Natl Acad. Sci. USA 114, 3246-3251. 10.1073/pnas.1617146114 - DOI - PMC - PubMed

MeSH terms